1. What Exactly is the iShares USD Asia High Yield Bond ETF?
Unlike an equity ETF, which invests in shares of listed companies, the iShares USD Asia High Yield Bond ETF invests in USD-denominated bonds issued by Asian governments and corporations.
The ETF is listed on the Singapore Exchange in 2 trading currencies:
- SGX: QL3 – traded in Singapore Dollars (SGD)
- SGX: O9P – traded in United States Dollars (USD)
Regardless of which counter you purchase, both represent ownership of the same underlying fund.
Rather than researching and purchasing individual bonds yourself, investing in the ETF allows you to gain exposure to a diversified portfolio through a single investment.
As at 10 July 2026, the ETF holds 198 bonds with approximately US$562 million in assets under management.
2. Which Index does the ETF Track?
The ETF seeks to replicate the performance of the Bloomberg Asia USD High Yield Diversified Credit Index.
The index measures the performance of a diversified basket of USD-denominated high-yield bonds issued by governments and companies across Asia (excluding Japan).
Instead of relying on a fund manager to actively select bonds, the ETF simply aims to mirror the holdings of the index as closely as possible. This gives investors exposure to almost 200 bonds through a single investment while keeping management costs relatively low, at 0.50%.
3. What is the Credit Quality of the Bonds?
The ETF invests primarily in bonds rated:
- Ba1 and below by Moody’s; or
- BB+ and below by S&P Global Ratings and Fitch.
These are commonly known as high-yield bonds, or more commonly, ‘junk bonds’.
If you’re new to bond investing, here’s what that means.
Independent credit rating agencies assess how likely a borrower is to repay its debt. Generally speaking, bonds rated BBB− (or Baa3 by Moody’s) and above are considered investment-grade, while bonds rated BB+ (or Ba1 by Moody’s) and below fall into the high-yield category.
Because these issuers are viewed as carrying a higher risk of default, investors demand a higher interest rate as compensation for taking on the additional risk.
Although the term ‘junk bond’ sounds alarming, it doesn’t mean the bond is worthless or that the issuer is destined to default. Rather, it simply indicates that the issuer is considered riskier than an investment-grade borrower.
One advantage of investing through an ETF is diversification. Instead of depending on the financial strength of just one company, the ETF spreads its investments across close to 200 different bonds. As such, even if one issuer encounters financial difficulties, its impact on the overall portfolio is likely to be much smaller than if you owned only one or two individual high-yield bonds.
4. Who are the Top 10 Issuers of the ETF?
As at 10 July 2026, the ETF’s top 10 issuers account for 35.65% of the portfolio.
Its largest holdings include:
- Sri Lanka (Democratic Socialist Republic of)
- Rakuten Group Inc.
- Nissan Motor Co. Ltd.
- SoftBank Group Corporation
- Wynn Macau Ltd.
- Vedanta Resources Finance II PLC
- Melco Resorts Finance Ltd.
- Pakistan (Islamic Republic of)
- Mineral Resources Ltd.
- Fortescue Treasury Pty Ltd.
Apart from the top 3 issuers, no single issuer accounts for more than 4% of the ETF, reducing concentration risk.
5. What is the Exposure of the ETF Geographically?
The ETF is geographically well diversified across Asia.
As at 10 July 2026, its largest country exposures are:
- India (18.12%)
- Japan (16.58%)
- Macau (11.97%)
- China (10.38%)
- Australia (7.76%)
- The Philippines (5.97%)
- Pakistan (5.72%)
- Hong Kong (4.80%)
- Sri Lanka (4.05%)
- Singapore (3.40%)
- Mongolia (3.30%)
- Indonesia (2.91%)
Collectively, these countries account for 94.96% of the portfolio.
6. What is the Breakdown of the Industries Comprising this ETF?
The ETF is diversified across multiple industries.
Its 3 largest sectors are:
- Metals & Mining (13.6%)
- Gaming (12.4%)
- Sovereign (10.6%)
Together, these sectors account for approximately 36.6% of the ETF.
For those unfamiliar with the term, sovereign refers to bonds issued by national governments rather than private companies.
7. When is the Maturity of the Bonds in the ETF?
As at 10 July 2026, the bond maturities are spread across different time horizons:
- Less than 1 year – 11%
- 1 to 2 years – 18%
- 2 to 3 years – 19%
- 3 to 5 years – 33%
- More than 5 years – 19%
This staggered maturity profile helps avoid having too many bonds maturing at the same time.
8. What is the Distribution Payout of the ETF?
The ETF distributes income quarterly, typically in early March, June, September and December.
Over the past 5 years, its annual distributions have remained relatively stable:
| Year | Distribution Per Unit (S$) | Distribution Yield (%) |
| 2021 | S$0.50 | 4.3% |
| 2022 | S$0.51 | 5.9% |
| 2023 | S$0.49 | 5.9% |
| 2024 | S$0.52 | 5.8% |
| 2025 | S$0.49 | 5.7% |
While the distribution yield has been attractive, investors should remember that distributions are not guaranteed and may vary depending on market conditions.
9. What are Some of the Risks Associated with the ETF?
Like any investment, this ETF carries risks. The key ones include:
i. Credit Risk – The ETF invests mainly in lower-rated bonds, which means the issuers carry a higher risk of running into financial difficulties.
ii. Default Risk – If an issuer fails to repay its debt, the value of its bonds may fall sharply. Fortunately, the ETF’s diversification helps reduce the impact of any single default.
iii. Interest Rate Risk – Bond prices generally move in the opposite direction of interest rates. Rising interest rates typically lead to falling bond prices.
iv. Economic Risk – During recessions, companies are generally less profitable and may find it harder to service their debt, increasing the risk of defaults.
v. Regional Risk – Since the ETF focuses on Asia, developments such as slower economic growth, policy changes or geopolitical tensions within the region could affect its performance.
10. How has the ETF Performed over the Past 5 Years?
The iShares USD Asia High Yield Bond ETF has experienced significant price volatility over the past 5 years (I’m looking at the Singapore Dollar-denominated chart here):
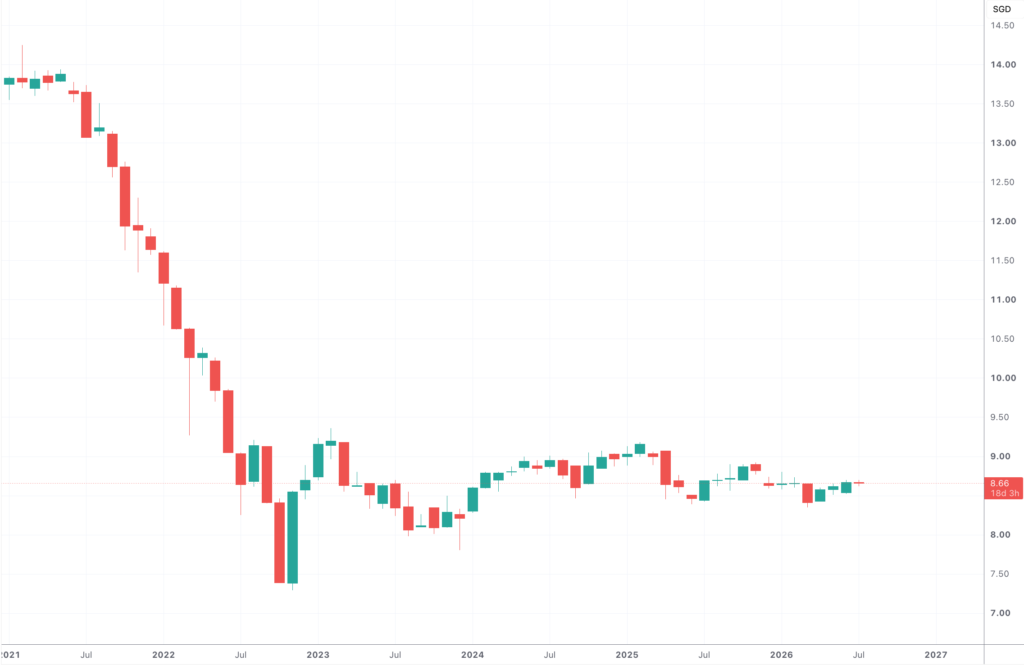
Between February 2021 and November 2022, its unit price fell from approximately S$14.25 to S$7.29, largely due to aggressive interest rate hikes by the US Federal Reserve to combat high inflation.
Although the unit price has since stabilised, it has generally traded within a range of S$8.45 to S$8.90.
An investor who bought the ETF at the beginning of 2021 and remained invested until the end of 2025 would have experienced an unrealised capital loss of approximately 37%. Even after accounting for distributions received over the period, the overall return would still have been negative by roughly 19%.
This serves as an important reminder that while high-yield bond ETFs can provide attractive income, they are still subject to capital losses – particularly during periods of rising interest rates.
Closing Thoughts
In my opinion, the iShares USD Asia High Yield Bond ETF is better suited for investors who are comfortable taking on a higher level of risk in exchange for potentially higher income.
Although it invests in bonds, investors should not mistake it for a low-risk investment. The ETF’s performance is heavily influenced by interest rates, credit conditions and the health of the regional economy. As we saw in 2021 and 2022, rising interest rates alone were enough to cause the ETF’s unit price to fall by almost 50%.
On the positive side, the ETF is well-diversified across almost 200 bonds, multiple countries and a broad range of industries. This significantly reduces the impact that any single issuer defaulting could have on the overall portfolio. The bond maturities are also reasonably spread out, reducing refinancing concentration risk.
For investors seeking regular income and who understand the additional risks associated with high-yield bonds, the ETF may serve as a useful diversifier within a broader investment portfolio. However, for more conservative investors seeking capital preservation, investment-grade bond ETFs or government bond funds may be more appropriate.
Disclaimer: At the time of writing, I do not have any units of the iShares Barclays USD Asia High Yield Bond Index ETF.
Join Me for a FREE Live Online Chit-Chat on Thursday, 12 November, from 8–9pm (SGT)!
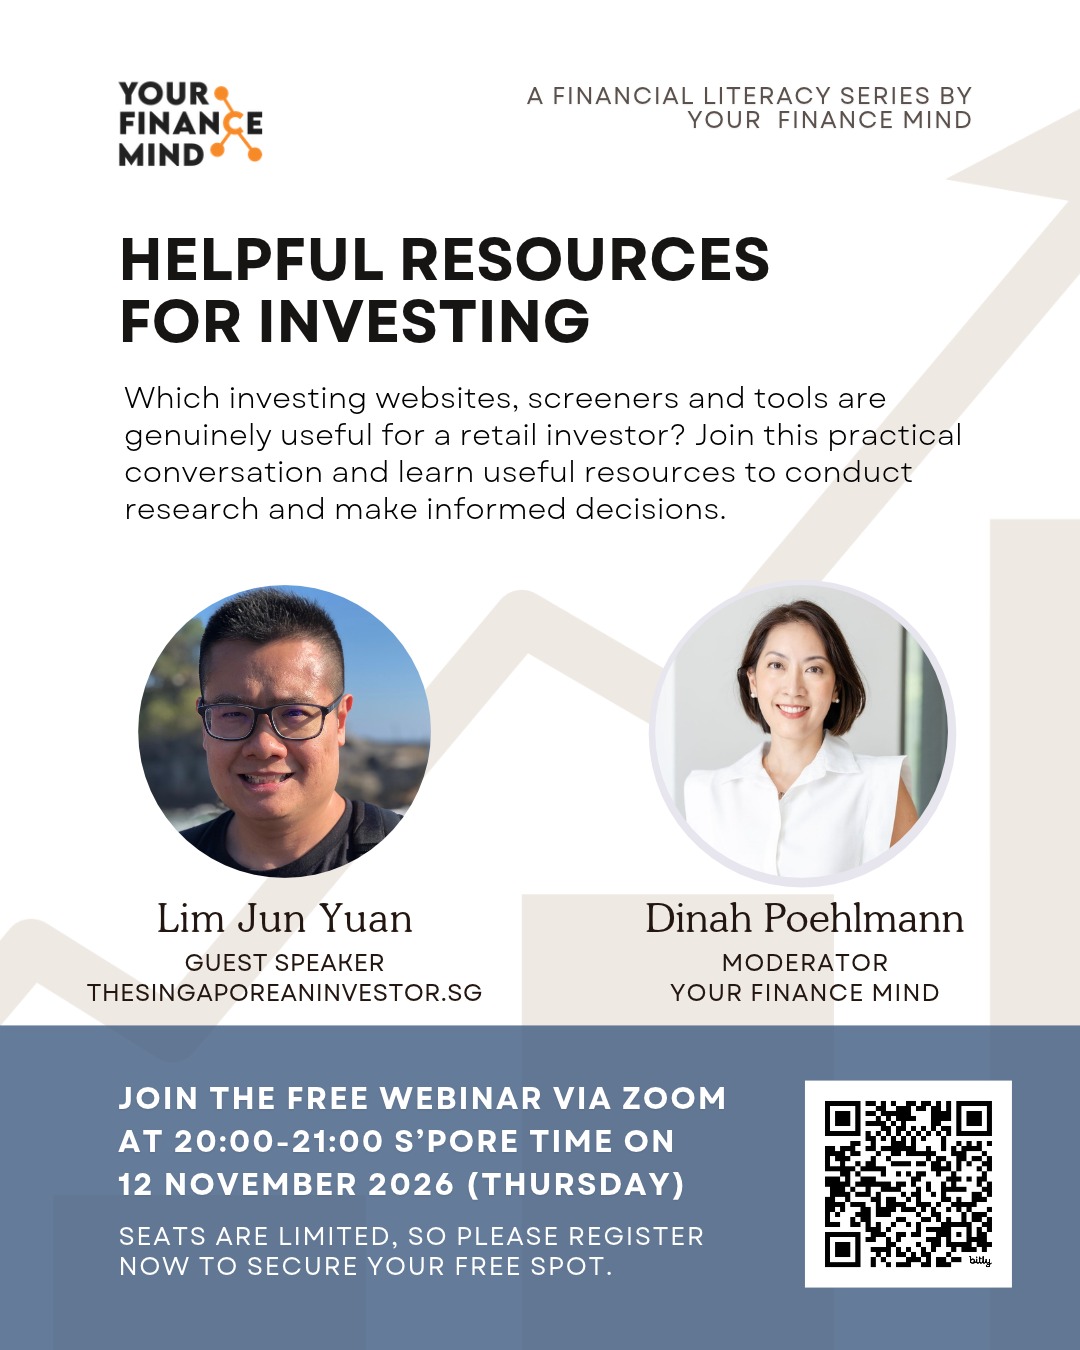
It's been quite some time since I last had a live chit-chat with the investing community, and I’m excited to be back for another session! A big thank you to my friend, Dinah Poehlmann from Your Finance Mind, for inviting me once again!
This time, we’re taking a little break from REITs and exploring some interesting topics surrounding investing, including my go-to investing resources, when is a stock considered 'investable', my thoughts about using AI for stock analysis and trading, and much more.
Whether you're just starting your investing journey or have been investing for years, I hope this session will offer some useful perspectives and practical takeaways that you can apply to your own investing journey.
Best of all, the session is completely FREE to attend! All you need to do is register in advance to receive the Zoom link:
👉 Click here to reserve your spot!
Are You Worried about Not Having Enough Money for Retirement?
You're not alone. According to the OCBC Financial Wellness Index, only 62% of people in their 20s and 56% of people in their 30s are confident that they will have enough money to retire.
But there is still time to take action. One way to ensure that you have a comfortable retirement is to invest in real estate investment trusts (REITs).
In 'Building Your REIT-irement Portfolio' which I've authored, you will learn everything you need to know to build a successful REIT investment portfolio, including a list of 9 things to look at to determine whether a REIT is worthy of your investment, 1 simple method to help you maximise your returns from your REIT investment, 4 signs of 'red flags' to look out for and what you can do as a shareholder, and more!

You can find out more about the book, and grab your copy (ebook or physical book) here...



Comments (0)