What is the first thing that comes to mind when it comes to investing in China?
For most, they will choose to stay out of it at this point in time, due to multiple headwinds that the country is facing – including the ongoing property crisis (where property giants like China Evergrande and Country Garden have fallen from grace and now deeply entrenched in a huge debt crisis), high levels of urban youth unemployment (where the percentage of those between 16 and 24 who are unemployed rose to 21% as at May 2023, up from 15.4% 2 years earlier, as reported by CNBC), local government debt woes (where it was reported in November 2023 by the Reuters [link to the article here] that local government debt reached 92 trillion yuan, or 76% of China’s economic output in 2022, up from 62.2% in 2019), along with risks of deflation.
This is on top of the ongoing trade war between the world’s 2 biggest economic superpowers, United States and China, resulting in an increasing number of companies shifting their manufacturing operations out of China into neighbouring countries (like India, or countries in Southeast Asia) – and this will definitely the country’s economic growth to a certain extent.
On the other hand, we must not forget that China currently holds the position of the world’s second largest economy. Leveraging its substantial domestic population, the country can bolster its economy through robust domestic consumption.
At this point in time, it remains to be seen if the country is able to recover to its pre-Covid growth rate (personal opinion here). However, for those who are interested in getting some exposure into the country, you may consider investing in the iShares China Large-Cap ETF – where you will get an instant diversification into 50 large-cap Chinese companies. Not to worry if this ETF is unfamiliar to you, as in this post, I will be sharing with you researches I have done about it, which I hope will give you a better understanding about the ETF.
Let’s begin:
Overview of the iShares China Large-Cap ETF
Incepted since 5th October 2004, the iShares China Large-Cap ETF (NYSE ARCA:FXI) is one of the China-focused ETFs on the market.
The ETF tracks the performance of the FTSE China 50 Index – which is made up of 50 H shares (the letter ‘H’ refers to Hong Kong, and they refer to Chinese companies listed on the Stock Exchange of Hong Kong; the shares are denominated in Hong Kong Dollars and are open to both local and international investors), red chips (they refer to Chinese companies based in China, but are incorporated offshore, often in places like Hong Kong, making them accessible to international investors; the term ‘red chips’ originates from the colour of China’s national flag, symbolising their connection to the country), and P chips (again, they refer to Chinese companies listed on the Stock Exchange of Hong Kong; the difference between ‘P shares’ and ‘H shares’ is that for ‘P shares’, they have a primary listing outside of China, such as the New York Stock Exchange or NASDAQ) selected based on market capitalisation listed in the Stock Exchange of Hong Kong.
In Which Sectors Do the ETF’s Constituent Companies Operate?
The 50 companies in the ETF are from the following sectors, along with their weightage in percentage terms:
- Consumer Discretionary – 33.14%
- Financials – 28.69%
- Communication – 19.26%
- Energy – 4.93%
- Information Technology – 4.93%
- Healthcare – 3.32%
- Real Estate – 2.23%
- Consumer Staples – 2.00%
- Industrials – 1.61%
- Materials – 1.15%
As you can see from the above, 3 sectors (i.e., consumer discretionary, financials, and communication) have combined weightage of 81.09% on the ETF – what this means is that, any positive or negative impact on companies belonging to the 3 sectors will have a heavy influence on the performance of the index (in terms of its unit price movement).
What are the Top 10 Companies with the Heaviest Weightage on the iShares China Large-Cap ETF?
The top 10 companies are in the following industries – 3 in consumer discretionary (with a combined weightage of 19.94%), 3 in communications (with a combined weightage of 17.19%), 3 in financials (with a combined weightage of 16.03%), and 1 in information technology (with a weightage of 3.46%) – again, no surprises there that the top 10 companies with the heaviest weightage are in the sectors with the heaviest weightage in the ETF (i.e., consumer discretionary, financials, as well as communications).
Also, these top 10 companies have a total weightage of 56.62% – which in my opinion is a heavy one. Hence, any positive and/or negative developments in these companies may impact the performance of the ETF.
Moving on, let us have a look at each of the 10 companies in terms of what they do, along with their financial performances (i.e., its total revenue and net income) recorded in the last 5 financial years:
1. Alibaba Group Holding Limited (SEHK:9988) – Consumer Discretionary, 9.18% Weightage
Established in 1999 by Jack Ma, Alibaba Group Holding Limited currently has the highest weightage in the ETF at 9.18% (at the time of writing this post).
Currently, it is a holding company of 6 major business groups:
(i) Taobao and Tmall Group – It covers the company’s domestic e-commerce marketplaces, such as Taobao and Tmall, Alibaba Health, Freshippo, Sun Art Retail Group Limited, and 1688, among others;
(ii) International Commerce Group – It includes the company’s overseas e-commerce marketplace such as AliExpress, Alibaba, Lazada, Trendy, and Daraz;
(iii) Cloud Intelligence Group – It is the company’s cloud computing unit, which currently have a 34% market share in China; Companies under this business group include Alibaba Cloud and DingTalk;
(iv) Local Consumer Services Group – This business group includes food and delivery services such as Ele.me app, as well as Amap (which is the company’s mapping app);
(v) Cainiao Smart Logistics Network Limited – Formed in 2013, it is currently a major logistics provider in China, serving both Alibaba and 3rd party customers;
(vi) Digital Media and Entertainment Group – Some of the names include Youku (its Youtube-like streaming site), film production unit Alibaba Pictures, Damai, Quark, UC, etc.
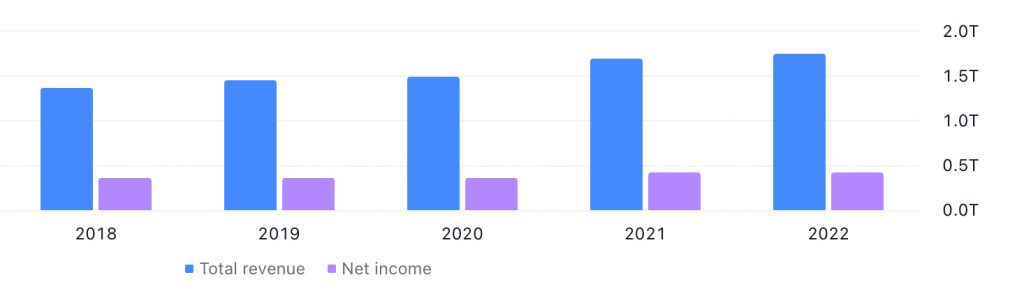
Alibaba Group Holding Limited has a financial year ending every March, and the following is its total revenue and net income recorded over the last 5 years – between FY2018 (ended 31 March 2019) and FY2022 (ended 31 March 2023):
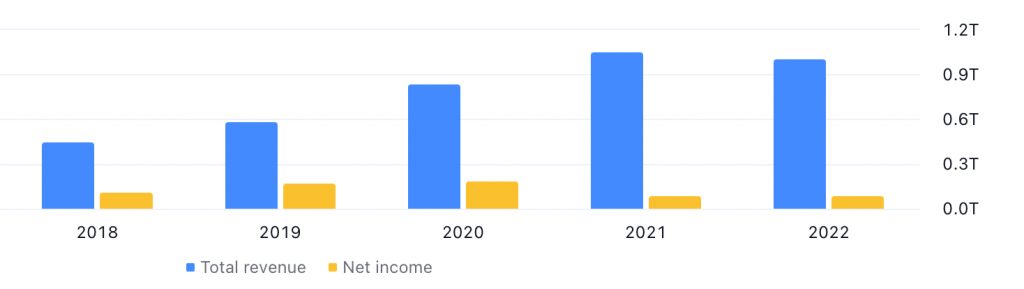
Alibaba Group Holding Limited’s Total Revenue and Net Profit between FY2018 (Ended March 2019) and FY2022 (Ended March 2023) – Image Source: TradingView.com
Both its total revenue and net profit recorded year-on-year (y-o-y) improvements in 4 out of 5 years – for the former, it went up from HKD440.33 billion (in FY2018) to HKD993.19 billion, and recording a compound annual growth rate (CAGR) of 17.7%.
However, for the latter, after climbing to a high of HKD171.87 billion in FY2020, it slumped by 56% to HKD75.16 billion (due to a decline in its income from operations and net gains arising from change in market prices of the company’s equity investments in public-traded companies amongst other factors), before recovering by 10.3% to HKD82.90 billion – however, this was still lower than its net income of HKD102.36 billion recorded in FY2018. Hence the CAGR over a 5-year period is a negative figure.
2. Tencent Holdings Ltd (SEHK:700) – Communication, 8.66% Weightage
Coming in 2nd place in terms of weightage in the iShares China Large-Cap ETF is Tencent Holdings Ltd, at 8.66% at the time of writing.
Founded in 1998 by Pony Ma, the company is a publisher of some of the world’s most popular games (one example being Honor of Kings, 王者荣耀), along with a provider of a range of services such as cloud computing, advertising, FinTech (through WeChat Pay, QQ Wallet, etc.), and other enterprise services (including AI, and big data analytics) to support its clients’ digital transformation and business growth.
Tencent Holdings has a financial year end every December, and the following is its total revenue and net income growth recorded over the last 5 years – between FY2018 and FY2022:
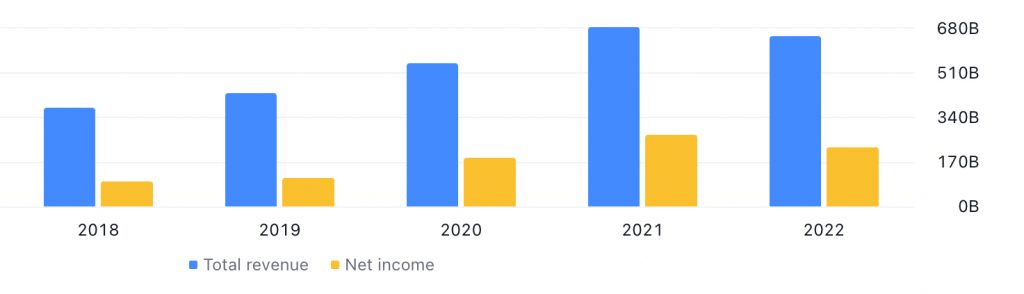
Tencent Holdings Ltd’s Total Revenue and Net Profit between FY2018 (Ended December 2018) and FY2022 (Ended December 2022) – Image Source: TradingView.com
Both its total revenue and net income saw y-o-y growth in the last 4 out of 5 years (the only year which both its total revenue and net income declined was in FY2022) – the former saw a CAGR of 11.7% (where it climbed from HKD370.37 billion in FY2018 to HKD644.88 billion in FY2022), and the latter saw a CAGR of 18.6% (where it grew from HKD93.24 billion in FY2018 to HKD218.90 billion in FY2022).
3. China Construction Bank Corporation (SEHK:939) – Financials, 7.37% Weightage
Established in October 1954, the Beijing-Headquartered bank is a leading large-scale commercial bank in China.
China Construction Bank provides customers (both individuals as well as businesses) with comprehensive financial services, including personal and corporate banking, investment, and wealth management through its network of 14,510 banking outlets. It also has subsidiaries in various sectors, including fund management, financial leasing, trust, insurance, futures, pension, and investment banking, and has nearly 200 overseas entities covering 31 countries and regions.
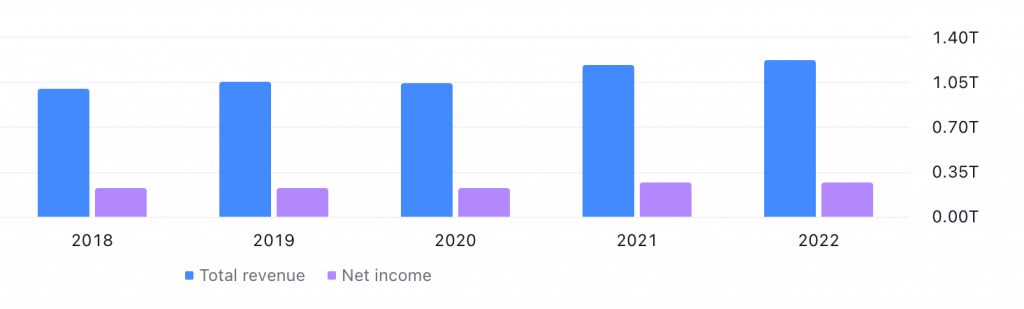
With a financial year end every December, the following is the Chinese bank’s total revenue and net income recorded in the last 5 financial years – between FY2018 and FY2022:
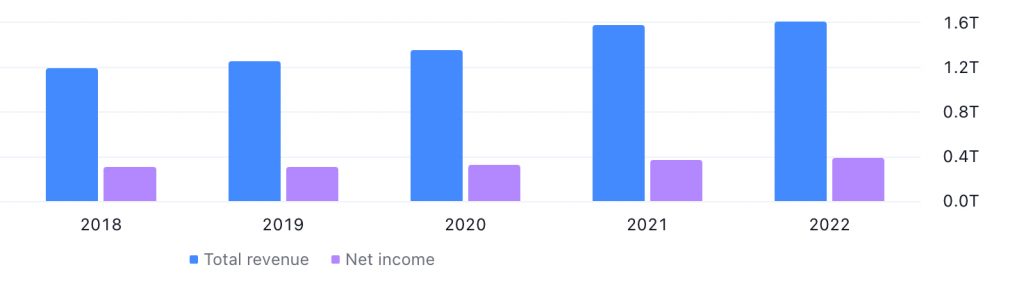
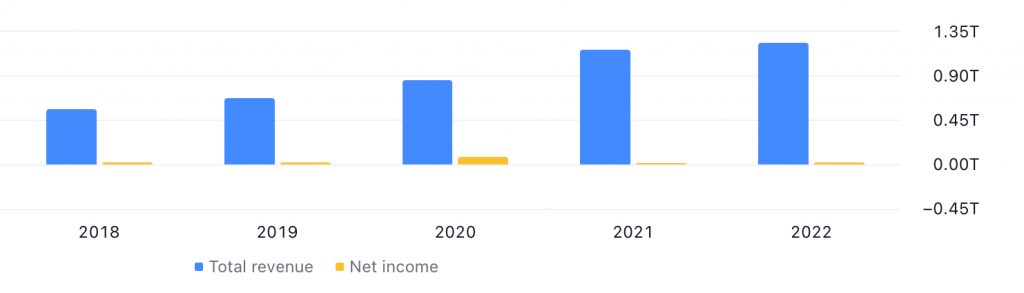
China Construction Bank Corporation’s Total Revenue and Net Profit between FY2018 (Ended December 2018) and FY2022 (Ended December 2022) – Image Source: TradingView.com
The bank’s total revenue has seen a stable upward climb every single year over the last 5 years – from HKD1.18 trillion in FY2018 to HKD1.59 trillion in FY2022, and recording a CAGR of 6.1%.
The same can also be said for its net income growth in the same time period – where it went up from HKD301.63 billion in FY2018 to HKD376.61 billion in FY2022, and recording a CAGR or 4.5%.
4. Meituan (SEHK:3690) – Consumer Discretionary, 6.98% Weightage
Established in March 2010, and listed on the Main Board of the Stock Exchange of Hong Kong in September 2018, Meituan reports its revenues under 2 business segments:
(i) Core Local Commerce – this business segment includes food delivery and Meituan Instashopping (where they help consumers place orders of food and grocery prepaid by merchants), in-store, hotel and travel-related businesses (where they help consumers purchase local consumer services provided by merchants in numerous in-store categories or make reservations for hotels, attraction ticketing, and transportation ticketing);
(ii) New Initiatives – which comprises (a) sales of goods primarily from business-to-business food distribution and Meituan Grocery; and (b) various services rendered by various businesses such as Meituan Select, ride sharing, bike sharing, e-moped sharing, power banks, and micro credit.
The following table is Meituan’s financial results for the 4 full years since its IPO – between FY2019 and FY2022; it has a financial year end every December:
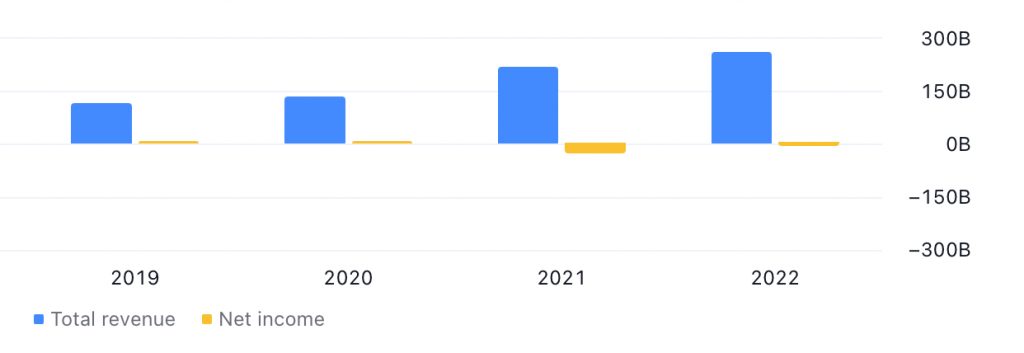
Meituan’s Total Revenue and Net Profit between FY2019 (Ended December 2019) and FY2022 (Ended December 2022) – Image Source: TradingView.com
While its total revenue have seen a good steady upward growth (from HKD110.59 billion in FY2019 to HKD255.78 billion in FY2022), and recording a CAGR of a pretty impressive 23.3%. However, its net income sank into a net loss position in the 2 recent years (between FY2021 and FY2022 – even though its net loss position have improved from -HKD28.37 billion in FY2021 to just -HKD7.78 billion in FY2022 – it will be interesting to see if the company manages to further improve and reverse into a net profit position once again in FY2023).
5. Industrial and Commercial Bank of China (SEHK:1398) – Financials, 4.66% Weightage
Industrial and Commercial Bank of China (or ICBC for short) was established in January 1984, and listed on both the Shanghai Stock Exchange and the Stock Exchange of Hong Kong in October 2006.
ICBC reports its total revenue under 3 different segments:
(i) Corporate Banking – which provides financial products and services (including corporate loans, trade financing, deposit-taking activities, corporate wealth management services, custody activities, and various types of corporate intermediary services) to corporations, government agencies, and financial institutions;
(ii) Personal Banking – which provides personal loans, deposit-taking activities, card business, personal wealth management services and various types of personal intermediary service to individual customers;
(iii) Treasury Operations – which includes money market transactions, investment securities, foreign exchange transactions, and the holding of derivative positions for its own accounts or on behalf of its customers.
The China-headquartered bank was ranked in the 1st place among the Top 1000 World Banks by The Banker, in the 1st place in the list of commercial banks of the Global 500 in Fortune for the 10th consecutive year in 2022, as well as in the 1st place among the Top 500 Banking Brands of Brand Finance for the 7th consecutive year in 2022.
The following is Industrial and Commercial Bank of China’s total revenue and net income recorded over the last 5 years – between FY2018 and FY2022; the bank has a financial year end every December:
Industrial and Commercial Bank of China’s Total Revenue and Net Profit between FY2018 (Ended December 2018) and FY2022 (Ended December 2022) – Image Source: TradingView.com
In terms of its total revenue over the last 5-years, it has seen a gradual improvement every single year – from HKD1.36 trillion in FY2018 to HKD1.73 trillion in FY2022, and a CAGR of 4.9%.
For its net income, apart from a slight 0.15% dip in FY2022 (compared to the previous year), the remaining years saw the Chinese bank recording improvements. Over 5-year period, its net income grew at a CAGR of 3.5%.
6. NetEase Inc (SEHK:9999) – Communication, 4.39% Weightage
Also dual listed on the NASDAQ (under the ticker symbol NASDAQ:NTES), NetEase Inc is a leading internet and game services provider – where the company is the developer and operator of the most popular running mobile and PC gamed available in China and globally.
Apart from games, the Chinese company also owns the following:
(i) Youdao – listed in the New York Stock Exchange [or NYSE for short] under the ticker symbol NYSE:DAO, it is an intelligent learning company in China dedicated to developing and using technologies to provide learning content, applications, and solutions to users of all ages (some of them include adult and vocational courses)
(ii) NetEase Cloud Music – listed in the Stock Exchange of Hong Kong under the ticker symbol HKEX:9899, it is one of the leading online music platforms, featuring an interactive content community for music enthusiasts in terms of user scale and engagement,
NetEase also offers a wide range of other innovative services, including Yanxuan (the company’s private label consumer lifestyle brand), www.163.com portal and related mobile app (i.e., Wangyi Xinwen) which delivers quality information to its users, NetEast Pay (an online payment platform), and NetEase Mail (China’s leading email service provider since 1997).
NetEase Inc has a financial year end every December, and the following is its total revenue and net income over the last 5 years – between FY2018 and FY2022:
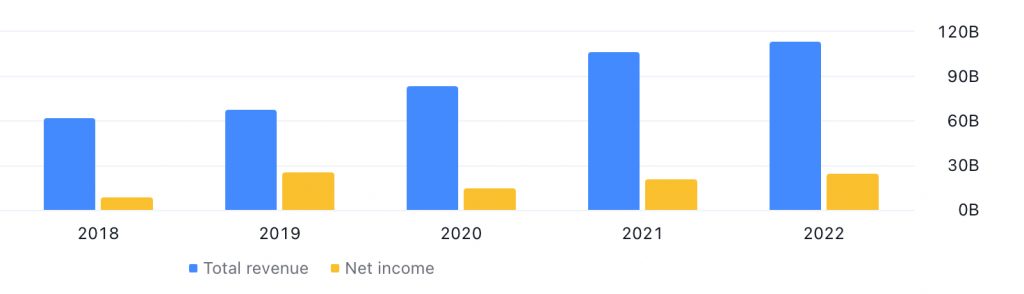
NetEase Inc’s Total Revenue and Net Profit between FY2018 (Ended December 2018) and FY2022 (Ended December 2022) – Image Source: TradingView.com
Total revenue saw a steady growth over the years – rising from HKD60.62 billion in FY2018 to a high of HKD112.21 billion in FY2022 (this amount is the highest in 5 years). Over a 5-year period, its total revenue grew at a CAGR of 13.1%.
Despite its net income recording a y-o-y decline in 1 out of 4 years (by 43.7% in FY2020), but the remaining years, it grew at a steady pace – up from HKD7.29 billion in FY2018 to a high of HKD22.92 billion in FY2022 – a CAGR of a pretty impressive 25.7%.
7. Baidu Inc (SEHK:9888) – Communication, 4.14% Weightage
Founded in 2000, and headquartered in Beijing’s Haidian District, Baidu Inc is currently one of the largest AI and internet companies in the world.
The company’s flagship product, the Baidu App, is the #1 search-plus-feed app in China, where it has reached 544 million monthly active users in December 2020.
It reports its businesses under 2 segments:
(i) Baidu Core – which provides mainly online marketing services and non-marketing value added services, as well as products and services from new AI initiatives; the business segment accounted over 70% of the company’s revenue in the last 3 years;
(ii) iQIYI – previously known as Qiyi, it is a Chinese subscription video-on-demand over-the-top streaming service; the business segment accounted for the company’s remaining revenue.
With a financial year end every December, the following is Baidu Inc’s total revenue and net income recorded over the last 5 years – between FY2018 and FY2022:
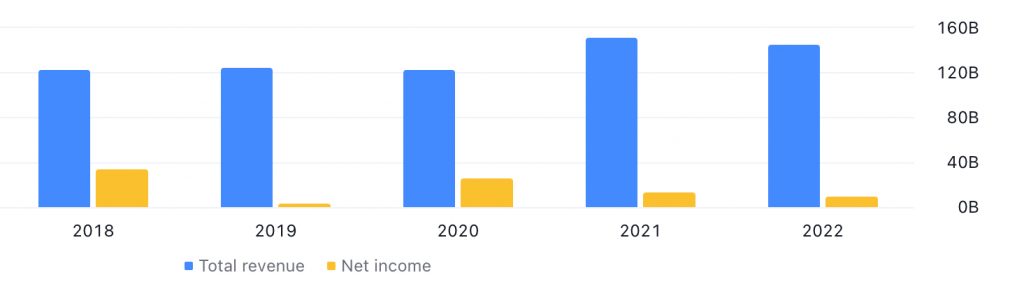
Baidu Inc’s Total Revenue and Net Profit between FY2018 (Ended December 2018) and FY2022 (Ended December 2022) – Image Source: TradingView.com
Looking at its total revenue, it saw slight declines in FY2020 (by 1.2%) and FY2022 (by 4.2%). Despite of that, its total revenue still managed to record a CAGR of 3.5%.
However, its net income growth over the same time period has been pretty inconsistent. In fact, over the 5-year period I have looked at, it has fallen from a high of HKD32.50 billion (in FY2018) to just HKD8.10 billion (in FY2022).
8. Bank of China Ltd (SEHK:3988) – Financials, 4.00% Weightage
Bank of China is the 2nd oldest bank that is still in operation in the country, where it was founded in 1912.
It currently has institutions across China, as well as in 62 countries and regions (some of them include Hong Kong, Macao, Taiwan, as well as New York, London, Singapore, and Tokyo), and they provide financial services through 6 main business segments:
(i) Corporate Banking – where it provides current accounts, overdrafts, loans, payments and settlements, trade-related product and other credit facilities, foreign currency, derivative products and wealth management products to corporate customers, government authorities, and financial institutions;
(ii) Personal Banking – where it provides savings deposits, personal loans, credit and debit cards, payments and settlements, wealth management products, and funds and insurance agency services to its retail customers;
(iii) Treasury Operations – consisting of foreign exchange transactions, customer-based interest rate and foreign exchange derivative transactions, money market transactions, proprietary trading, along with asset and liability management;
(iv) Investment Banking – consisting of debt and equity underwriting and financial advisory, sales and trading of securities, stock brokerage, investment research and asset management services, as well as private equity investment services;
(v) Insurance – underwriting of general and life insurance business and insurance agency services;
(vi) Other Operations – Including investment holding business and other miscellaneous activities.
Bank of China has a financial year end every December, and the following is its total revenue and net income growth recorded over the last 5 years – between FY2018 and FY2022:
Bank of China Ltd’s Total Revenue and Net Profit between FY2018 (Ended December 2018) and FY2022 (Ended December 2022) – Image Source: TradingView.com
Apart from in FY2020 (where its total revenue saw a 1.9% dip), the remaining 4 years saw its total revenue recording a y-o-y improvement where, over the entire 5-year period, it saw a CAGR of 4.3%.
Looking at its net income, it saw a stable growth throughout the entire 5-year period – where it went up from HKD213.30 billion in FY2018 to HKD264.48 billion in FY2022 (which happens to be the highest in 5 years), and recording a CAGR of 4.4% – in-line with the CAGR of its total revenue.
9. JD.com Inc (SEHK:9618) – Consumer Discretionary, 3.78% Weightage
JD.com Inc is China’s leading one-stop e-commerce platform, providing over 580 million active customers with direct access to an unrivalled range of authentic, high-quality products across every major category (including electronics, apparel, home furnishings, fast-moving consumer goods, fresh food, home appliances, and others) and delivering them at amazingly fast speeds (same- and next-day delivery) to provide a truly ‘one stop’ shopping experience to Chinese consumers (through its unrivalled nationwide JD Logistics, which leverages on the company’s advanced technology and logistics expertise to provide smart logistics chain and logistics series to businesses across a wide range of industries.)
On top of that, the company is involved in helping local and international brands tap into China’s fast-growing e-commerce market.
The company has a financial year end every December, and the following is its total revenue and net income over the last 5 years – between FY2018 and FY2022:
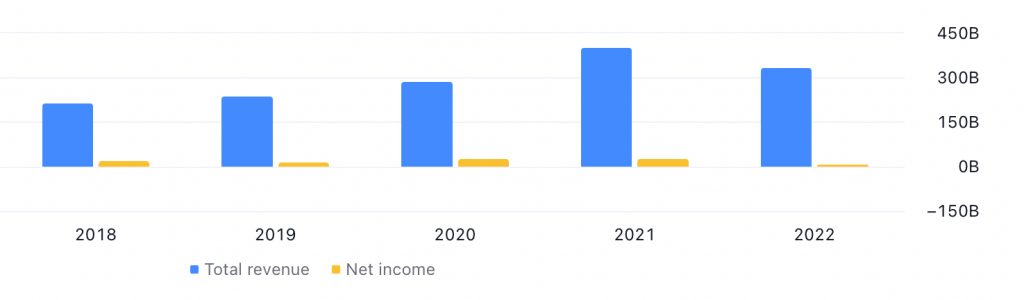
JD.com Inc’s Total Revenue and Net Profit between FY2018 (Ended December 2018) and FY2022 (Ended December 2022) – Image Source: TradingView.com
JD.com Inc’s total revenue saw a steady upward climb every single year over the last 5 years, where it went up from HKD547.24 billion in FY2018 to HKD1.22 trillion in FY2022 – in fact, its total revenue recorded in FY2022 is the highest in 5 years. In terms of its CAGR, it was at a pretty impressive 17.4%.
However, its net income growth have been inconsistent in the same time period – where it was in a net loss position in 2 out of 5 years (in FY2018, as well as in FY2021). That is something to take note of.
10. Xiaomi Corporation (SEHK:1810) – Information Technology, 3.46% Weightage
Xiaomi Corporation was founded in April 2010, and listed on the Main Board of the Stock Exchange of Hong Kong in July 2018.
The company is one of the world’s leading smartphone companies, where in June 2023, the monthly active users of its MIUI (now known as HyperOS) mobile operating system reached approximately 606 million globally. On top of that, it has also established its position as the world’s leading consumer AIOT (AI+IoT – Artificial Intelligence + Internet of Things) platform, with 645.5 million smart devices connected to its platform (excluding smartphones, laptops, and tablets) as at 30 June 2023.
In August 2023, it was announced that Xiaomi Corporation was included in the Fortune Global 500 list for the 5th year in a row – now ranking at 360th position.
With a financial year ending every December, the following is Xiaomi Corporation’s total revenue and net income recorded over the last 5 years – between FY2018 and FY2022:
Xiaomi Corporation’s Total Revenue and Net Profit between FY2018 (Ended December 2018) and FY2022 (Ended December 2022) – Image Source: TradingView.com
The company’s total revenue saw y-o-y improvements in 4 out of 5 years (between FY2018 and FY2021), before recording a 17.7% decline in FY2022. Over a 5-year period, its total revenue still managed to record a CAGR of 9.5%.
Looking at its net income, it has suffered declines in 2 out of 5 years – most notably in FY2022, where it dived by 88% compared to the previous year to just HKD2.88 billion (which is the lowest in 5 years) – where I understood that it was due to a slowdown in consumption, and disruptions due to China’s Covid-19 curbs. With all the curbs being lifted in 2023, I will be interested to see if Xiaomi’s net income recovers.
What are the Fees of the iShares China Large-Cap ETF?
The only fee is the management fee of the ETF, which is at 0.74% – which is higher than the average (at around 0.50-0.60%).
As an Investor of the ETF, Will I Receive Any Dividends?
As an investor of the ETF, you will receive dividend payouts on a half-yearly basis – once in June, and once in December. However, if you are a Singaporean investor, do take note that all dividend payouts are subjected to a 30% withholding tax – meaning the amount you receive will be 30% less than the amount declared.
With that, let us have a look at the dividend payouts of the ETF over the last 5 years – between 2019 and 2023:
| 2019 | 2020 | 2021 | 2022 | 2023 | |
| Dividend Per Share (US$) | $1.20 | $1.02 | $0.59 | $0.74 | $0.76 |
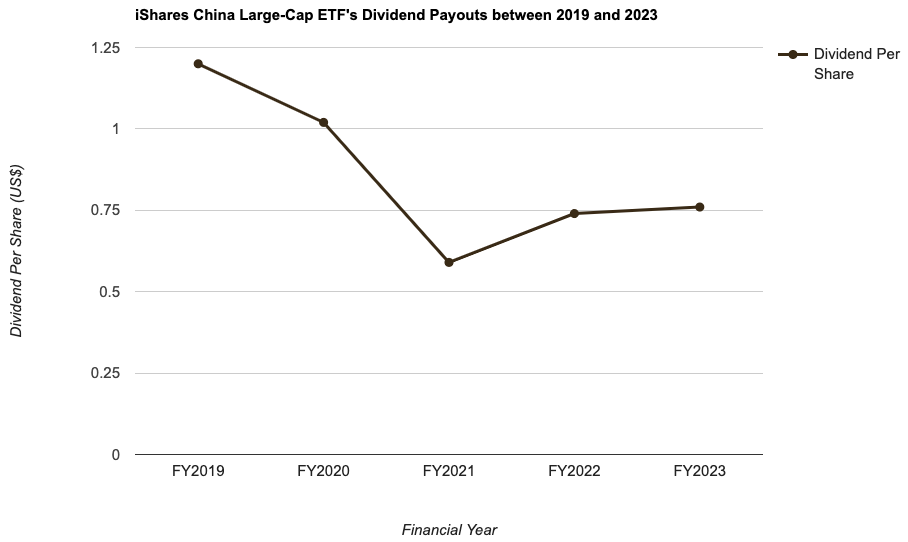
As you can see from the above, the dividend payouts for the ETF over the last 5 years has been irregular.
How has the Unit Price of the iShares China Large-Cap ETF Moved over the Years?
The following is the unit price movement of iShares China Large-Cap ETF on a weekly timeframe since March 2020:
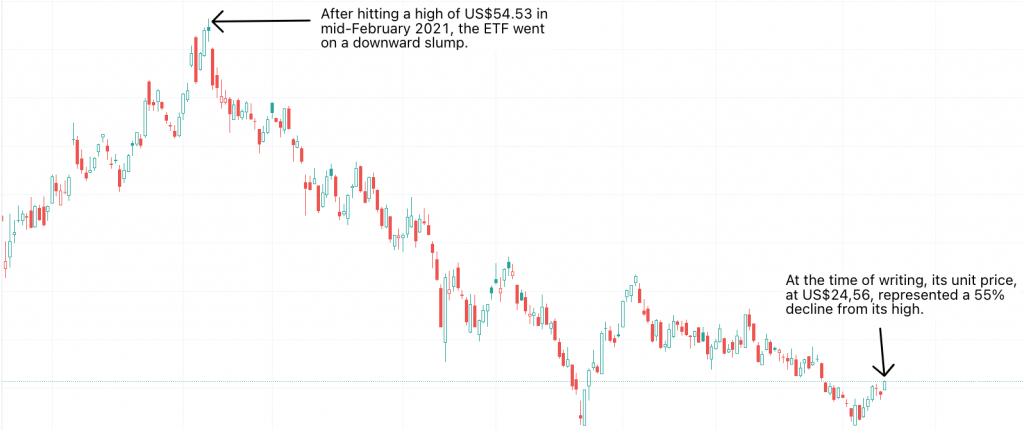
After hitting a high of US$54.53 in mid-February 2021, it started a steep downward descend till today (as a result of the prolonged Covid lockdown by the Chinese government, crackdown on the technology companies, as well as on the private education industry, along with its pursue of the ‘common prosperity’ policy). Looking at the chart movements, it is very obvious that the overall trend for the ETF is deeply entrenched in a downtrend.
At this point of writing, its unit price, at US$24.56 (as at market close on 12 March 2024), represented a 55% decline from its high.
How Can You Invest in the ETF?
You can invest in the ETF just like how you invest in any equities listed in the US exchange. In terms of the minimum quantity, it is just 1 – hence, at its current traded price of US$24.56 at the time of writing, the minimum amount you need to invest is approximately S$35, plus brokerage fees (which will vary depending on the brokerage platform you use).
Closing Thoughts
Of course, given the current headwinds faced by China at the moment (not forgetting to also mention the fact that many institutional investors have also stayed away from investing in the country at this point in time), its completely understandable that you want to keep an ‘arms length’ from the ETF at this point in time.
However, if you hold a contrarian view, and bullish of China’s eventual recovery, then the ETF is one you can consider investing in – for it gives you an instant exposure to 50 of the large-cap Chinese companies listed in the Stock Exchange of Hong Kong.
A quick recap on some of the things to take note of before you make any investment decisions – When it comes to the top 10 companies with the heaviest weightage – they are comprised of companies belonging to just 3 sectors – consumer discretionary, financials, and communications (these 3 sectors also have the heaviest weightage in the ETF), with their combined weightage at 56.62%.
In terms of the companies’ financial performance, while some managed to record a consistent growth in its total revenue and net income (these companies are Tencent, China Construction Bank, Industrial and Commercial Bank of China, NetEase, and Bank of China), some have recorded irregular net income growth over the years (these companies include Alibaba, Meituan, Baidu, JD.com, as well as Xiaomi) – if you look at it, about half of the companies out of the top 10 companies with the heaviest weightage have irregular net income growth. This is something you need to be mindful of when investing in the ETF.
Looking at its dividend payouts to unitholders over the past 5 years, it has also been inconsistent – hence, if you are an income investor, its something you want to take note of (but for me, I’m not too bothered by it, because when I invest in the ETF, dividends is not my focus [due to the 30% withholding tax as a Singaporean, making any investment in US-listed ETFs for dividends not worthwhile]. Rather, my focus is on the potential capital gains I can get from making the investment decision.)
Last but not least, looking at its unit price movements, after hitting a high of US$54.53 in the middle of February 2021, it suffered a steady downward decline and at this point in time, its unit price is already down by 55% from its high.
As to whether or not the unit price will recover (as well as when), it will very much depend on a few factors – the results posted by the top 10 companies with the heaviest weightage in the ETF, recovery in the country’s economy, and along with the return of the institutional investors.
With that, I have come to the end of my sharing about the iShares China Large-Cap ETF (NYSE ARCA:FXI). I hope the information presented in this post have given you a much better understanding about the ETF. As always, do take note that everything you have just read above, particularly my opinions about it, are purely for educational purposes only, and they do not constitute any buy or sell calls for the ETF. You are strongly encouraged to do your own due diligence before you make any investment decisions.
Disclaimer: At the time of writing, I am not invested in the iShares China Large-Cap ETF.
Stop Spending Hours Reading REIT Reports Every Quarter!
What if you could assess a REIT's portfolio occupancy, debt profile, valuation, and overall health in less than 30 seconds - without having to comb through a single quarterly report?
That's the problem the REIT Screener was built to solve.
Developed through a collaboration between ShareInvestor and The Singaporean Investor, the REIT Screener consolidates many of the key metrics and indicators I personally use when analysing REITs into one easy-to-use platform. Instead of spending hours extracting data manually every earnings season, you can now monitor the REITs you own and research new opportunities in just a few clicks.
If you're serious about REIT investing but don't have the time to manually track quarterly developments, the REIT Screener could be the shortcut you've been looking for:

Take a closer look at the REIT Screener here...


Comments (0)