For those you who have young kids, I’m pretty sure the brand ‘VTech’ should be familiar to you – as more often than not, you should have some of the company’s toys lying somewhere around your home. You may also have toys from the brand ‘LeapFrog’ – which are also by the Hong Kong-listed VTech Holdings Limited (SEHK:303). The company is the global leader in electronic learning products from infancy through toddler and pre-school.
Apart from that, VTech Holdings Limited is also the largest manufacturer of residential phones (sold under its namesake brand, as well as under the ‘AT&T’ brand; you can find the former readily available in most electronic stores in Singapore), along with commercial phones (conference phone with wireless mics), and other telecommunication products (such as audio and video baby monitors.)
The company’s headquarters is located in Hong Kong, with manufacturing facilities in China, Malaysia, and Mexico, as well as R&D centres in Hong Kong, China, Germany, the United States, Canada, and Taiwan. Last but not least, it has a financial year end in 31 March.
Now that you have a better understanding of the company’s businesses, in the rest of this article, you will read about an analysis of its financial performance, debt profile, and dividend payout that the company have recorded over the last 5 financial years (between FY2016/17 and FY2020/21):
Financial Performance
Whenever I study a company’s financial performance, my focus is always on its total revenue and net profit, gross and net profit margins, as well as Return on Equity (or RoE, which is a measure the amount of profit the company is able to generate for every dollar of shareholders’ money it uses in its businesses.)
Let us have a look at them in this section:
Total Revenue & Net Profit (USD’mil):
| FY 2016/17 | FY 2017/18 | FY 2018/19 | FY 2019/20 | FY 2020/21 | |
| Total Revenue (US$’mil) | $2,079m | $2,130m | $2,162m | $2,166m | $2,372m |
| Net Profit (US$’mil) | $179m | $206m | $171m | $191m | $231m |
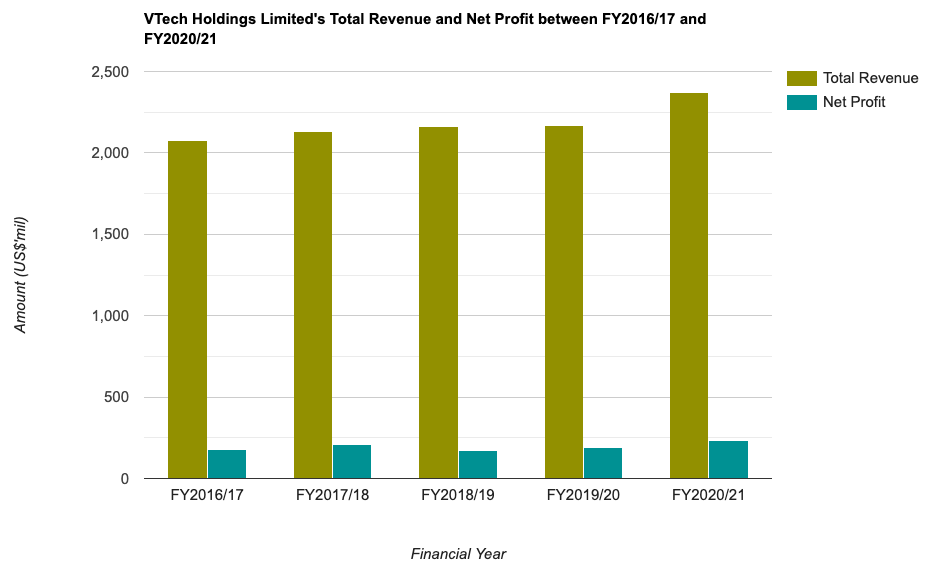
The company’s total revenue have increased every single year over the last 5 financial years I have looked at – where it recorded a compound annual growth rate (CAGR) of 2.7%.
In terms of its net profit, except for in FY2018/19 (due to a lower revenue contribution from its telecommunication products, along with higher costs), all the other 4 years saw this financial statistic recording improvements on a year-on-year (y-o-y) basis. Over a 5-year period, its net profit saw a CAGR of 5.2%.
Gross and Net Profit Margin (%):
The following is the company’s gross and net profit margins over the last 5 financial year I have calculated:
| FY 2016/17 | FY 2017/18 | FY 2018/19 | FY 2019/20 | FY 2020/21 | |
| Gross Profit Margin (%) | 33.2% | 33.0% | 29.4% | 30.6% | 30.6% |
| Net Profit Margin (%) | 8.6% | 9.7% | 7.9% | 8.8% | 9.7% |
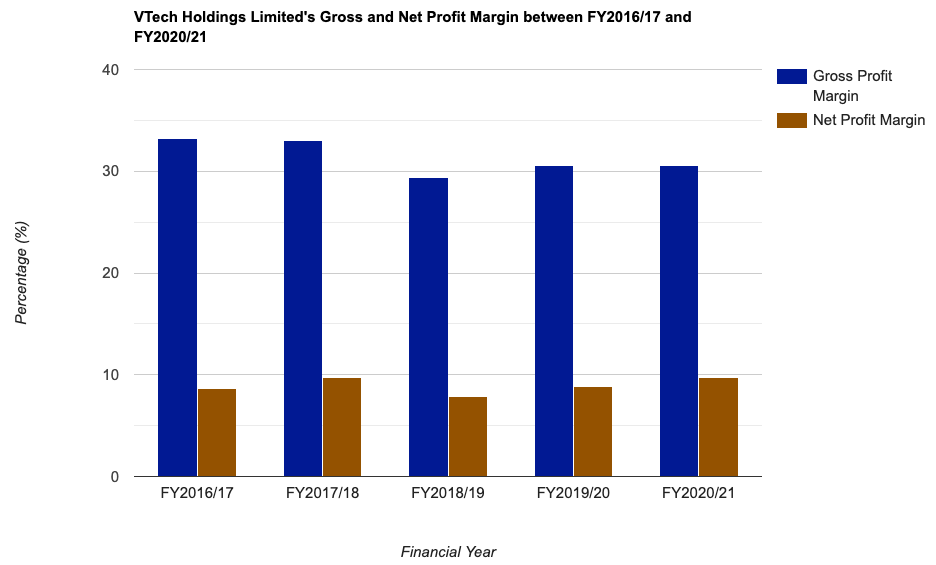
Its gross profit margin have declined between FY2016/17 and FY2018/19 before stabilising in the subsequent years, while the growth of its net profit margin over the same time period have trended upwards since bottoming at 7.9% in FY2018/19.
Return on Equity (%):
When it comes to studying a company’s RoE, ideally, my preference is towards those that are able to consistently maintain this statistic at above 15.0% over the years. With that, let us take a look at VTech Holdings’ RoE which I’ve computed:
| FY 2016/17 | FY 2017/18 | FY 2018/19 | FY 2019/20 | FY 2020/21 | |
| Return on Equity (%) | 30.6% | 31.9% | 28.2% | 31.7% | 31.6% |
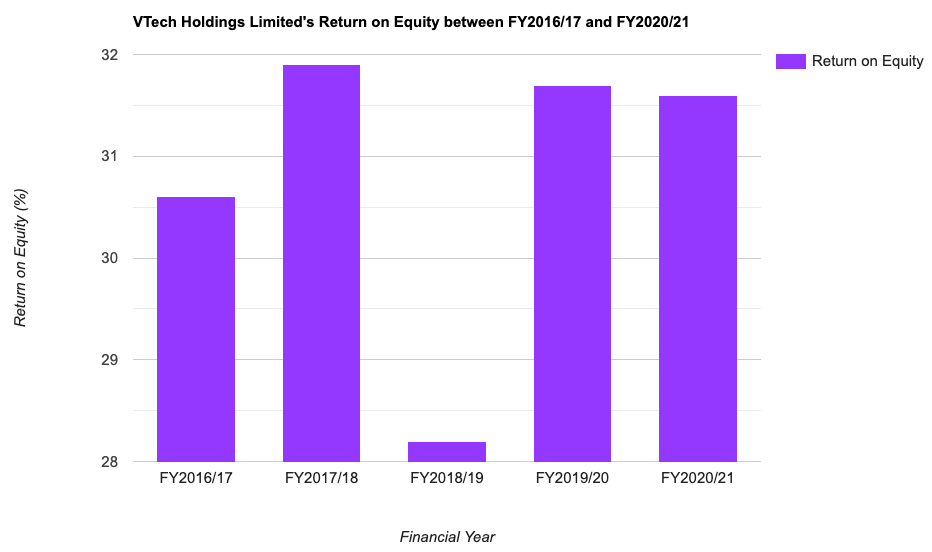
Apart from in FY2018/19 (due to a y-o-y decline in its net profit), the remaining years saw the company’s RoE being maintained at around 31.0%, which satisfies my criteria for company selection.
Debt Profile
Next, let us study VTech Holdings’ debt profile – where my preference is towards those that have minimal or no debt, as well as one that is in a net cash position. Let us take a look at the company’s debt profile over the last 5 financial years in the table below:
| FY 2016/17 | FY 2017/18 | FY 2018/19 | FY 2019/20 | FY 2020/21 | |
| Cash & Cash Equivalents (US$’mil) | $269m | $254m | $237m | $243m | $344m |
| Total Borrowings (US$’mil) | $2m | – | – | – | – |
| Net Cash/ Debt (US$’mil) | +$267m | +$254m | +$237m | +$243m | +$344m |
Its good to note that the company have minimal debt (apart from a borrowing of just $2m in FY2016/17, it is debt-free in the rest of the financial years I have looked at.) Another thing I like is that, its net cash position have also improved since FY2018/19, after declining slightly in the 2 financial years prior.
Dividend Per Share
The management of VTech Holdings pays out a dividend on a half-yearly basis – once when it announce its interim results, and once when it announce its final results. Let us take a look at the company’s dividend per share, along with its dividend payout ratio over the last 5 financial years in the table below:
| FY 2016/17 | FY 2017/18 | FY 2018/19 | FY 2019/20 | FY 2020/21 | |
| Dividend Per Share (HKD/share) | HKD 5.46 | HKD 6.27 | HKD 5.24 | HKD 4.12 | HKD 7.07 |
| Dividend Payout Ratio (%) | 98.5% | 97.4% | 97.8% | 70.2% | 99.2% |

As far as its dividend payouts are concerned, it saw declines in 2 out of the 5 financial years I have looked at – the decline in FY2018/19 was due to a decline in its net profits, while the drop in FY2019/20 was due to the company retaining some of its earnings for prudence (as a result of the Covid-19 pandemic.)
In terms of its payout ratio over the last 5 years, the company have been paying out almost all of its earnings as dividends to its shareholders (apart from in FY2019/20, where the company retained part of its earnings due for prudence due to the ongoing Covid-19 pandemic.)
As such, moving forward, if the company is able to further improve its net profit in the years ahead, you can expect an increase in terms of its dividend payout to shareholders.
Closing Thoughts
Reasons why VTech Holdings Limited caught my eye include a steadily growing top- and bottom-line, a very conservative debt profile (where it has no borrowings and in an improving net cash position), as well as one that pays out a dividend on a regular basis (once every half-yearly.)
In terms of whether the company is considered ‘cheap’ or ‘expensive’ at the time of writing, its current valuations based on its current trading price (of HKD75.50 at the time of writing), compared against its 5-year average is as follows:
| Current Valuation | 5-Year Average Valuation | |
| P/E Ratio | 10.8 | 13.3 |
| P/B Ratio | 3.4 | 4.1 |
| Dividend Yield | 9.2% ** | 7.2% |
Looking at its current vs. its 5-year average valuations, it seems that the current share price of VTech Holdings Limited is considered ‘cheap’, as its current P/E and P/B ratios are lower than its average, along with its current dividend yield higher than its average.
Having said that, this post is by no means a recommendation to pick up the company’s shares. You should always do your own due diligence before you make any investing decisions.
Disclaimer: At the time of writing, I am not a shareholder of VTech Holdings Limited.
REITs vs Banks: Which Investment Delivers More for Income Seekers?
If you thought 2025 was a wild ride for the stock market, wait until you see 2026! With not only the uncertainty of interest rate changes and geopolitical tensions but also a military operation by Israel and the United States against Iran, it's set to be even more turbulent.
So, with all this in mind, which is the better choice for income investors: REITs or banks?
I'm honoured to be re-invited by Dinah Poehlmann from Your Finance Mind for a fireside chat on Zoom this year, where I'll be sharing my insights on this topic.
Join me on Thursday, 19 March 2026, from 8pm to 9pm, as I offer my thoughts and answer any questions you may have.
Best part? Registration is completely free! Secure your spot now through the link below:
👉 Sign Up Now and Mark Your Calendars
Are You Worried about Not Having Enough Money for Retirement?
You're not alone. According to the OCBC Financial Wellness Index, only 62% of people in their 20s and 56% of people in their 30s are confident that they will have enough money to retire.
But there is still time to take action. One way to ensure that you have a comfortable retirement is to invest in real estate investment trusts (REITs).
In 'Building Your REIT-irement Portfolio' which I've authored, you will learn everything you need to know to build a successful REIT investment portfolio, including a list of 9 things to look at to determine whether a REIT is worthy of your investment, 1 simple method to help you maximise your returns from your REIT investment, 4 signs of 'red flags' to look out for and what you can do as a shareholder, and more!

You can find out more about the book, and grab your copy (ebook or physical book) here...


Comments (0)