A slew of measures rolled out by the Chinese government of late targeting on companies in the technology sector have seen the share price of Alibaba Group Holdings Limited (NYSE:BABA) tumbling from a high of US$198.45 on 10 August 2021 (marked under the label “1” in the chart below) all the way down to a low of US$155.50 last Friday, 20 August 2021 (marked under the label “2”) – notice the candlesicks between the labels “1” and “2”, where the price have closed lower for 8 consecutive trading days in a row (for those who have shareholdings in the company, I totally understand that it must not have felt good for you.)
However, there seem to be some ray of light at the end of the tunnel when the share price rebounded yesterday, 23 August 2021, where it was up by US$3.10, or 1.96%, to close at US$161.06 (marked under the label “3”)
Having said that, is the share price of the tech giant poised for a near-term rebound? Or is yesterday’s green hammer candlestick a one-off? Here’s my technical analysis on how the share price of Alibaba may possibly move in the near-term – both in the bullish, as well as in the bearish scenario. Before I begin, the following are some of the technical indicators I’ve used in my analysis:
- Moving averages on a weekly timeframe – 20-day (in dark green), 50-day (in light green), 100-day (in orange), 150-day (in yellow), and 200-day (in red)
- Fibonacci retracement based on its recent share price movements I’ve identified on a weekly timeframe
- Moving Average Convergence Divergence (MACD) on a daily timeframe
- Stochastic on a daily timeframe
Here’s a screenshot of the recent share price movements of Alibaba Group Holdings Limited on the US stock exchange:
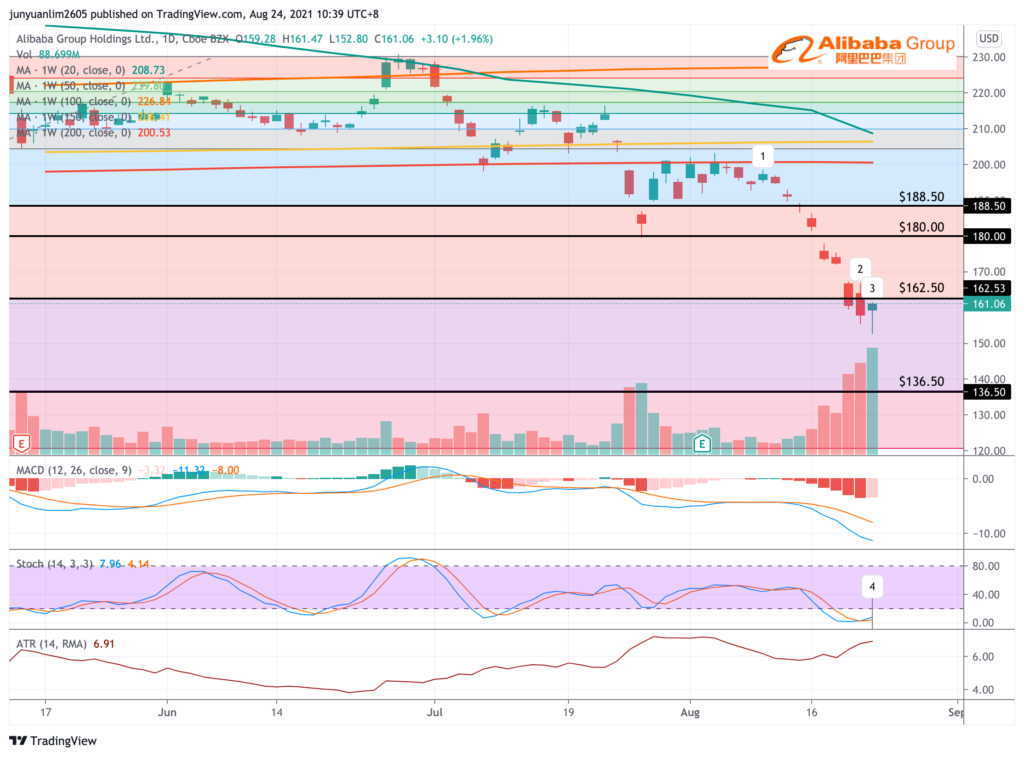
On one look, you can tell that the share price movements of late is certainly very bearish. However, there appears to be some evidences suggesting that we might see a price rebound in the near-term, particularly:
- The candlestick yesterday (marked under the label “3”) is a green bullish hammer on a high volume
- Stochastic have turned into an uptrend in an oversold position (marked under the label “4”)
That said, one thing to take note is that, there’s a resistance line at around US$162.50 which the candlestick must cross above. If it is able to do so on a high volume, then the share price, in the near-term, could rebound up further to around the next resistance lines at around US$180.00 and US$188.50.
On the other hand, if the share price is unable to break above the US$162.50 resistance line, and continue to trend down further from there, then we may possibly see the share price of the tech company heading towards the next support line, which can be found at around US$136.50.
In case you’re wondering, between the 2 scenarios, which scenario do I think is more likely to happen, I would say its more of the former – as the share price have since fell by US$42.95 (or by 21.6%) from a high labelled “1” to a low labelled “2” in a span of 8 trading days, and bargain-hunters may decide that its an opportune time come in to prop the share price up. Also, if I were to take a look at its Hong Kong listing (HKEX:9988) today, as at the time of writing (11.00am on 24 August 2021), the share price have also rebounded by HKD6.70 (or up by 4.4%) for the day, and is currently trading at HKD158.80 – in my opinion, if it is able to close on a green candlestick on a high volume on the Hong Kong Stock Exchange later today, then it’s very likely that the share price of the company on the US stock exchange may see a further rebound up when the market opens later in the evening (Singapore time.)
With that, I have come to the end of my technical analysis share on Alibaba Group Holdings Limited’s possible share price movements in the near-term – both in a bullish, as well as in a bearish scenario. Do take note that the above is based purely on my technical analysis of the recent share price movements of Alibaba Group Holdings Limited in the US stock exchange, which I am sharing purely for educational purposes only. They do not represent any buy or sell recommendations for the shares of the tech company. Please do your own due diligence before you make any trading and/or investing decisions.
Disclaimer: At the time of writing, I have an open Option trade on Alibaba Group Holdings Limited.
Stop Spending Hours Reading REIT Reports Every Quarter!
What if you could assess a REIT's portfolio occupancy, debt profile, valuation, and overall health in less than 30 seconds - without having to comb through a single quarterly report?
That's the problem the REIT Screener was built to solve.
Developed through a collaboration between ShareInvestor and The Singaporean Investor, the REIT Screener consolidates many of the key metrics and indicators I personally use when analysing REITs into one easy-to-use platform. Instead of spending hours extracting data manually every earnings season, you can now monitor the REITs you own and research new opportunities in just a few clicks.
If you're serious about REIT investing but don't have the time to manually track quarterly developments, the REIT Screener could be the shortcut you've been looking for:

Take a closer look at the REIT Screener here...


Comments (2)