1. What is the Tracker Fund of Hong Kong?
The Tracker Fund of Hong Kong (SEHK: 2800), or TraHK for short, has an interesting history dating back to the Asian Financial Crisis.
In 1998, the Hong Kong government intervened in the stock market and accumulated a sizeable portfolio of Hong Kong blue-chip shares. Instead of subsequently selling these shares all at once (which could potentially destabilise the market), the shares were packaged into an ETF, leading to the creation of TraHK in 1999.
Today, TraHK is managed by Hang Seng Investment Management Limited (HSVM), a wholly-owned subsidiary of Hang Seng Bank, which is itself part of the HSBC Group.
The ETF’s objective is straightforward – to replicate the performance of Hong Kong’s benchmark Hang Seng Index (HSI) as closely as possible.
TraHK has since grown to become one of the largest and most actively traded ETFs in Hong Kong, providing investors with a convenient way to gain broad exposure to the Hong Kong stock market through a single investment.
2. Which Index does the TraHK Track?
TraHK tracks the Hang Seng Index, or HSI for short, which is widely regarded as the benchmark index for the Hong Kong stock market.
The HSI is a free-float market capitalisation-weighted index comprising some of the largest and most actively traded companies listed on the Stock Exchange of Hong Kong (SEHK). Its constituents span a wide range of sectors, including financials, information technology, consumer discretionary, healthcare and energy.
However, one important thing investors should understand is that the HSI today is no longer simply an index comprising ‘Hong Kong companies’.
Over the years, a growing number of Mainland Chinese companies have obtained primary or secondary listings in Hong Kong and subsequently been included in the index.
As a result, by investing in TraHK, you are effectively gaining exposure to a combination of Hong Kong and Mainland Chinese businesses, rather than purely to Hong Kong’s domestic economy.
3. How are the Companies Selected for the HSI?
To be considered for inclusion in the HSI, a company generally needs to have been listed for at least 3 months.
Eligible companies are then assessed based on factors such as their average free float-adjusted market capitalisation. In simple terms, this looks at the market value of the shares that are actually available for public investors to trade, rather than shares held by controlling shareholders or other strategic investors.
Liquidity is another consideration. A stock needs to satisfy a minimum turnover velocity requirement to ensure that its shares are sufficiently actively traded.
Once included in the HSI, each company’s weight is determined primarily by its free float-adjusted market capitalisation, subject to an individual constituent weighting cap. This helps prevent any single company from becoming excessively dominant within the index.
Finally, the HSI is reviewed every quarter. This allows its constituents and their respective weightages to be periodically adjusted to reflect changes in market capitalisation, corporate actions, new listings and other market developments.
4. What is the Sector Breakdown of the ETF?
As at 31 July 2026, companies in TraHK’s 3 largest sectors (Financials, Consumer Discretionary and Information Technology) collectively accounted for approximately 71% of the ETF.
The breakdown across its 12 sectors was as follows: Financials (33.69%), Consumer Discretionary (21.90%), Information. Technology (15.40%), Healthcare (5.06%), Energy (4.77%), Properties & Construction (3.93%), Telecommunications (3.63%), Utilities (2.37%), Industrials (2.27%), Materials (2.21%), Consumer Staples (1.79%), Conglomerates (1.57%).
Cash and others made up the remaining 1.41%.
From the breakdown above, you can see that TraHK is quite heavily concentrated in its 3 largest sectors. Therefore, developments affecting financial institutions, consumer-related businesses and technology companies can have a significant impact on the ETF’s overall performance.
5. What is the Share Class Breakdown of the ETF?
Another interesting way of looking at TraHK is by the different types of shares held within the ETF.
The largest group, at 38.92%, comprises other Hong Kong-listed Mainland companies, which include familiar names such as Alibaba, Tencent, Xiaomi and Meituan.
This is followed by Hong Kong stocks, which account for 27.33% of the ETF. Some examples include HSBC Holdings, AIA Group, Hong Kong Exchanges and Clearing (HKEX), and CK Hutchison Holdings.
Next are H-shares, which make up another 25.12%. In layman terms, H-shares are shares of companies incorporated in Mainland China but listed on the Stock Exchange of Hong Kong. Examples include China Construction Bank, ICBC, Ping An Insurance, Bank of China and BYD.
Together, these 3 categories account for 91.37% of TraHK.
The remaining 8.63% comprises red chips (7.22%) and cash and others (1.41%).
Red chips are Chinese companies listed in Hong Kong which, unlike H-shares, are incorporated outside Mainland China and are controlled by Mainland Chinese government entities. Examples within the HSI include China Mobile and CNOOC.
The share class breakdown also illustrates just how significant Mainland China exposure has become within what is traditionally regarded as Hong Kong’s benchmark stock market index.
6. What are the Top 10 Holdings in TraHK?
Among TraHK’s 10 largest holdings, 5 are from the Financials sector, 2 from Consumer Discretionary, 2 from Information Technology, and 1 from Telecommunications.
The following are the ETF’s 10 largest holdings as at 14 August 2026:
1. HSBC Holdings PLC (SEHK: 5) – 8.92%
HSBC is one of the world’s largest banking and financial services groups, serving individuals, businesses and large institutions across more than 50 markets. Its businesses include everyday banking and lending, wealth management and insurance, commercial banking, as well as services for large corporations and institutional investors such as payments, financing and capital markets activities.
2. Alibaba Group Holding Limited (SEHK: 9988) – 7.48%
Alibaba is a Chinese technology company best known for its e-commerce businesses, operating online shopping platforms such as Taobao and Tmall in China, as well as international platforms such as AliExpress and Lazada. It is also a major cloud computing and AI provider through Alibaba Cloud, while its broader ecosystem includes logistics, food delivery and other internet services.
3. Tencent Holdings Limited (SEHK: 700) – 7.46%
Tencent is one of China’s largest technology companies, best known for WeChat/Weixin and its video gaming business, which includes popular titles such as Honor of Kings and PUBG Mobile. It also generates revenue from online advertising, digital content and subscriptions, payment and financial services such as WeChat Pay, as well as cloud and other services for businesses.
4. China Construction Bank Corporation (SEHK: 939) – 5.04%
China Construction Bank is one of China’s largest commercial banks, providing deposits, loans, credit cards, payments and wealth management services to individuals and businesses. It also operates treasury and asset management businesses, including investing and managing funds and providing financial market services.
5. AIA Group Limited (SEHK: 1299) – 4.44%
AIA is one of Asia’s largest life insurance groups, providing life, health and accident insurance, along with savings and retirement products to customers across 18 markets in Asia. It also provides businesses with employee benefits, group insurance and pension services.
6. Industrial and Commercial Bank of China (SEHK: 1398) – 3.54%
Industrial and Commercial Bank of China, or ICBC, is one of China’s largest banks, providing everyday banking services such as deposits, loans and payments to individuals and businesses. It also provides investment banking, asset management, financial leasing and other financial services, with operations both in China and overseas.
7. China Mobile Limited (SEHK: 941) – 3.06%
China Mobile is China’s largest telecommunications company, providing mobile phone, 5G and home broadband services to consumers. It also serves businesses through services such as cloud computing, data centres, dedicated network connections and Internet of Things (IoT) solutions.
8. Hong Kong Exchanges and Clearing Limited (SEHK: 388) – 2.94%
Hong Kong Exchanges and Clearing Limited, or HKEX, operates Hong Kong’s stock and derivatives exchanges and clearing houses, providing the infrastructure for companies to list and raise funds and for investors to trade and settle securities. It also owns the London Metal Exchange (LME) and earns revenue from trading and clearing fees, listing services, market data and other exchange-related services.
9. Meituan (SEHK: 3690) – 2.91%
Meituan is one of China’s largest online platforms for local services. It is best known for food delivery, but consumers can also use its platforms to order groceries and other goods, book hotels and travel, find restaurants, and access various local services. Its newer businesses include Xiaoxiang Supermarket for grocery retail and Keeta, its international food-delivery platform.
10. Xiaomi Corporation (SEHK: 1810) – 2.79%
Xiaomi is a Chinese consumer technology company best known for its smartphones. It also sells a wide range of connected smart devices, including TVs, wearables and home appliances, while providing internet services through its ecosystem. More recently, Xiaomi has expanded into electric vehicles (EVs), making smartphones, smart devices and EVs the key pillars of its business.
Collectively, these 10 companies account for approximately 48.58% of the ETF.
Despite this, the concentration at an individual company level remains relatively manageable. Apart from HSBC, Alibaba and Tencent, which have weightages of 8.92%, 7.48% and 7.46% respectively, none of the remaining constituents above has a weightage exceeding 5.04%.
This means that while TraHK has meaningful exposure to its largest companies, no single constituent alone has an overwhelmingly large influence over the entire ETF.
7. Does TraHK Pay Dividends?
Yes. As a unitholder of TraHK, you will receive dividend distributions twice a year, typically around end-May and November.
The table below shows TraHK’s dividend distributions between 2021 and 2025, together with the corresponding dividend yields based on its closing unit price on the final trading day of each calendar year:
| Year | Dividend Per Unit (HKD) | Dividend Yield |
| 2021 | HKD0.67 | 2.85% |
| 2022 | HKD0.64 | 3.21% |
| 2023 | HKD0.65 | 3.78% |
| 2024 | HKD0.77 | 3.80% |
| 2025 | HKD0.77 | 2.98% |
Apart from a slight dip in 2022, TraHK’s annual dividend payout generally improved over the period. Between 2021 and 2025, its dividend per unit increased from HKD0.67 to HKD0.77, representing a compound annual growth rate (CAGR) of approximately 3.55%.
As far as dividend yields are concerned, they ranged between 2.85% and 3.80% during the 5-year period.
In my opinion, these yields may not be particularly attractive to Singapore income investors, especially when compared against other income-producing investments such as Singapore REITs or the Singapore banks, where investors may be able to find yields of 5% or higher.
Therefore, I would view the dividends from TraHK as a supplementary component of its total returns rather than the main reason for investing in the ETF.
8. What are Some of the Key Risks of Investing in the TraHK?
As with any investment, TraHK comes with its own set of risks that investors should be aware of.
1. China/Hong Kong Economic & Policy Risk
A significant proportion of TraHK’s underlying companies are exposed to Mainland China.
As such, the ETF’s performance can be heavily influenced by the health of the Chinese economy, government policies and regulations, as well as geopolitical developments.
For example, regulatory crackdowns affecting technology companies, continued stress in China’s property market, weaker consumer spending, or renewed tensions between the United States and China could negatively affect the earnings and valuations of many of the ETF’s constituents at the same time.
2. Sector Concentration Risk
As at 31 July 2026, companies in the Financials, Consumer Discretionary and Information Technology sectors collectively accounted for approximately 71% of TraHK.
This means the ETF may be diversified across many individual companies, but it is considerably less diversified from a sector perspective.
Should any of these 3 major sectors experience a prolonged downturn, TraHK’s overall performance and returns to unitholders could be adversely affected.
3. Tracking Risk
TraHK aims to replicate the performance of the Hang Seng Index as closely as possible. However, its returns will not be exactly identical to those of the index.
Management fees, operating expenses, transaction costs, portfolio adjustments and other factors can result in a small difference between the ETF’s return and that of its benchmark.
This is known as tracking risk.
9. What are the Total Fees Associated with the TraHK?
One advantage of TraHK is that it is relatively inexpensive to own.
As at April 2026, the ETF’s ongoing charges were approximately 0.06% per year, which include its management fee, trustee fee and other ongoing fund expenses.
To put this into perspective, for every HKD100,000 invested, the ongoing cost works out to approximately HKD60 per year.
10. How has the Unit Price of the TraHK Performed since 2021?
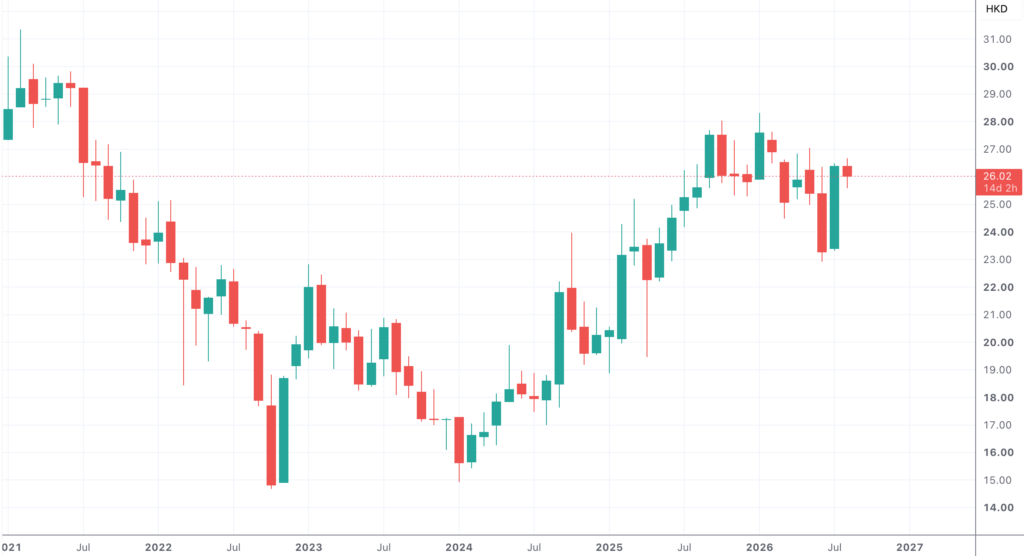
Looking at TraHK’s monthly unit price movements since January 2021, investors would have experienced quite a rollercoaster ride.
From a high of HKD31.34 in February 2021, TraHK subsequently entered a prolonged decline, eventually falling 53.2% to a low of HKD14.68 in October 2022.
It then staged a sharp recovery, climbing 55.4% to HKD22.82, only to fall another 34.6% to HKD14.93 in January 2024 – just a whisker above its October 2022 multi-year low.
Thankfully for investors, TraHK subsequently recovered strongly from these levels.
To put its longer-term performance into perspective, an investor who bought TraHK at HKD27.36 on 4 January 2021 and remained invested until the end of 2025, when it closed at HKD25.82 on 31 December 2025, would still have been sitting on an unrealised capital loss of approximately 5.6%.
However, this does not tell the full story because the investor would also have received dividends along the way.
TraHK distributed a total of HKD3.50 per unit between 2021 and 2025. Including these dividends, the investor’s total value would have amounted to approximately HKD29.32 per unit, translating to an overall gain of approximately 7.2% over the 5-year period, before taking transaction costs and the time value of the dividend payments into consideration.
11. What is the Lot Size & Price Increment of the ETF?
The Tracker Fund of Hong Kong is traded on the SEHK in board lots of 500 units, which means investors will typically buy or sell the ETF in multiples of 500 units.
Its minimum price movement, or tick size, is HKD0.02. In other words, the ETF’s quoted market price moves up or down in increments of HKD0.02.
Closing Thoughts
There are several things about TraHK that investors should understand before deciding whether it deserves a place in their portfolio.
First, while the ETF provides exposure to a large number of companies, it is relatively concentrated from a sector perspective. Companies in the Financials, Consumer Discretionary and Information Technology sectors collectively account for close to 71% of the ETF.
As such, positive or negative developments affecting companies within these 3 sectors could have a significant impact on TraHK’s overall performance.
On the other hand, I find its diversification at an individual company level more encouraging.
The 3 largest holdings (HSBC Holdings, Alibaba Group Holding and Tencent Holdings) collectively account for approximately 23.86% of the ETF. Beyond these 3 companies, no individual constituent has a weightage of more than 5.04%.
As such, while the ETF certainly has some heavyweight constituents, its performance is not overwhelmingly dependent on the fortunes of one single company.
Another plus is its relatively low cost. With ongoing charges of approximately 0.06% per year, investors can gain exposure to a broad basket of Hong Kong-listed companies without paying a high recurring management fee.
TraHK also pays distributions twice a year, typically around end-May and November. However, its dividend yields between 2021 and 2025 ranged from approximately 2.85% to 3.80%. For investors primarily seeking passive income, particularly Singapore investors accustomed to yields of 5% or 6% from certain REITs and dividend stocks, TraHK’s yield may therefore be less compelling.
Perhaps the biggest consideration, however, is its exposure to Mainland China.
A substantial proportion of TraHK comprises Mainland Chinese companies listed in Hong Kong, whether through H-shares, red chips or other Hong Kong-listed Mainland companies. Consequently, developments in China’s economy, regulatory environment and government policies can have a significant impact on the ETF.
Geopolitical tensions, particularly between China and the United States, are another risk investors need to keep in mind.
We have already seen how volatile TraHK can be. From its February 2021 high to its October 2022 low, the ETF lost more than half of its value before subsequently recovering. Investors considering TraHK should therefore be comfortable with potentially significant fluctuations in its unit price.
Ultimately, I see TraHK as a relatively straightforward and inexpensive way for investors who are bullish on the longer-term prospects of Hong Kong and Mainland Chinese companies to gain diversified exposure through a single investment.
However, investors should not mistake the ETF for a broadly diversified global portfolio. Its heavy exposure to a handful of sectors and, more importantly, to Mainland China means that its fortunes will remain closely tied to developments in the Chinese and Hong Kong markets.
As always, whether TraHK is suitable ultimately depends on your investment objectives, risk tolerance and how it complements the other investments already in your portfolio.
Disclaimer: At the time of writing, I do not have any units of the Tracker Fund of Hong Kong.
Are You Worried about Not Having Enough Money for Retirement?
You're not alone. According to the OCBC Financial Wellness Index, only 62% of people in their 20s and 56% of people in their 30s are confident that they will have enough money to retire.
But there is still time to take action. One way to ensure that you have a comfortable retirement is to invest in real estate investment trusts (REITs).
In 'Building Your REIT-irement Portfolio' which I've authored, you will learn everything you need to know to build a successful REIT investment portfolio, including a list of 9 things to look at to determine whether a REIT is worthy of your investment, 1 simple method to help you maximise your returns from your REIT investment, 4 signs of 'red flags' to look out for and what you can do as a shareholder, and more!

You can find out more about the book, and grab your copy (ebook or physical book) here...



Comments (0)