Fellow Singaporeans should have a faint memory of Geely (especially if you love cars) – where its vehicles were previously sold in Singapore, together with another China car brand ‘Cherry QQ’, where their car models were sold at pretty affordable prices (compared to the other car brands.)
Coming back to the Hong Kong-listed Geely Automobile Holdings Limited (SEHK:0175) again, do you know that besides its namesake brand of passenger vehicles, the company also controls the principal business of research and development, production, as well as sales of several passenger vehicle brands (some of them you should be familiar with), including Volvo (it is one of the most well-known and respected luxury car brands in the world), Lotus (a British producer of sports and racing cars), Lynk&Co (a brand you probably did not hear of before, where they are a new globally-focused high-end car brand based on the technology jointly developed by Geely and Volvo), along with another brand called Polestar (which focuses on high-performance electrified cars.)
Another thing you may want to note about the company is that, it currently has 9 manufacturing plants located in China – in Luqiao, Linhai, Ningbo/Cixi, Chunxiao, Baoji, Jinzhong, Xiangtan, Jinan, as well as in Chengdu.
In the rest of today’s share, I will be sharing with you aspects of Geely Automobile’s historical financial performance, debt profile, as well as dividend payouts that I like as well as dislike.
Let’s begin…
Financial Performance (between FY2016 and FY2020)
Geely Automobile has a financial year ending every 31 December. In this section, you will find the company’s key financial statistics recorded over the past 5 years – between FY2016 and FY2020.
Total Revenue and Net Profit (RMB’mil):
| FY2016 | FY2017 | FY2018 | FY2019 | FY2020 | |
| Total Revenue (RMB’mil) | RMB 53,722m | RMB 92,761m | RMB 106,595m | RMB 97,401m | RMB 92,114m |
| Net Profit (RMB’mil) | RMB 5,112m | RMB 10,634m | RMB 12,553m | RMB 8,190m | RMB 5,534m |

The company’s top- and bottom-line saw year-on-year (y-o-y) growths between FY2016 and FY2018, before recording declines over the next 2 years.
From my understanding, the y-o-y decline in FY2019 was attributed by the economic uncertainties surrounding the trade disputes between China as well as the United States (resulting in consumer confidence being dented), the elimination of purchase tax subsidies for fuel-efficient vehicles, along with the rush by the Chinese government to implement new emission standard; for FY2020, the y-o-y drop was due to the Covid-19 pandemic – particularly from the lockdowns implemented by the Chinese government to stem out further community spread of the virus.
Moving forward, as China have more or less managed to bring the pandemic under control, and normalcy more or less back in place, I will be monitoring its coming results for the first half of the financial year 2021 – where I expect its results to be stronger compared to the same time period last year (i.e. first half of the financial year 2020.)
Gross and Net Profit Margin (%):
The following is Geely Automobile’s gross and net profit margin over the past 5 years which I have calculated:
| FY2016 | FY2017 | FY2018 | FY2019 | FY2020 | |
| Gross Profit Margin (%) | 18.3% | 19.4% | 20.2% | 17.4% | 16.0% |
| Net Profit Margin (%) | 9.5% | 11.5% | 11.8% | 8.4% | 6.0% |
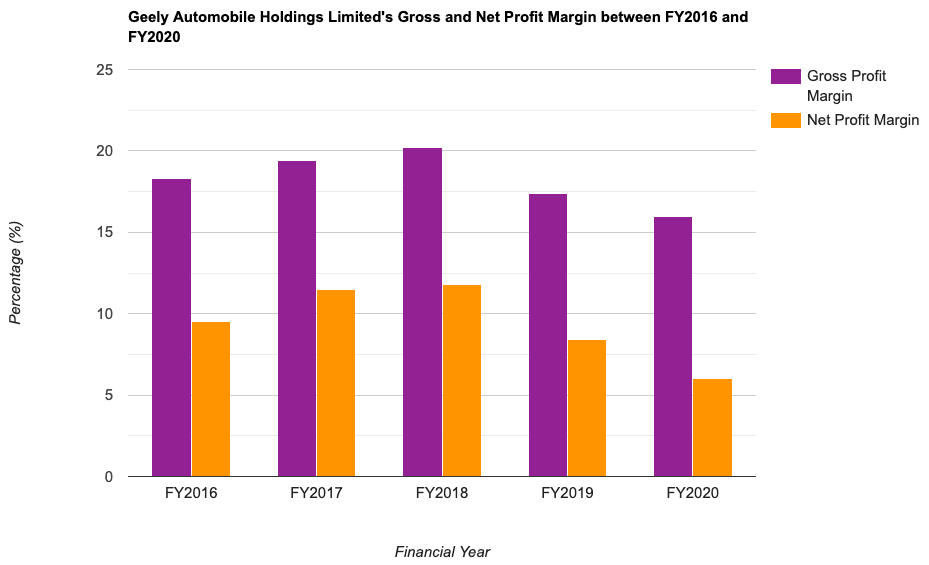
In-line with its total revenue and net profit growth over the years, the company’s gross and net profit margin over the same time period also exhibited the same pattern – where it saw y-o-y improvements between FY2016 and FY2018, before declining over the next 2 years.
Return on Equity (%):
For the benefit of those who may be coming across this term for the first time, Return on Equity, or RoE, basically refers to the percentage of profits a company is able to generate for every dollar of shareholders’ money it uses in its businesses.
Personally, my preference is towards companies that are able to generate a RoE of at least 15.0% consistently.
Did Geely Automobile’s RoE (which I have computed) fulfil this criteria of mine? Let us find out in the table below:
| FY2016 | FY2017 | FY2018 | FY2019 | FY2020 | |
| Return on Equity (%) | 20.9% | 30.9% | 27.9% | 15.0% | 8.7% |
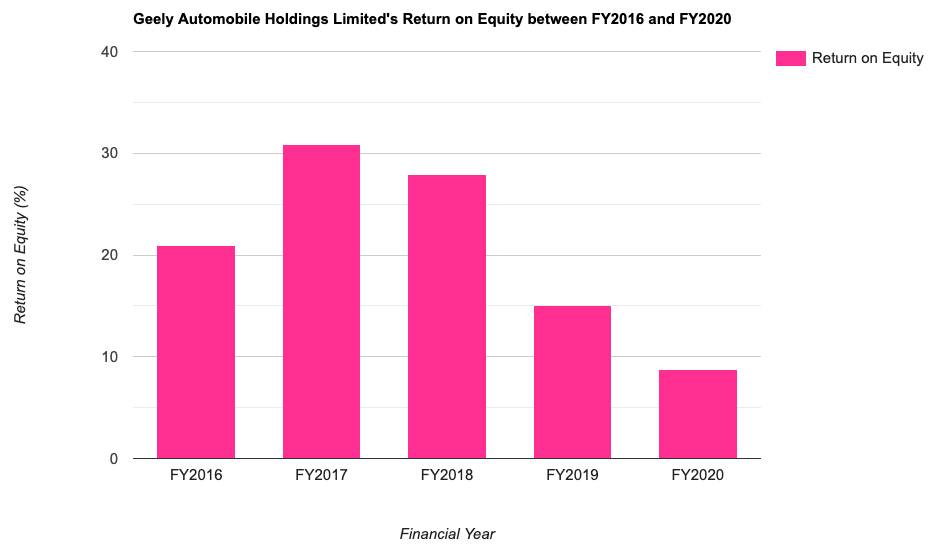
After hitting a high of 30.9% in FY2017, the company’s RoE have been on a downward decline in the years thereafter – and hit a low of 8.7% in FY2020.
This statistic is something I will keep a close watch on in the financial year ahead.
Debt Profile (between FY2016 and FY2020)
If you have been following my company review writeups, you will notice that, besides looking at its financial statistics, I will also study a company’s debt profile – where my preference is towards companies with minimal or no debt, and also one that is in a net cash position.
With that, let us take a look at Geely Automobile’s debt profile over the years which I have compiled in the table below:
| FY2016 | FY2017 | FY2018 | FY2019 | FY2020 | |
| Cash & Cash Equivalents (RMB’mil) | RMB 15,045m | RMB 13,415m | RMB 15,737m | RMB 19,281m | RMB 18,977m |
| Total Borrowings (RMB’mil) | RMB 174m | RMB 1,296m | RMB 1,375m | RMB 2,089m | RMB 1,960m |
| Net Cash/ Debt (RMB’mil) | RMB +14,871m | RMB +12,119m | RMB +14,362m | RMB +17,192m | RMB +17,017m |
While its total borrowings have been on a upward rise over the past 5 years (except in FY2020 where it declined slightly), its cash and cash equivalents have increased as well (and just like its total borrowings, its cash and cash equivalents have also went down slightly in FY2020.)
As such, the company was in a net cash position in all of the 5 years I have looked at. Another thing to note is that – apart from in FY2017, where its net cash position have went down slightly, all the other years saw its net cash position improving – and this is something I like about the company.
Dividend Payouts to Shareholders (between FY2016 and FY2020)
Geely Automobile declares a dividend payout to its shareholders on an annual basis – when it publishes its full-year results.
The following table is the company’s dividend payouts over the past 5 years, along with its payout ratio:
| FY2016 | FY2017 | FY2018 | FY2019 | FY2020 | |
| Dividend Per Share (HKD/share) | HKD 0.12 | HKD 0.29 | HKD 0.35 | HKD 0.25 | HKD 0.20 |
| Dividend Payout Ratio (%) | 18.6% | 20.3% | 22.0% | 24.9% | 30.0% |
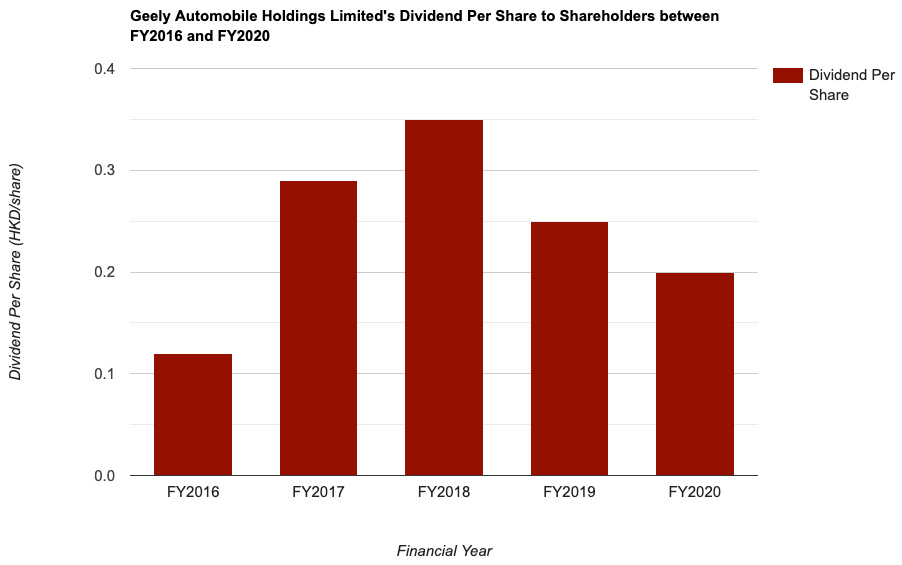
I noticed that the company’s dividend payout moved in-line with its net profit – where the company declared a lesser payout when its net profit declined (which can be exhibited in its dividend payouts in both FY2019 as well as in FY2020.)
Closing Thoughts
The thing I like most about the car company is its debt profile – as it was in a net cash position in all of the 5 financial years I have looked at.
As far as its financial performances are concerned, I am looking forward to studying its results for the first half of FY2021 to find out if the decline has reversed. I’d be very concerned if it were to continue.
Another thing to note is is that, personally, I am of the opinion that the company has no moat – in that there are also lots of other car brands available in the market for consumers to choose from. Also, as the industry is a fast growing one, the company would have to put in lots of money into the research and development to consistently improve on their product offerings.
With that, I have come to the end of my share about Geely Automobile today. Do take note that everything you have just read in this post is solely for educational purposes only. Also, all the opinion within are solely mine, based on my researches and understanding. They do not represent any buy or sell recommendations for shares of the company. Please do your own due diligence before you make any investment decisions.
Disclaimer: At the time of writing, I am not a shareholder of Geely Automobile Holdings Limited.
Are You Worried about Not Having Enough Money for Retirement?
You're not alone. According to the OCBC Financial Wellness Index, only 62% of people in their 20s and 56% of people in their 30s are confident that they will have enough money to retire.
But there is still time to take action. One way to ensure that you have a comfortable retirement is to invest in real estate investment trusts (REITs).
In 'Building Your REIT-irement Portfolio' which I've authored, you will learn everything you need to know to build a successful REIT investment portfolio, including a list of 9 things to look at to determine whether a REIT is worthy of your investment, 1 simple method to help you maximise your returns from your REIT investment, 4 signs of 'red flags' to look out for and what you can do as a shareholder, and more!

You can find out more about the book, and grab your copy (ebook or physical book) here...


Comments (4)