1. What is the iShares MSCI ACWI ETF?
The iShares MSCI ACWI ETF (NASDAQ: ACWI) has been listed on the Nasdaq Stock Market since March 2008. It gives investors exposure to large- and mid-sized listed companies across 23 developed markets and 24 emerging markets.
ACWI stands for All Country World Index, reflecting the fund’s broad geographical coverage.
Its developed-market exposure includes countries such as the United States, Japan, the United Kingdom, Canada, France, and Australia. Its emerging-market exposure includes countries such as China, India, Taiwan, Brazil, and South Africa.
The ETF is managed by BlackRock Inc. (NYSE: BLK) under its iShares brand, one of the world’s largest providers of exchange-traded funds.
As of July 14, 2026, the ETF held approximately 2,237 investments.
2. Which Index Does the ETF Benchmark Against?
The iShares MSCI ACWI ETF seeks to track the MSCI All Country World Index (Net).
The index is weighted according to the market value of its companies. In simple terms, the world’s largest listed companies receive the biggest allocations and have the greatest influence on the index’s performance. Countries with larger stock markets also receive more weight.
This explains why the United States accounts for most of the index, despite the index covering close to 50 developed and emerging markets.
The word ‘Net’ refers to how the index’s returns are calculated. It assumes that dividends are reinvested after allowing for standard withholding taxes.
3. What are the Top 10 Holdings in the ETF?
As of July 14, 2026, ACWI’s 10 largest holdings made up approximately 24.05% of its portfolio.
Nvidia and Apple were its 2 largest positions, with respective weights of 4.80% and 4.53%. Each of the other companies had a portfolio weight of less than 3%.
5 of the 10 holdings belonged to the information technology sector, 3 share classes belonged to the communication services sector, and 2 companies belonged to the consumer discretionary sector.
Taiwan Semiconductor Manufacturing Company was the only company in the top 10 based outside the United States. The remaining 9 equities were shares of US companies, including the 2 listed share classes of Alphabet.
The ETF’s 10 largest holdings were:
1. Nvidia Corporation (NASDAQ: NVDA) – 4.80%
2. Apple Inc. (NASDAQ: AAPL) – 4.53%
3. Microsoft Corporation (NASDAQ: MSFT) – 2.66%
4. Amazon.com Inc. (NASDAQ: AMZN) – 2.35%
5. Alphabet Inc. Class A (NASDAQ: GOOGL) – 2.05%
6. Taiwan Semiconductor Manufacturing Company Ltd. (TWSE: 2330) – 1.81%
7. Broadcom Inc. (NASDAQ: AVGO) – 1.72%
8. Alphabet Inc. Class C (NASDAQ: GOOG) – 1.62%
9. Meta Platforms Inc. Class A (NASDAQ: META) – 1.42%
10. Tesla Inc. (NASDAQ: TSLA) – 1.09%
4. Which Industries Does the ETF Cover?
The iShares MSCI AWCI ETF invests across all the major sectors of the global stock market, although some sectors receive much larger allocations than others.
Information Technology was the largest sector, accounting for 30.99% of the portfolio. Financials ranked second at 16.76%, followed by industrials at 10.75%.
Together, these 3 sectors represented approximately 58.5% of the ETF. Major developments affecting them could therefore have a meaningful effect on the fund’s overall performance.
The remaining sector allocations were:
- Consumer Discretionary (8.75%)
- Health Care (8.16%)
- Communication (8.09%)
- Consumer Staples (4.72%)
- Energy (3.76%)
- Materials (3.56%)
- Utilities (2.51%)
- Real Estate (1.60%)
- Cash and/or Derivatives (0.35%)
Although the iShares MSCI AWCI ETF provides exposure to many industries, its large technology allocation means it should not be viewed as being evenly divided across sectors.
5. How Global is the ETF?
The iShares MSCI AWCI ETF invests around the world, but most of its portfolio is still tied to the United States.
As of July 13, 2026, US issuers accounted for approximately 63.8% of the ETF. Issuers from all the other developed and emerging markets made up the remaining 36.2%.
Its leading country allocations were:
- United States (63.8%)
- Japan (5.0%)
- Taiwan (3.2%)
- United Kingdom (3.1%)
- Canada (3.0%)
- China (2.4%)
- South Korea (2.4%)
- France (2.1%)
- Switzerland (2.0%)
- Germany (1.9%)
- Australia (1.4%)
- India (1.3%)
6. What Does the ETF Charge?
The iShares MSCI ACWI ETF charges an annual management fee of 0.31%.
After including other operating expenses, its total expense ratio is 0.32%. This is equivalent to approximately US$32 a year for every US$10,000 invested, assuming the value of the investment remains unchanged.
Investors do not normally pay this amount through a separate bill. The expenses are deducted from the fund’s assets and are therefore reflected in its performance.
7. Does the ETF Pay Dividends?
The iShares MSCI ACWI ETF generally makes distributions twice a year, typically in June and December.
Its annual distributions and corresponding historical yields were:
| Year | Distribution Per Unit (US$) | Distribution Yield (%) |
| 2021 | US$1.812511 | 1.7% |
| 2022 | US$1.523237 | 1.8% |
| 2023 | US$1.915295 | 1.9% |
| 2024 | US$2.001598 | 1.7% |
| 2025 | US$2.196455 | 1.6% |
The yields above were calculated using the ETF’s closing price on the final trading day of each respective year.
Apart from a decline in 2022, ACWI’s annual distribution generally increased over this period. Between 2021 and 2025, its distribution grew at a compound annual growth rate (CAGR) of approximately 5%.
The dividend yield rose from 2021 to 2023 before declining in 2024 and 2025. With distributions paid only twice a year and its yield remaining in the 1% range, the ETF may not be especially attractive to investors whose main objective is generating income.
8. What are Some of the Risks Associated with the ETF?
1. Heavy Exposure to the United States: More than 60% of the iShares MSCI ACWI ETF was allocated to US issuers. Investors who already own a US-focused ETF, such as the SPDR S&P 500 ETF Trust (NYSE ARCA: SPY), could unintentionally become even more heavily exposed to the US market by adding the iShares MSCI ACWI ETF.
2. Currency Risk: The iShares MSCI ACWI ETF trades in US dollars, but many of its companies operate and have shares priced in other currencies. Changes in exchange rates can increase or reduce the US-dollar value of these investments. Trading the ETF in US dollars does not remove its exposure to foreign currencies.
3. Technology-Sector Concentration: Information technology accounted for more than 30% of the portfolio. A major downturn affecting technology companies could therefore have a significant effect on the ETF’s performance.
4. General Market Risk: The iShares MSCI ACWI ETF invests in equities, so its price can fall sharply during a global stock-market decline. Its broad diversification may reduce its reliance on an individual company or country, but it cannot prevent losses when markets around the world fall together.
9. How did the ETF Perform from 2021 to 2025?
The chart below shows how the iShares MSCI ACWI ETF’s unit price moved between January 2021 and the end of 2025, based on monthly prices:
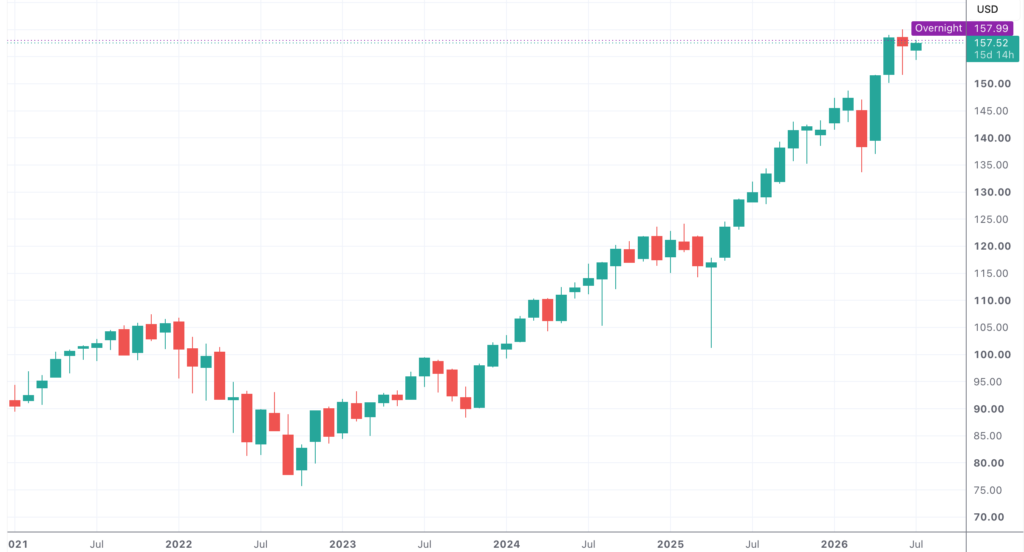
After reaching US$107.46 in November 2021, the ETF declined to US$75.71 in October 2022. This represented a fall of close to 30% from its previous high.
Its price subsequently recovered and entered a steady upward trend. The ETF’s unit price finished 2025 at US$141.49, and that upward movement continued into 2026.
An investor who bought the ETF at its opening price of US$91.60 on 04 January 2021, and held it until its closing price of US$141.49 on 31 December 2025, would have recorded an unrealised capital gain of approximately 54.5%. This is equivalent to a CAGR of around 9.1% over the 5-year period.
If all the dividends received during the period were added to the calculation without reinvestment, the total gain would have been approximately 64.8% before taxes, transaction costs, and currency-conversion expenses.
This example depends heavily on the selected purchase and sale dates. It is a historical illustration and should not be treated as an indication of future returns.
Closing Thoughts
The iShares MSCI ACWI ETF and the State Street SPDR S&P 500 ETF Trust have many of the same companies among their largest holdings. This is unsurprising because both funds give significant weight to the world’s largest US-listed companies.
As of 14 July 2026, one notable difference between their top holdings was Taiwan Semiconductor Manufacturing Company, which was listed on the Tapei Exchange. It appeared among the iShares MSCI ACWI ETF’s largest positions but was not part of the S&P 500. Micron Technology occupied a place among the State Street SPDR S&P 500 ETF Trust’s largest holdings instead.
The level of concentration was also different. The State Street SPDR S&P 500 ETF Trust’s 10 largest holdings accounted for approximately 37.54% of its portfolio, compared with 24.05% for the iShares MSCI ACWI ETF.
The iShares MSCI ACWI ETF may therefore appeal to investors who want less of their portfolio concentrated in the largest US companies, including the group commonly known as the ‘Magnificent Seven’: Alphabet, Amazon, Apple, Meta Platforms, Microsoft, Nvidia, and Tesla.
However, both ETFs remained heavily exposed to information technology, with the sector accounting for more than 30% of each portfolio.
The iShares MSCI ACWI ETF is also far more internationally diversified than the State Street S&P 500 ETF Trust. Although US issuers made up more than 60% of the iShares MSCI ACWI ETF, issuers from other developed and emerging markets still represented over 30% of the ETF.
Investors should nevertheless understand that the iShares MSCI ACWI ETF’s international exposure does not make it evenly distributed around the world. The United States remains its dominant market.
There is also a difference in distribution frequency. The State Street S&P 500 ETF Trust generally pays distributions quarterly, while the iShares MSCI ACWI ETF normally pays them twice a year. Combined with a historical yield in the 1% range, this may make the iShares MSCI ACWI ETF less attractive to investors looking for frequent or substantial income.
From a capital-growth perspective, the iShares MSCI ACWI ETF delivered a gain of approximately 54.5% between the first trading day of 2021 and the final trading day of 2025, based on the particular prices used in this example. This worked out to a CAGR of around 9.1% before including distributions.
While this historical performance was respectable, future results may be very different. Investors should consider the ETF’s fees, concentration, tax treatment, currency exposure, personal objectives, and ability to tolerate losses before investing.
Disclaimer: At the time of writing, I do not have units of the iShares MSCI ACWI ETF.
Are You Worried about Not Having Enough Money for Retirement?
You're not alone. According to the OCBC Financial Wellness Index, only 62% of people in their 20s and 56% of people in their 30s are confident that they will have enough money to retire.
But there is still time to take action. One way to ensure that you have a comfortable retirement is to invest in real estate investment trusts (REITs).
In 'Building Your REIT-irement Portfolio' which I've authored, you will learn everything you need to know to build a successful REIT investment portfolio, including a list of 9 things to look at to determine whether a REIT is worthy of your investment, 1 simple method to help you maximise your returns from your REIT investment, 4 signs of 'red flags' to look out for and what you can do as a shareholder, and more!

You can find out more about the book, and grab your copy (ebook or physical book) here...



Comments (0)