1. What Exactly does the iShares Core S&P Mid-Cap ETF Invest in?
When it comes to investing in the US stock market, most investors are familiar with either large-cap stocks or small-cap stocks.
At one end of the spectrum is the iShares Core S&P 500 ETF (NYSE ARCA: IVV), which tracks the S&P 500 Index and provides exposure to 500 of the largest publicly listed companies in the US. At the other end is the iShares Russell 2000 ETF (NYSE ARCA: IWM), which tracks the Russell 2000 Index and invests in approximately 2,000 small-cap companies.
Sitting between these two segments is the iShares Core S&P Mid-Cap ETF (NYSE ARCA: IJH), which tracks the S&P MidCap 400 Index. As its name suggests, the index comprises around 400 mid-sized US companies with market capitalisations that are generally larger than small-cap companies but smaller than those found in the S&P 500.
Mid-cap companies are often viewed as businesses that have successfully established their products and services, but still possess meaningful opportunities to expand their operations and grow earnings. As such, the ETF provides investors with exposure to companies that combine elements of both growth and stability.
One additional point worth noting is that companies included in the S&P MidCap 400 Index must satisfy certain profitability and liquidity requirements before being admitted into the index. This differentiates it from some small-cap indices, where companies may still be in their early stages of development and may not yet be consistently profitable.
2. Why Invest in Mid-Cap Stocks?
Most investors tend to focus their attention on either large-cap stocks or small-cap stocks, often overlooking the opportunities presented by mid-cap companies.
In many ways, mid-cap companies occupy an attractive middle ground. Unlike small-cap businesses, many mid-cap companies have already demonstrated the viability of their business models and have established customer bases, operating histories, and financial track records. At the same time, they often have considerably more room for growth than large-cap companies.
Many of today’s large-cap corporations were once mid-cap companies themselves. As businesses expand, increase their market capitalisation, and gain broader investor recognition, they may eventually be included in the S&P 500 Index.
Historically, some investors have referred to mid-cap stocks as the ‘sweet spot’ of the equity market because they potentially offer:
- Higher growth potential than large-cap companies
- Lower business risk than small-cap companies
- Greater earnings growth opportunities
- Exposure to future industry leaders
For investors seeking a balance between growth and stability, mid-cap stocks can therefore serve as a valuable component within a diversified portfolio.
3. Sector Exposure of the ETF
One of the key differences between the iShares Core S&P Mid-Cap ETF and other broad-based US equity ETFs lies in its sector composition.
The iShares Core S&P 500 ETF is heavily concentrated in the Information Technology sector, which accounts for approximately 37% of the portfolio. This reflects the significant influence of mega-cap technology companies such as Apple, Microsoft, Nvidia, Amazon, and Meta Platforms.
Meanwhile, the iShares Russell 2000 ETF has a more balanced allocation across sectors, with Industrials, Information Technology, Financials, and Health Care each accounting for meaningful portions of the portfolio.
In comparison, the iShares Core S&P Mid-Cap ETF has its largest allocation to the Industrials sector, which contributes more than a quarter of the portfolio. This provides investors with exposure to businesses involved in manufacturing, infrastructure, aerospace, logistics, engineering, and industrial services.
The sector breakdown of the ETF is as follows:
- Industrials – 26.08%
- Information Technology – 15.49%
- Financials – 14.71%
- Consumer Discretionary – 10.98%
- Health Care – 8.39%
- Real Estate – 6.68%
- Materials – 5.59%
- Energy – 4.47%
- Consumer Staples – 3.23%
- Utilities – 3.11%
- Communication Services – 1.08%
- Cash and/or Derivatives – 0.18%
Compared to the S&P 500, investors in the iShares Core S&P Mid-Cap ETF receive less exposure to the technology stocks and greater exposure to industrial and economically sensitive businesses.
4. Top 10 Companies in the ETF
One of the key benefits of investing in the iShares Core S&P Mid-Cap ETF is the high level of diversification it offers at the company level.
Unlike the iShares Core S&P 500 ETF, where a handful of mega-cap technology companies account for a significant portion of the portfolio, the holdings within iShares Core S&P Mid-Cap ETF are much more evenly distributed. This reduces the impact that any single company can have on the ETF’s overall performance.
At the time of writing, the ETF’s 10 largest holdings are spread across a variety of industries, with 6 companies from the Industrials sector, 2 from Information Technology, 1 from Energy, and 1 from Health Care.
The ETF’s largest holding is Flex Limited, which accounts for just 1.51% of the overall portfolio. Apart from Flex, none of the remaining top 10 holdings carries a weighting of more than 1%.
Collectively, the top 10 holdings make up only 8.29% of the ETF. This stands in sharp contrast to the iShares Core S&P 500 ETF, where the top 10 holdings account for approximately 37.34% of the portfolio.
In practical terms, this means that investors are less reliant on the fortunes of a small group of companies. Even if one of the ETF’s largest holdings experiences a significant decline in its share price, the overall impact on the ETF would likely be limited.
The top 10 holdings of the ETF are as follows:
i. Flex Limited (NASDAQ: FLEX) (1.51%) – Flex helps businesses design, manufacture, and supply a wide range of products, ranging from medical devices and industrial equipment to consumer electronics, allowing companies to outsource production instead of building and operating their own manufacturing facilities.
ii. Twilio Inc Class A (NYSE: TWLO) (0.82%) – Twilio provides communication tools that allow businesses to send text messages, make phone calls, verify users, and interact with customers through applications and websites without having to build the underlying communications infrastructure themselves.
iii. Curtiss Wright Corporation (NYSE: CW) (0.79%) – Curtiss-Wright designs and manufactures specialised technologies and components used in defence systems, aerospace applications, nuclear power facilities, and industrial equipment.
iv. Carpenter Technology Corporation (NYSE: CRS) (0.78%) – Carpenter Technology produces specialty metals and alloys used in industries such as aerospace, medical devices, semiconductors, energy, and defence.
v. TechnipFMC plc (NYSE: FTI) (0.76%) – TechnipFMC provides engineering services, equipment, and technologies that support offshore and onshore oil and gas production activities around the world.
vi. nVent Electric plc (NYSE: NVT) (0.75%) – nVent designs products and systems that help protect and manage electrical infrastructure in buildings, factories, data centres, utilities, and transportation networks.
vii. ATI Inc (NYSE: ATI) (0.74%) – ATI manufactures advanced specialty materials and alloys that are used in aerospace, defence, energy, medical, and industrial applications where performance under extreme conditions is critical.
viii. Sterling Infrastructure Inc (NASDAQ: STRL) (0.74%) – Sterling Infrastructure develops and builds infrastructure projects, including highways, bridges, data centres, warehouses, and commercial buildings across the US.
ix. Woodward Inc (NASDAQ: WWD) (0.70%) – Woodward develops control systems and components that improve the safety, efficiency, and reliability of aircraft, turbines, engines, and industrial machinery.
x. Illumina Inc (NASDAQ: ILMN) (0.70%) – Illumina develops DNA sequencing technologies and genetic analysis tools that help scientists and healthcare professionals better understand diseases and improve patient care.
Beyond diversification, another interesting observation is that many of the ETF’s largest holdings are not household names. Unlike the S&P 500, which is dominated by global giants such as Apple, Microsoft, and Nvidia, the iShares Core S&P Mid-Cap ETF provides investors with exposure to companies operating in specialised industries such as aerospace, industrial manufacturing, infrastructure development, advanced materials, and biotechnology.
This gives investors access to an entirely different segment of the US economy, one that may benefit from long-term trends such as infrastructure spending, reshoring of manufacturing activities, defence expenditure growth, industrial automation, and advances in healthcare technology.
While the ETF’s holdings may not be as widely recognised as the mega-cap names found in the S&P 500, many of these businesses have delivered strong earnings growth over the years, which ultimately contributes to both capital appreciation and dividend growth for unit holders.
5. Dividend Payout to Unit Holders
As a unit holder of the iShares Core S&P Mid-Cap ETF, you will receive dividends on a quarterly basis, typically in the middle of March, June, September, and December.
The following is the dividend payout of the ETF over the past 5 years (between 2021 and 2025), along with their corresponding dividend yield (based on the unit price at close on the last trading day of the respective years):
| Financial Year | Dividend Per Unit (US$) | Dividend Yield |
|---|---|---|
| 2021 | US$0.669965 | 1.18% |
| 2022 | US$0.814144 | 1.68% |
| 2023 | US$0.809421 | 1.46% |
| 2024 | US$0.827344 | 1.33% |
| 2025 | US$0.894712 | 1.36% |
Over the past 5 years, dividend payouts have generally trended upwards, increasing from US$0.669965 per unit in 2021 to US$0.894712 per unit in 2025. This represents a compound annual growth rate (CAGR) of approximately 6% per annum.
While the growth in distributions has been encouraging, investors should note that the ETF’s dividend yield has historically hovered around the 1% to 2% range. As such, income generation is unlikely to be the primary reason for investing in the ETF. Instead, investors are typically attracted to it for its long-term capital appreciation potential, with dividends serving as a secondary source of return.
For Singapore-based investors, it is also worth remembering that dividends paid by US-listed ETFs are generally subject to a 30% withholding tax before the distributions are credited to your brokerage account.
6. Unit Price Performance of the ETF
The following is the unit price movement of the iShares Core S&P Mid-Cap ETF on a monthly timeframe since January 2021:
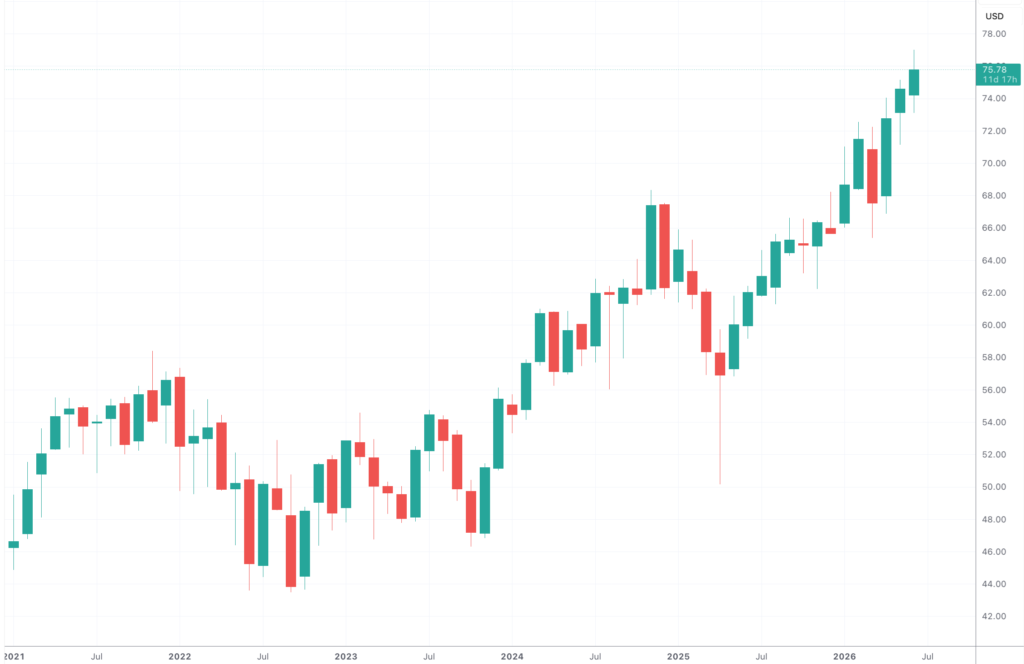
Over the past 5 years, the iShares Core S&P Mid-Cap ETF has delivered solid long-term returns despite periods of market volatility.
Between the beginning of 2021 and the end of 2025, the ETF’s unit price increased from US$46.26 to US$66.00, resulting in an unrealised capital gain of approximately 42.7%. This translates into a CAGR of around 7.4% per year.
When dividend distributions received over the period are included, the total return improves to approximately 51.4%.
7. Expenses Associated with the ETF
The ETF charges an annual expense ratio of just 0.05%, meaning an investor with a US$10,000 investment would incur only around US$5 in annual management expenses.
8. Risks Associated with Investing in the ETF
While the iShares Core S&P Mid-Cap ETF provides investors with a convenient and cost-effective way to gain exposure to approximately 400 mid-sized companies in the US, it is not without risks.
Before investing, it is important to understand that the ETF remains a 100% equity investment, and its performance will ultimately be tied to the fortunes of the underlying companies and the broader US economy.
Some of the key risks associated with investing in the ETF include:
i. Mid-Cap Company Risk: Compared to large-cap companies, mid-cap businesses generally have fewer financial resources, narrower product offerings, and less diversified revenue streams. As a result, they may be more vulnerable to economic slowdowns, industry-specific challenges, or adverse business developments. Their share prices can also experience greater volatility than those of larger and more established companies.
ii. Market Risk: Like all equity investments, the ETF is exposed to overall market risk. When investor sentiment weakens or when economic conditions deteriorate, share prices across the broader market may decline regardless of the underlying fundamentals of individual companies. Historically, mid-cap stocks have generally experienced larger drawdowns than large-cap stocks during severe market corrections, although they have also demonstrated the ability to recover strongly during subsequent market recoveries.
iii. Sector Concentration Risk: While the ETF is highly diversified at the company level, its sector allocations are less evenly distributed. Collectively, the Industrials, Information Technology, Financials, and Consumer Discretionary sectors account for approximately two-thirds of the ETF’s portfolio. Should one or more of these sectors encounter significant headwinds, such as weakening economic activity, declining consumer spending, or disruptions to industrial production, the ETF’s overall performance could be adversely affected.
iv. Interest Rate Risk: Many mid-cap companies rely more heavily on external financing to fund their expansion plans compared to large-cap companies. When interest rates rise, borrowing costs increase, which can place pressure on profit margins and reduce earnings growth. Higher financing costs may also cause businesses to delay investments, acquisitions, or expansion projects. Consequently, periods of rising interest rates can create headwinds for mid-cap stocks and, by extension, the ETF.
9. How to Invest in the ETF
Investing in the iShares Core S&P Mid-Cap ETF is straightforward and can be done through any brokerage platform that provides access to the US stock market.
Closing Thoughts
The iShares Core S&P Mid-Cap ETF offers investors exposure to approximately 400 mid-sized companies in the United States through a single investment. One of its biggest strengths lies in its diversification, as no individual company has an outsized influence on the ETF’s overall performance. Apart from Flex Limited, which has a portfolio weighting of 1.51%, none of the ETF’s holdings accounts for more than 1% of its total assets. Collectively, the top 10 holdings contribute just 8.29% to the portfolio, making the ETF significantly less concentrated than the iShares Core S&P 500 ETF.
From a sector perspective, the ETF has its largest exposure to the Industrials, Information Technology, Financials, and Consumer Discretionary sectors, which together account for about two-thirds of the portfolio. This provides investors with meaningful exposure to a broad range of businesses involved in manufacturing, infrastructure, industrial services, technology, consumer spending, and financial activities.
In terms of performance, investors who purchased units of the ETF at the start of 2021 and remained invested through the end of 2025 would have achieved an unrealised capital gain of approximately 42.7%, or 51.4% when dividends received are included. While these returns are respectable, they lag behind those generated by the iShares Core S&P 500 ETF over the same period, which benefited significantly from the strong performance of mega-cap technology companies in recent years. That said, the ETF has still comfortably outperformed the iShares Russell 2000 ETF, highlighting the attractive middle ground that mid-cap companies occupy between large-cap and small-cap stocks.
It is also worth remembering that investment performance tends to move in cycles. While large-cap technology stocks have dominated market returns in recent years, there have been periods in the past where mid-cap companies outperformed their large-cap counterparts. As such, investors should avoid judging the attractiveness of the ETF solely based on its recent performance relative to the S&P 500.
From an income perspective, the ETF may be less appealing to investors seeking regular cash flow. Although distributions are paid on a quarterly basis and have grown steadily over time, the dividend yield has historically remained around the 1% to 2% range. For Singapore-based investors, the effective yield will be further reduced by the 30% US withholding tax imposed on dividend distributions.
Overall, I view the iShares Core S&P Mid-Cap ETF as a suitable option for investors seeking diversified exposure to established US companies that still possess meaningful growth potential. While it may not deliver the explosive gains occasionally seen in small-cap stocks or the market dominance currently enjoyed by mega-cap technology companies, it offers exposure to a segment of the market that combines elements of both growth and stability. For investors looking to broaden their exposure beyond the S&P 500 and gain access to the often-overlooked mid-cap segment of the US equity market, the ETF is certainly worth considering.
Disclaimer: At the time of writing, I do not have any units of the iShares Core S&P Mid-Cap ETF.
Stop Spending Hours Reading REIT Reports Every Quarter!
What if you could assess a REIT's portfolio occupancy, debt profile, valuation, and overall health in less than 30 seconds - without having to comb through a single quarterly report?
That's the problem the REIT Screener was built to solve.
Developed through a collaboration between ShareInvestor and The Singaporean Investor, the REIT Screener consolidates many of the key metrics and indicators I personally use when analysing REITs into one easy-to-use platform. Instead of spending hours extracting data manually every earnings season, you can now monitor the REITs you own and research new opportunities in just a few clicks.
If you're serious about REIT investing but don't have the time to manually track quarterly developments, the REIT Screener could be the shortcut you've been looking for:

Take a closer look at the REIT Screener here...


Comments (0)