Among the topics in my discussions with fellow retail investors over the past couple of months, one of them was about investing in other countries for diversification – one of the countries being mentioned was Japan, for the fact that the country’s economy is the 3rd largest in the world. Also, the weaker Japanese Yen against the US dollar makes its assets more attractive to foreign investors (for information, the Japanese Yen is also quite weak against the Singapore dollar currently, and it is one of the reasons why the country is a top destination among Singaporeans to visit during the upcoming year-end school holidays).
When it comes to investing, you have the choice to either invest in individual companies (the good thing is that you can pick and choose the companies you want to add to your portfolio; however, because of the minimum lot size [100 shares], the financial barrier of entry can be high to some), or invest in an ETF (the good thing is that you can get instant diversification into a basket of companies in the ETF; however, you cannot choose the companies – very much like buying a ‘set meal’ where you cannot change the items within.)
On the latter, one of the ETFs you can consider investing in to get exposure into Japan is the iShares MSCI Japan ETF (ticker symbol NYSE ARCA:EWJ) – the ETF is one of the first Japan-focused ETF when it was launched back in 12 March 1996, and it quickly became the bellwether for US-based investors wanting to get an exposure in the Japanese market.
I understand that the ETF may sound very unfamiliar to you at this juncture. In this post, I will be sharing researches I have done about it, so that you can have a better understanding about the ETF prior to making any investment decisions.
Let’s get started…
What Does the iShares MSCI Japan ETF Track?
The ETF tracks the performance of the MSCI Japan Index, which currently comprises 235 constituents – with companies being mid- and large-cap, and in various sectors including technology, healthcare, financials, and industrials.
Much like our Straits Times Index, the MSCI Japan Index is being reviewed once every quarter, with companies being added and removed based on market capitalisation and liquidity.
What are Some of the Fees of the ETF?
From my understanding in iShares.com website about the ETF, the expense ratio is 0.50% – meaning for every US$1,000 you invest in the ETF, you pay about $5 in expenses each year.
The fees are used to cover the cost of management fee (which includes the cost of tracking the underlying index [in this case it is the MSCI Japan Index], as well as trading the underlying securities), along with other expenses.
What is the Dividend Payout Frequency of the ETF?
As an investor of the ETF, you will receive a dividend payout twice in a calendar year (once in June and once in December), and it is paid out in US Dollar.
The ETF’s dividend payout over the last 5 years (between 2018 and 2022) is as follows:
| 2018 | 2019 | 2020 | 2021 | 2022 | |
| Dividend Per Unit (US$) | US$ 0.865893 | US$ 1.203281 | US$ 0.699943 | US$ 1.392989 | US$ 0.67018 |

From the above, you can see that the ETF’s dividend payout over the years has been irregular. Also, do note that if you are a Singaporean, all dividends declared will be subjected to a 30.0% withholding tax – meaning the dividends you eventually receive will be 30.0% lower.
What Sectors are the Constituents of the ETF in?
The following is a breakdown of the sectors of the companies, along with their respective weightage, of the ETF at the time of writing (17 October 2023):
- Industrials (22.12%)
- Consumer Discretionary (19.43%)
- Information Technology (13.72%)
- Financials (12.66%)
- Healthcare (8.37%)
- Communication (7.17%)
- Consumer Staples (5.96%)
- Materials (4.54%)
- Real Estate (3.04%)
- Utilities (1.15%)
- Cash and/or Derivatives (1.01%)
- Energy (0.83%)
Source: iShares.com
What are the Top 10 Constituents of the ETF?
Out of the top 10 constituents, 3 are in the consumer discretionary sector (10.31% weightage), 3 are in the financial sector (6.27% weightage), 2 are in the information technology sector (4.15% weightage), 2 in the industrials sector (3.3% weightage), and 1 in the materials sector (1.61% weightage) – together, they have a 25.64% weightage.
The following are some details about each of the 10 constituents arranged according to their weightage – from the most to the least (information accurate at the time of writing of this post on 17 October 2023):
1. Toyota Motor Corporation (TYO:7203) – 5.60% weightage
Headquartered in Toyota City in Aichi, Japan, it is the largest automobile manufacturer in the world by production, and ninth-largest company in the world by revenue. The company is best known for its fuel-efficient vehicles, such as the Prius, Corolla, and Camry, along with being a leader in the development of hybrid and electric vehicles.
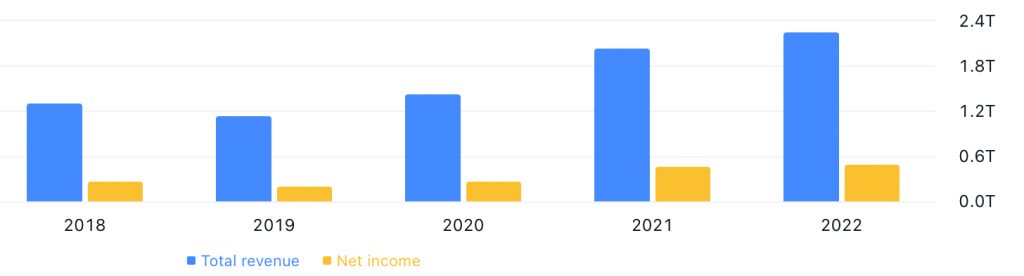
The following is Toyota Motor Corporation’s total revenue and net income over the last 5 years:
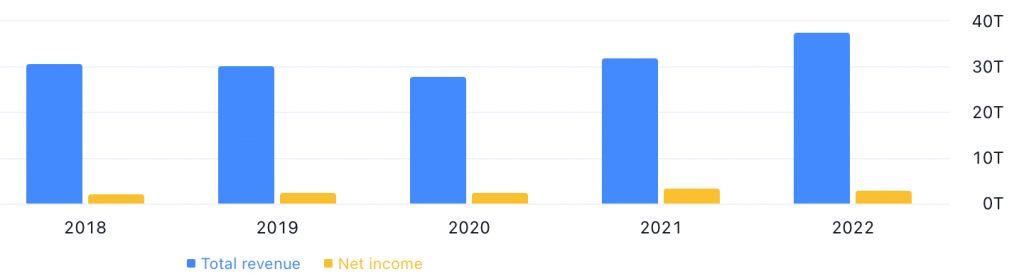
Toyota Motor Corporation’s Total Revenue & Net Income between FY2018 and FY2022 – Source: TradingView.com
Its total revenue grew from JPY30.22 trillion in FY2018 to JPY37.15 trillion in FY2022 – a compound annual growth rate (CAGR) of 4.2%, while its net income grew from JPY1.88 trillion to JPY2.45 trillion in the same time period, recording a CAGR of 5.4%.
2. Sony Group Corporation (TYO:6758) – 3.18% weightage
Headquartered in Minato in Tokyo, Japan, Sony Group Corporation is one of the largest electronics companies and the inventor of a number of products, including transistor ratio, the Walkman, the Handycam, the compact disc (CD) player, and the PlayStation video game console.
Apart from being in the electronics and gaming businesses, Sony Group Corporation is also a major player in the entertainment industry, with its own movie studio, record label, and music publishing company.
The following is Sony Group Corporation’s total revenue and net income over the last 5 years:
Sony Group Corporation’s Total Revenue & Net Income between FY2018 and FY2022 – Source: TradingView.com
Its total revenue grew from JPY8.69 trillion in FY2018 to JPY11.54 trillion in FY2022 – a CAGR of 5.8%. However, its net income only saw a CAGR of 0.5%, where it grew from JPY916.27 billion to JPY937.13 billion in the same time period.
3. Mitsubishi UFJ Financial Group Inc. (TYO:8306) – 2.77% weightage
Mitsubishi UFJ Financial Group Inc., or MUFG for short, is the largest financial group in Japan, and one on the largest in the world – with a global network of over 1,000 branches and offices in over 40 countries and territories.
The company was formed in 2005 through the merger of Mitsubishi Tokyo Financial Group, and UFJ Holdings, and it is a holding company with a wide range of financial businesses, including commercial banking, trust banking, securities, credit cards, consumer finance, asset management, and leasing.
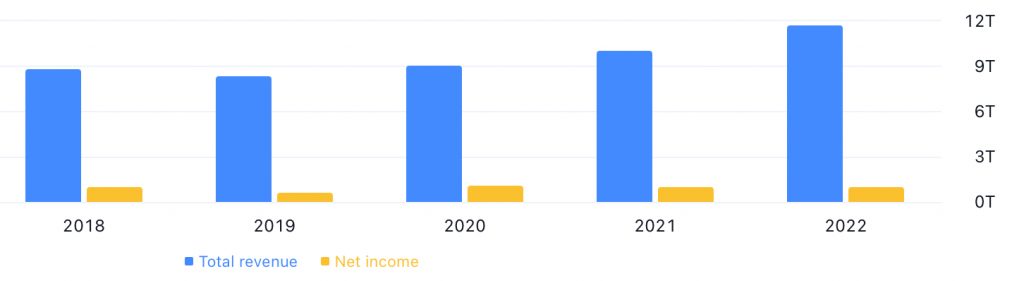
The following is MUFG’s total revenue and net income over the last 5 years:
Mitsubishi UFJ Financial Group Inc.’s Total Revenue & Net Income between FY2018 and FY2022 – Source: TradingView.com
Its total revenue grew from JPY6.11 trillion in FY2018 to JPY8.66 trillion in FY2022 – a CAGR of 7.2%. At the same time, its net income recorded a CAGR of 5.2% in the same time period – where it went up from JPY872.69 billion in FY2018 to JPY1.12 trillion in FY2022.
4. Keyence Corporation (TYO:6861), 2.19% weightage
Headquartered in Osaka, Japan, Keyence Corporation specialises in the development, manufacturing, and sales of automation sectors, vision systems, barcode readers, measuring instruments, and other factory automation products.
The company has a global reach, with operations in over 46 countries and 240 locations, it is well-positioned to benefit from the growing demand for factory automation solutions as companies around the world invest in automating their manufacturing processes.
The following is Keyence Corporation’s total revenue and net income over the last 5 years:
Keyence Corporation’s Total Revenue & Net Income between FY2018 and FY2022 – Source: TradingView.com
Its total revenue grew from JPY587.10 billion in FY2018 to JPY922.42 billion in FY2022 – a CAGR of 9.5%. Its net income also recorded a similar CAGR of 9.9% in the same time period – where it went up from JPY226.15 billion in FY2018 to JPY362.96 billion in FY2022.
5. Tokyo Electron Ltd (TYO:8035), 1.96% weightage
Tokyo Electron Ltd is one of the world’s leading providers of semiconductor production equipment, where its products are used by major semiconductor manufacturers around the world.
The company’s products include a wide range of equipment used in the semiconductor manufacturing process, such as lithography equipment, deposition equipment, etching equipment, and cleaning equipment. It also provides services such as equipment maintenance and repair.
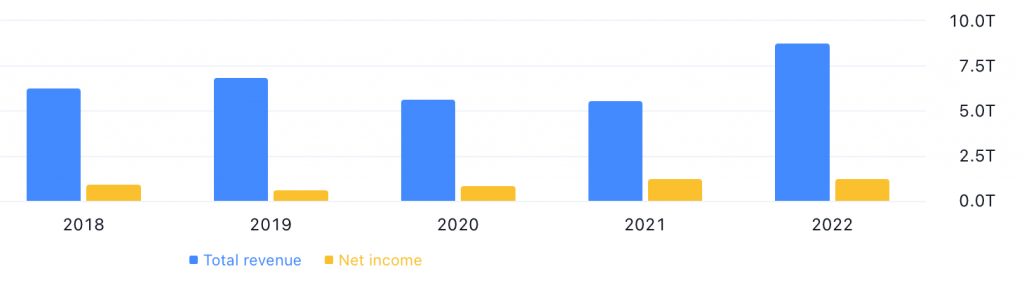
Here is Tokyo Electron Ltd’s total revenue and net income over the last 5 years:
Tokyo Electron Ltd’s Total Revenue & Net Income between FY2018 and FY2022 – Source: TradingView.com
Its total revenue grew from JPY1.28 trillion in FY2018 to JPY2.21 trillion in FY2022 – a CAGR of an impressive 11.5% (in my opinion). Its net income had an even better performance in the same time period, where it grew at a CAGR of 13.7% – from JPY248.23 billion in FY2018 to 471.58 billion in FY2022.
6. Sumitomo Mitsuki Financial Group Inc. (TYO:8316), 1.82% weightage
Sumitomo Mitsuki Financial Group Inc., or SMFG for short, offers a wide range of financial services, including banking, leasing, securities, credit cards, and consumer finance.
Formed in 2002 through the merger of Sumitomo Bank and Sakura Bank, today, SMFG is one of the largest financial institutions in Japan, and has a global presence with offices in over 40 countries.
The following is SMFG’s total revenue and net income over the last 5 years:

Sumitomo Mitsuki Financial Group Inc.’s Total Revenue & Net Income between FY2018 and FY2022 – Source: TradingView.com
In terms of the CAGR of its total revenue over the last 5 years, it was at just 1.2% (from JPY5.64 trillion in FY2018 to JPY6.00 trillion in FY2022), while its net income saw a CAGR of 2.1% in the same time period – from JPY726.68 billion in FY2018 to JPY805.84 billion in FY2022.
7. Hitachi Ltd (TYO:6501), 1.68% weightage
Founded in 1910, Hitachi Ltd is a Japanese multinational conglomerate corporation headquartered in Marunouchi in Tokyo, Japan, and it is one of the largest companies in the country by revenue. Currently, it has a global presence in over 100 countries.
The company operates in a variety of industries, including information and telecommunications, power and industrial systems, construction machinery, consumer products, and finance. It is also a major player in the renewable energy sector, as the company is committed to sustainability and is working to develop innovative solutions to address the world’s environmental challenges.
Here is Hitachi Ltd’s total revenue and net income over the last 5 years:

Hitachi Ltd’s Total Revenue & Net Income between FY2018 and FY2022 – Source: TradingView.com
Over the last 5 years, its total revenue grew from JPY9.48 trillion in FY2018 to JPY10.88 trillion in FY2022 – a CAGR of 2.8%, while its net income grew from JPY222.55 billion in FY2018 to JPY649.12 billion in FY2022 – a CAGR of a very impressive 23.9%.
8. Mitsubishi Corporation (TYO:8058), 1.62% weightage
Founded in 1859 as a trading company for the Mitsubishi Group, it has played a major role in the development of the Japanese economy, and it continues to be a leading player in global trade today – with offices in over 90 countries.
Currently, the company is involved in a wide range of businesses, including energy (where it is involved in the exploration, production, transportation, and marketing of oil, gas, and electricity), metals (where they are a leading supplier of metals, including iron ore, coal, and copper), machinery (where it is a major supplier of industrial, construction, as well as agricultural machinery), chemicals (where the company is a leading supplier of chemicals, including petrochemicals, plastics, and fertilisers), food (where they are a major supplier of food, including grain, sugar, and meat), as well as consumer goods (where they are a leading supplier of consumer goods, including electronics, apparel, and cosmetics).
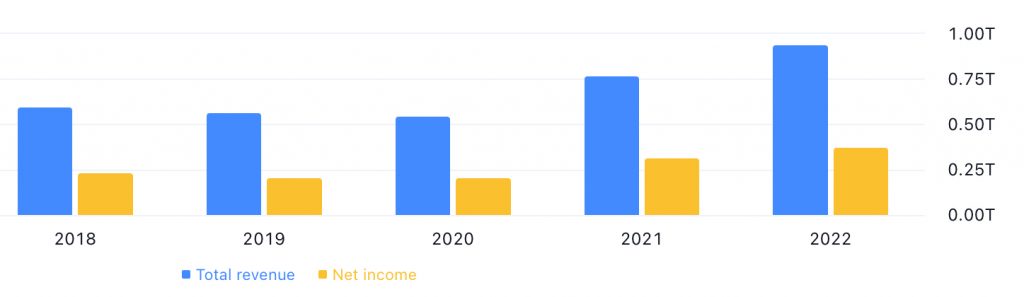
The following is Mitsubishi Corporation’s total revenue and net income over the last 5 years:
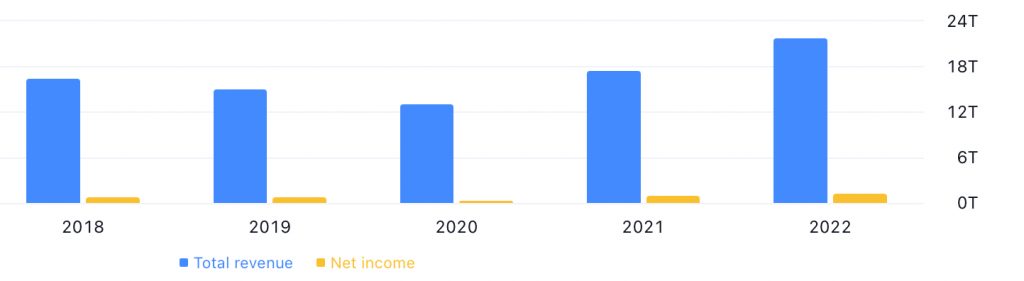
Mitsubishi Corporation’s Total Revenue & Net Income between FY2018 and FY2022 – Source: TradingView.com
In the last 5 years, Mitsubishi Corporation’s total revenue grew from JPY16.10 trillion in FY2018 to JPY21.57 trillion in FY2022, a CAGR of 6.0%, while its net income grew from JPY590.74 billion to JPY1.18 trillion in the same time period – recording a CAGR of 14.9%.
9. Shin-Etsu Chemical Co., Ltd (TYO:4063), 1.61% weightage
Shin-Etsu Chemical Co., Ltd is a leading producer of silicones, cellulose derivatives, and other specialty chemicals, with its products used in a wide range of industries, including electronics, automotive, healthcare, and construction. It is headquartered in Tokyo, Japan, and has manufacturing locations in 14 countries worldwide.
The following is the company’s total revenue and net income over the last 5 years:

Shin-Etsu Chemical Co., Ltd’s Total Revenue & Net Income between FY2018 and FY2022 – Source: TradingView.com
Its total revenue improved from JPY1.59 trillion in FY2018 to JPY2.81 trillion in FY2022 – a CAGR of a good 12.1%, while its net income in the same time period went up from JPY309.13 billion to JPY708.24 billion – a CAGR of 18.0%.
10. Honda Motor Ltd (TYO:7267), 1.53% weightage
Headquartered in Minato in Tokyo, Japan, Honda Motor Ltd is a leading manufacturer of vehicles (automobiles and motorcycles) and power products (lawnmowers, generators, and snowblowers) that are known for their quality, fuel efficiency, and reliability.
The company has been the world’s largest motorcycle manufacturer since 1959. It is also the eighth largest automobile manufacturer in the world.
The following is Honda Motor Ltd’s total revenue and net income over the last 5 years:
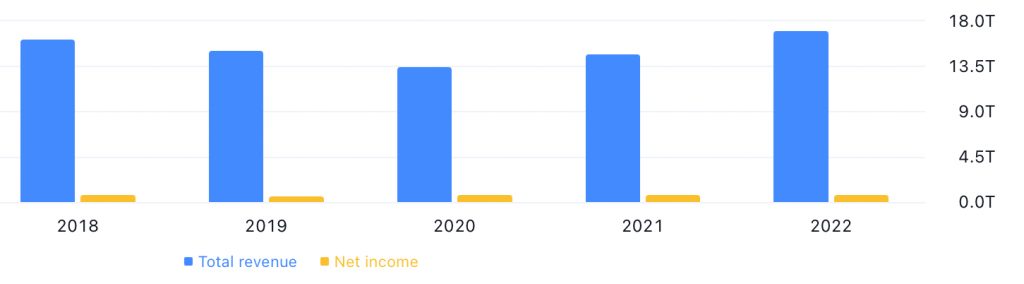
Honda Motor Ltd’s Total Revenue & Net Income between FY2018 and FY2022 – Source: TradingView.com
Over a 5-year period, its total revenue improved from JPY15.89 trillion in FY2018 to JPY16.91 trillion in FY2022 – a CAGR of 1.3%, while its net income went up from JPY610.32 billion to JPY651.42 billion in the same time period – a CAGR of 1.3% as well.
To Buy or Not to Buy?
For those of you who have read the article until this point, I really hope you now have a better understanding of the ETF.
Right now, the question on your mind is whether this is the right time to buy – to best answer this question, let us have a look at its price movement since its launch on a weekly timeframe (why weekly timeframe is because for longer-term investment, I will identify buy and sell points using this timeframe), as follows (with key support/resistance points marked out):

iShares MSCI Japan ETF’s Unit Price Movement on a Weekly Timeframe since Inception
Personally, I will be looking at buying some at either US$52.33 or US$47.64 – both of them key support points based on my technical analysis.
Closing Thoughts
For those who would like to get some exposure into the Japanese market, the iShares MSCI Japan ETF (NYSE ARCA:EWJ) is something you may consider to get an instant diversification into 235 companies.
I personally feel the 10 companies with the highest weightage in the index is well-diversified among the different sectors. Another thing to note is that the company with the highest weightage (i.e., Toyota Motor Corporation) has a weightage of just 5.60%.
Also, in terms of the performance of the same 10 companies, I am of the opinion (and I’m sure you will agree with me) that they have been quite stable over the last 5 years.
However, one thing to note about the ETF is the irregularity of the dividend payouts. Not only that, as a Singaporean, all dividend payouts are subject to a 30.0% withholding tax, hence the payout you receive will be 30.0% lesser that the amount declared. Personally, if I were to invest in a ETF listed in the US, I will focus on the potential capital appreciation opportunities, rather than the dividend payouts.
With that, I have come to the end of my sharing about the iShares MSCI Japan ETF. As always, the contents above is meant for educational purposes only and do not constitute any buy or sell calls for the ETF. You should always do your own due diligence before you make any investment decisions.
Disclaimer: At the time of writing, I am not invested in the iShares MSCI Japan ETF.
Are You Worried about Not Having Enough Money for Retirement?
You're not alone. According to the OCBC Financial Wellness Index, only 62% of people in their 20s and 56% of people in their 30s are confident that they will have enough money to retire.
But there is still time to take action. One way to ensure that you have a comfortable retirement is to invest in real estate investment trusts (REITs).
In 'Building Your REIT-irement Portfolio' which I've authored, you will learn everything you need to know to build a successful REIT investment portfolio, including a list of 9 things to look at to determine whether a REIT is worthy of your investment, 1 simple method to help you maximise your returns from your REIT investment, 4 signs of 'red flags' to look out for and what you can do as a shareholder, and more!

You can find out more about the book, and grab your copy (ebook or physical book) here...


Comments (0)