Talk about the company Moody’s Corporation (NYSE:MCO), what is the first thing that comes to your mind?
I’m sure you can immediately recall credit ratings the NYSE-listed company assign to companies and countries. To give you a few examples, our local bank, DBS Group Holdings Limited, has a credit rating of ‘Aa1’ by Moody’s. The Singapore Government has been accorded the strongest credit rating of ‘Aaa’ by Moody’s, meaning it has a strong creditworthiness, with a minimal probability of default (this also means that the Singapore Government-issued Singapore Savings Bonds [SSBs], Treasury Bills [T-Bills], and Singapore Government Securities [SGS] Bonds are among one of safest investments.)
Now that you have a rough understanding about what the company is about, the next question is whether the US-listed company makes a good investment.
In today’s post, you will find researches I have done about Moody’s Corporation, including more information about the businesses, as well as its financial performance, debt profile, and dividend payout over the last 5 years (between FY2018 and FY2022 – the company has a financial year end every 31 December). I will also be sharing with you whether the company’s current traded price is considered to be ‘cheap’ or ‘expensive’, together with the company’s ‘fair value’ based on its 5-year valuations.
Let’s begin:
Brief Introduction about Moody Corporation’s Businesses
Moody’s Corporation reports its activities under 2 business segments:
(i) Moody’s Investors Service (MIS) – it is involved in the rating of the credit worthiness of borrowers, and also the debt they issue. This helps investors make informed decisions about where to put their money depending on their risk appetite;
(ii) Moody’s Analytics (MA) – it provides data, research, and software to help businesses manage risk, including credit risk, market risk, financial crime, supply chain risk, catastrophe risk, and climate risk. This helps businesses make better decisions and minimise the probability of making losses in their investments.
Financial Performance
In this section, you will find the NYSE-listed company’s total revenue and net profit, net profit margin, and return on equity recorded over the last 5 financial years (i.e., between FY2018 and FY2022):
Total Revenue & Net Profit:
| FY2018 | FY2019 | FY2020 | FY2021 | FY2022 | |
| Total Revenue (US$’mil) | $4,443m | $4,829m | $5,371m | $6,218m | $5,468m |
| Net Profit (US$’mil) | $1,310m | $1,422m | $1,778m | $2,214m | $1,374m |
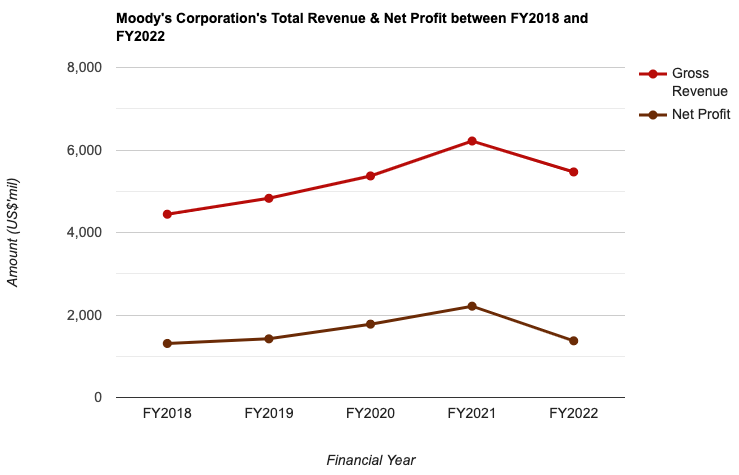
Both its total revenue and net profit saw year-on-year (y-o-y) improvements in the last 5 years, except for FY2022 – as revenue in Moody’s Investors Service business segment saw a 29% decline due to inflationary concerns and geopolitical tensions significantly dampened issuance throughout the financial year, partially offset by a 15% increase in revenue from the Moody’s Analytics business segment.
In terms of their compound annual growth rate (CAGR), its total revenue and net profit recorded a stable growth rate of 4.2% and 1.0% respectively over a 5-year period.
Net Profit Margin:
| FY2018 | FY2019 | FY2020 | FY2021 | FY2022 | |
| Net Profit Margin (%) | 29.5% | 29.4% | 33.1% | 35.6% | 25.1% |
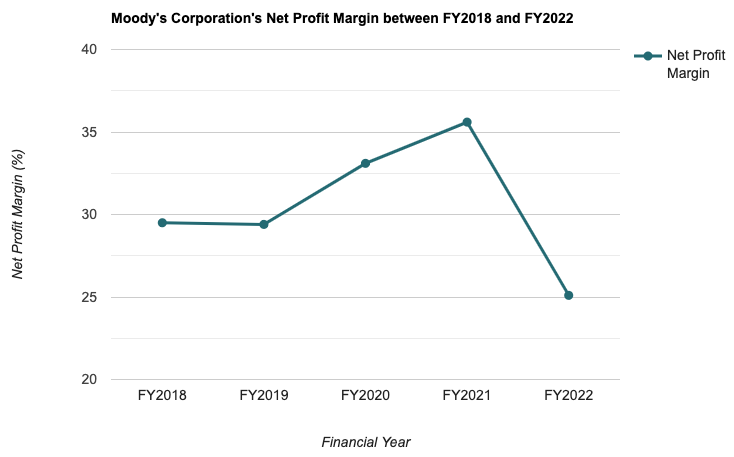
The growth of its net profit margin, in my opinion, has been a bit on the bumpy side over the years – it grew to a high of 35.6% in FY2021 (which is the highest in 5 years), before falling to 25.1% the following year (which happens to be the lowest in 5 years).
Return on Equity:
Return on Equity, or RoE for short, is a measure of a company’s profitability for every dollar of shareholders’ money it uses in its business. Preferably, I would prefer to invest in companies that are able to maintain their RoE at above 15.0%.
The following table is Moody’s Corporation’s RoE over the last 5 years which I have computed:
| FY2018 | FY2019 | FY2020 | FY2021 | FY2022 | |
| Return on Equity (%) | 285.4% | 232.4% | 113.3% | 81.2% | 54.5% |
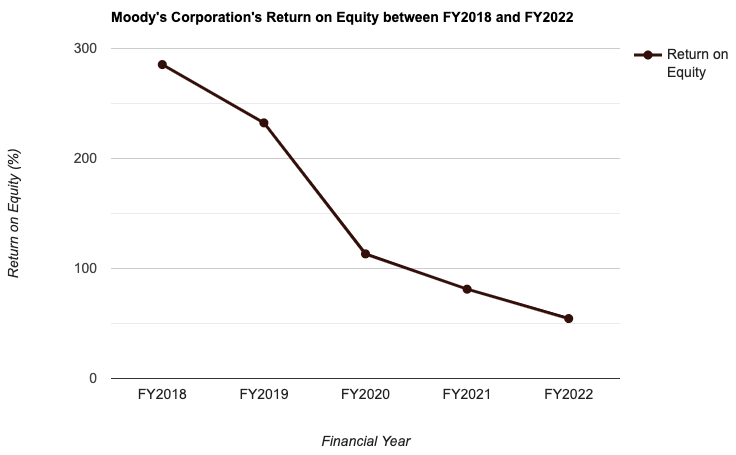
While it’s RoE have been maintained at way above the 15.0% level over the years, but it has been on a downward slide over the last 5 years.
Debt Profile
Apart from studying a company’s financial performance (which we have just looked at in the previous section), I will also study its debt profile and make sure it is not ladened with debt (of course, my preference is towards those that have very little or no debt).
In the table below, you will find Moody’s Corporation’s debt profile recorded over the last 5 years:
| FY2018 | FY2019 | FY2020 | FY2021 | FY2022 | |
| Cash & Cash Equivalents (US$’mil) | $1,685m | $1,832m | $2,597m | $1,811m | $1,769m |
| Total Borrowings (US$’mil) | $5,676m | $5,581m | $6,422m | $7,413m | $7,389m |
| Net Cash/ Debt (US$’mil) | -$3,991m | -$3,749m | -$3,825m | -$5,602m | -$5,620m |
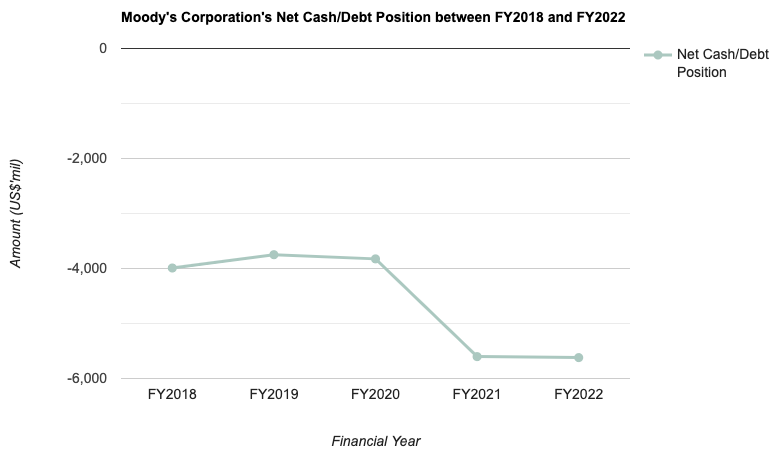
The company have fallen deeper into a net debt position over the last 5 years (even though it has recorded a slight improvement in FY2019) – a negative here.
However, its current ratio have been maintained at between 1.6 and 2.0 in the same time period, implying it is able to fulfil its short-term debt obligations if need be.
Dividend Payout to Shareholders
The management of Moody’s Corporation declares a dividend payout to its shareholders on a quarterly basis. However, if you are a Singaporean investing in US-listed companies, all dividend payouts received will be subjected to a 30% withholding tax (meaning to say all dividend payouts you receive will be 30% lesser than the amount that is declared). Personally, I do not invest in a US company for its dividends, but for its capital appreciation opportunity.
In the table below, you will find Moody’s Corporation’s dividend payout to shareholders over the last 5 years:
| FY2018 | FY2019 | FY2020 | FY2021 | FY2022 | |
| Dividend Per Share (US$) | $1.82 | $2.06 | $2.30 | $2.56 | $2.87 |
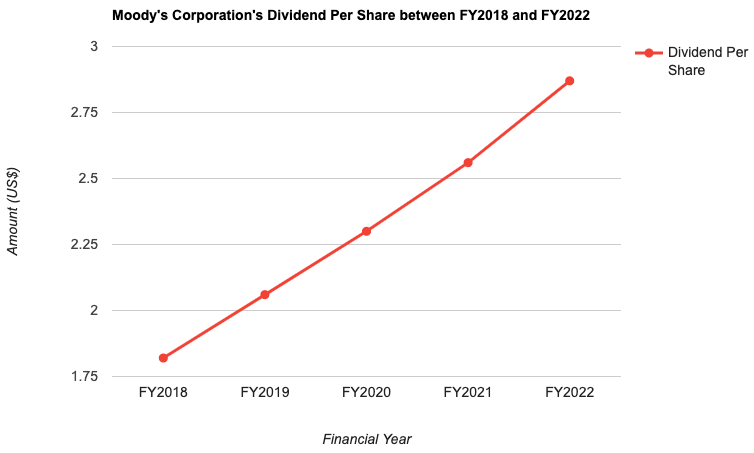
Moody’s Corporation’s dividend saw improvements every single year over the last 5 years, and recorded a good CAGR of 9.5%.
Is Moody’s Corporation’s Current Traded Price Considered to be ‘Cheap’ or ‘Expensive’?
At the time of writing this article (11 January 2024), Moody’s Corporation is trading at US$376.59.
The table below is a comparison of the company’s current valuation (based on its current traded price), against its 5-year average:
| Current | 5-Year Average | |
| P/S Ratio | 12.0 | 9.3 |
| P/B Ratio | 21.4 | 42.5 |
| Dividend Yield** | 0.8%** | 0.9% |
Looking at the above, it seems that the current traded price of Moody’s Corporation is on the ‘expensive’ side – as its current Price-to-Sales (P/S) ratio is higher than its 5-year average (12.0 currently vs. 9.3 on average), coupled with current dividend yield being slightly lower than it 5-year average (0.8% currently vs. 0.9% on average).
For those of you who are wondering what is the ‘fair value’ of Moody’s Corporation, based on my computation from its valuations recorded over the last 5 years, it is at US$308.40. Hence, the company’s current traded price is trading at a 22% premium.
Closing Thoughts
Every company have their fair share of pros and cons – and the same can also be said for Moody’s Corporation.
To summarise, here are some of the pros – a stable growth in terms of its total revenue and net profit, and also its dividend payout over the last 5 years.
Some of the ‘not so ideal’ areas to note about the company include its fluctuating net profit margin growth, steadily declining return on equity (even though it has been maintained at way above my minimum requirement of 15% over the years), and also the fact that the company is in a net debt position over the entire 5 year period I have looked at (that said, its current ratio has been maintained at above 1.0, implying it is able to fulfil any short-term debt obligations if required).
Finally, the current traded price of Moody’s Corporation is trading at a 22% premium when compared against its fair value of US$308.40 (which I have computed based on its 5-year average valuations).
With that, I have come to the end of my review of Moody’s Corporation. I hope the information presented above have given you a good understanding of the US-listed company. At the same time, do note that everything you have just read about above are purely for educational purposes only, and you are strongly advised to do your own due diligence before you make any investment decisions.
Disclaimer: At the time of writing, I am not a shareholder of Moody’s Corporation.
Stop Spending Hours Reading REIT Reports Every Quarter!
What if you could assess a REIT's portfolio occupancy, debt profile, valuation, and overall health in less than 30 seconds - without having to comb through a single quarterly report?
That's the problem the REIT Screener was built to solve.
Developed through a collaboration between ShareInvestor and The Singaporean Investor, the REIT Screener consolidates many of the key metrics and indicators I personally use when analysing REITs into one easy-to-use platform. Instead of spending hours extracting data manually every earnings season, you can now monitor the REITs you own and research new opportunities in just a few clicks.
If you're serious about REIT investing but don't have the time to manually track quarterly developments, the REIT Screener could be the shortcut you've been looking for:

Take a closer look at the REIT Screener here...


Comments (0)