After my post about The Coca-Cola Company Inc. (NYSE:KO) a couple of months back (you can check out the post here), many have asked me to check out the PepsiCo Inc. (NASDAQ:PEP) as sell, citing its business performance is superior compared to The Coca-Cola Company Inc.

While PepsiCo Inc. is also listed in the United States, but it’s a company we are all familiar with, for its namesake beverage (i.e. Pepsi).
But do you know that the company’s product portfolio has more than just Pepsi? Under beverages, some of the other products under PepsiCo Inc.’s portfolio include Mountain Dew, Gatorade, Mug Root Beer, Starbucks Frappuccino (the glass bottle version where you can find in any supermarket), and Lipton.
Apart from beverages, they also produce snacks, with brands including Lay’s, Doritos, Ruffles, Cheetos, among others – all of which can be found in Singapore’s supermarkets as well.
Now that you have a better understanding of PepsiCo Inc.’s business, in the rest of this article, let us take a look at its historical financial performances, debt profile, and also its dividend payout to shareholders over the years (you will find statistics posted between FY2015 and FY2022 – a total of 8 years; the company has a financial year ending on the last Saturday of December), and also whether at its current traded price, is PepsiCo considered ‘cheap’ or ‘expensive’.
Let’s begin…
Financial Performance
In this section, let us take a look at some of the key financial figures of PepsiCo Inc. reported over the last 8 years – including its total revenue and net profit, gross and net profit margin, and return on equity:
Total Revenue & Net Profit (US$’mil):
| FY2015 | FY2016 | FY2017 | FY2018 | |
| Total Revenue (US$’mil) | $63,056m | $62,799m | $63,525m | $64,661m |
| Net Profit (US$’mil) | $5,452m | $6,329m | $4,857m | $12,515m |
| FY2019 | FY2020 | FY2021 | FY2022 | |
| Total Revenue (US$’mil) | $67,161m | $70,372m | $79,474m | $86,392m |
| Net Profit (US$’mil) | $7,314m | $7,120m | $7,618m | $8,910m |

My Observations: The NASDAQ-listed company’s total revenue saw stable growth over the years (by a single digit percentage), where it only suffered a slight dip (of just 0.4%) in FY2016 – over a 8-year period, it recorded a compound annual growth rate (CAGR) of 4.0%.
Its net profit however saw year-on-year (y-o-y) declines in 3 out of 8 years, as follows:
FY2017: By 23.3%, due to a provisional net tax expense as a result of the TCJ Act in 2017 and partially offset by the prior-year charge related to the transaction with Tingyi, a pension-related settlement charge and the debt redemption charge;
FY2019: By 41.6%, as a result of a decrease in operating profit in its Quaker Foods North America business segment (where it declined by 15% compared to last year, due to operating cost increases, a 5-percentage point impact on higher commodity costs, and higher advertising and marketing expenses), PepsiCo Beverages North America (where it fell by 4% compared to last year, due to operating cost increases, higher advertising and market expenses, an 8-percentage point impact of higher commodity costs and volume decline), and Asia Pacific, Australia and New Zealand, and China Region (where it declined by 23% compared to last year, primarily reflecting a 23-percentage point impact of gain on the prior-year re-franchising of a portion of its beverage business in Thailand, together with increase in operating cost and higher advertising and marketing expenses.)
FY2020: By 2.7%, due to a drop in operating profit in PepsiCo Beverages North America (which fell by 11% compared to last year, due to increase in operating cost, including incremental IT costs, a 14-percentage point impact of changes taken as a result of the Covid-19 pandemic and organic volume decrease), Latin America (where it declined by 10% compared to last year, due to operating cost increase, and a 9-percentage point impact of higher commodity costs due to transaction-related foreign exchange), as well as in Africa, Middle East, and South Asia (which declined by 11% compared to last year, due to operating cost increase).
Despite of that, over a 8-year period, PepsiCo Inc.’s net profit still manage to record a CAGR of 6.3% – pretty stable growth regardless.
Gross & Net Profit Margins:
| FY2015 | FY2016 | FY2017 | FY2018 | |
| Gross Profit Margin (%) | 54.4% | 55.1% | 54.7% | 54.6% |
| Net Profit Margin (%) | 8.6% | 10.1% | 7.6% | 19.4% |
| FY2019 | FY2020 | FY2021 | FY2022 | |
| Gross Profit Margin (%) | 55.1% | 54.8% | 53.3% | 53.0% |
| Net Profit Margin (%) | 10.9% | 10.1% | 9.6% | 10.3% |

My Observations: While PepsiCo Inc.’s gross profit margin have been maintained at around the 50% range over the last 8 years (which is good to note), but in recent years (between FY2019 and FY2022), it has slid from 55.1% to 53.0%.
As for its net profit margin, while it have fluctuated in the earlier years, but since FY2019, it has stabilised at around 10%.
Return on Equity:
Expressed in percentage-terms, Return on Equity (or RoE for short) is a measure of the amount of profits a company was able to generate for every dollar of shareholders’ money it uses in its business.
My preference is towards companies that are able to maintain this at above 15.0% over the year.
In the table below, you will find the Return of Equity of PepsiCo Inc. over the last 8 years which I have computed:
| FY2015 | FY2016 | FY2017 | FY2018 | |
| Return on Equity (%) | 45.2% | 56.3% | 44.0% | 86.2% |
| FY2019 | FY2020 | FY2021 | FY2022 | |
| Return on Equity (%) | 49.5% | 52.9% | 47.5% | 52.0% |
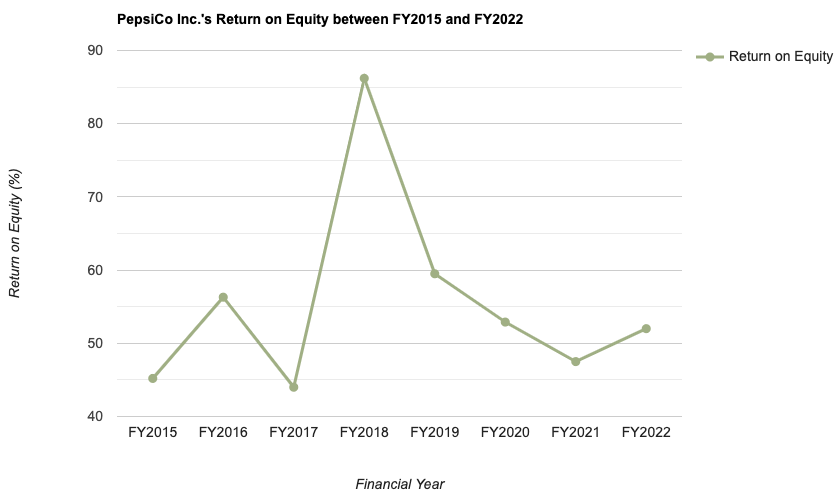
My Observations: Even though PepsiCo Inc.’s RoE have fluctuated over the year, but it has been maintained at the range of between 40+% to 50%. Also, at such a percentage, it has also met my selection criteria (of above 15.0% over the years.)
Debt Profile
When it comes to selecting companies to add to my long-term investment portfolio, my preference is towards those that have minimum or no debt (of course the latter preferred).
Hence, did PepsiCo Inc.’s debt profile over the years meet this requirement of mine? Let us have a look in the table below:
| FY2015 | FY2016 | FY2017 | FY2018 | |
| Cash & Cash Equivalent (US$’mil) | $9,096m | $9,169m | $10,657m | $10,769m |
| Total Borrowings (US$’mil) | $33,284m | $36,945m | $39,281m | $32,321m |
| Net Cash/ Debt (US$’mil) | -$24,188m | -$27,776m | -$28,624m | -$21,552m |
| FY2019 | FY2020 | FY2021 | FY2022 | |
| Cash & Cash Equivalent (US$’mil) | $5,570m | $8,254m | $5,707m | $5,100m |
| Total Borrowings (US$’mil) | $32,068m | $44,150m | $40,334m | $39,071m |
| Net Cash/ Debt (US$’mil) | -$26,498m | -$35,896m | -$34,627m | -$33,971m |

My Observations: Over the last 8 years, PepsiCo Inc. is in a net debt position – a negative in my opinion.
However, in recent years (between FY2020 and FY2022), there seem to be a slight improvement on this front – a slight positive.
Dividend Payout to Shareholders
The management of PepsiCo Inc. pays out a dividend to its shareholders on a quarterly basis – however, if you are a Singaporean investing in a US-listed company, do note that all dividend payouts are subject to a 30.0% withholding tax (hence, the dividend payout you eventually receive is 30.0% lesser than the amount declared.)
In the table below, you will find PepsiCo Inc.’s dividend payouts over the years:
| FY2015 | FY2016 | FY2017 | FY2018 | |
| Dividend Per Share (US$/share) | $2.76 | $2.96 | $3.17 | $3.59 |
| FY2019 | FY2020 | FY2021 | FY2022 | |
| Dividend Per Share (US$/share) | $3.79 | $4.02 | $4.25 | $4.53 |

My Observations: PepsiCo Inc.’s dividend payout have increased by a single digit percentage in all but 1 year (in FY2018, where its dividend payout increased by 13.3%) – which is good to note.
Over the last 8-years, its dividend payout have grown at a CAGR of 6.4% – in-line with the 8-year CAGR of its net profit (which was at 6.3%).
Is the Current Traded Price of PepsiCo Inc. Considered ‘Cheap’ or ‘Expensive’?
As at market close on 01 November 2023, the share price of PepsiCo Inc. us at US$164.87, and the table below is a comparison of the company’s current valuation vs. its 8-year average:
| Current | 8-Year Average | |
| P/S Ratio | 2.6 | 1.8 |
| P/B Ratio | 11.6 | 9.1 |
| Dividend Yield | 2.7% | 2.8% |
My Observations: As its current price-to-sales (P/S Ratio) and price-to-book (P/B Ratio) ratios are higher than its 8-year average, and its current dividend yield lower than its 8-year average at the same time, the current share price of PepsiCo Inc. is deemed to be trading at a ‘premium’.
Closing Thoughts
Some of the things I like about PepsiCo Inc., after studying its performance over the last 8 years, include its stable total revenue and net profit, along with its return on equity. Its dividend payout to shareholders have also increased every single year in the same time period (but do take note that if you are a Singaporean investing in a US-listed company, all dividend payouts are subjected to a 30.0% withholding tax).
On the other hand, some slight negatives include a decline in its gross profit margin in recent years (from 55.1% in FY2019 to 53.0% in FY2022), and also the company being in a net debt position throughout the entire 8-year period I have looked at.
Finally, PepsiCo Inc.’s current share price (of US$164.87 as at market close on 01 November 2023) is considered to be on the ‘expensive’ side, due to its current P/S and P/B ratios being higher than its 8-year average, and at the same time, its current dividend yield being lower than its 8-year average.
With that, I have come to the end of PepsiCo Inc. I hope the post above have given you a much better understanding of the NASDAQ-listed company. However, do take note that everything you have just read about in this post is purely for educational purposes only. They do not represent any buy or sell calls for the company’s shares. You should always do your own due diligence before you make any investment decisions.
Disclaimer: At the time of writing, I am not a shareholder of PepsiCo Inc.
Stop Spending Hours Reading REIT Reports Every Quarter!
What if you could assess a REIT's portfolio occupancy, debt profile, valuation, and overall health in less than 30 seconds - without having to comb through a single quarterly report?
That's the problem the REIT Screener was built to solve.
Developed through a collaboration between ShareInvestor and The Singaporean Investor, the REIT Screener consolidates many of the key metrics and indicators I personally use when analysing REITs into one easy-to-use platform. Instead of spending hours extracting data manually every earnings season, you can now monitor the REITs you own and research new opportunities in just a few clicks.
If you're serious about REIT investing but don't have the time to manually track quarterly developments, the REIT Screener could be the shortcut you've been looking for:

Take a closer look at the REIT Screener here...


Comments (0)