Some of you may not have heard about the US-listed online dating company Match Group Inc. (NASDAQ:MTCH), nor its namesake online dating platform ‘Match’ before, but I’m pretty sure you should have heard of the following online dating platforms before (all of them are also owned by Match Group Inc.):
- Tinder – Launched in 2012, the platform has more than 5.9 million average subscribers as at the end of the fourth quarter of FY2019
- Meetic – A leading European online dating brand based in Europe, launched in the year 2001
- OkCupid – The platform has a loyal, highly educated user base predominantly located in major cities in the United States as well as in the United Kingdom. It also has an increasing presence in other global markets such as India
- Hinge – Acquired by Match Group Inc. in December 2018, it is a popular app particularly among the millennial and younger generations in the United States as well as in the United Kingdom
- Pairs – Launched in 2012, it is a leading provider of dating products in Japan, along with having a presence in Taiwan and South Korea
- PlentyOfFish – The platform has a broad appeal in the central United States, Canada, the United Kingdom, as well as in a number of international markets
- OurTime – It has the largest community of singles over the age of 50. The online dating platform is offered in the United States, as well as in a number of European markets
All of the company’s online dating sites allow users to sign up, create a profile, as well as view other members’ profile without any charges. Apart from that, there are also a number of additional features – some free, and some paid (and this is where the company generates its revenue from, as well as from advertisements.)
Does the online dating company make a good addition to one’s investment portfolio? To find out the answer to this question, let us take a look at its financial performance, debt profile, along with dividend payouts to its shareholders over the years (as the company was only listed in 18 November 2015, in this post, I will only be looking at its historical statistics between FY2016 and FY2019), along with its performance so far this year (compared to the same time period last year.) Last but not least, you will also learn about my personal thoughts about the company’s reported statistics to share.
Let’s get started…
Match Group Inc.’s Historical Financial Performance between FY2016 and FY2019
The online dating company has a financial year end every 31 December.
In this section, let us take a look at some of the key financial statistics recorded over the past 4 years, including its revenue, net profit, gross and net profit margin, as well as its return on equity:
Revenue and Net Profit (USD’mil):
| FY2016 | FY2017 | FY2018 | FY2019 | |
| Total Revenue (USD’mil) | $1,118m | $1,331m | $1,730m | $2,051m |
| Net Profit (USD’mil) | $171m | $350m | $478m | $535m |
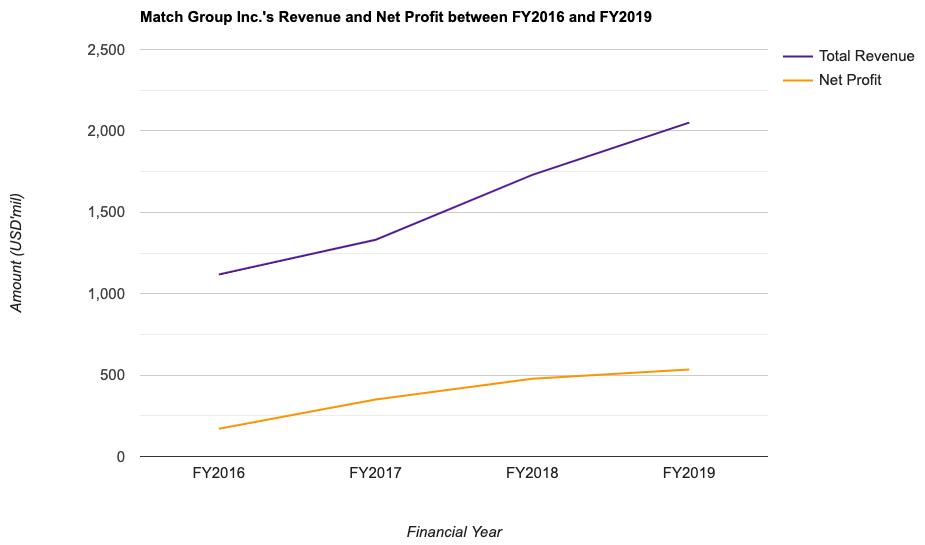
As you can see from the table and chart above, since post-IPO, Match Group Inc.’s top- and bottom-line have recorded improvements every single year – with the former having a compound annual growth rate (CAGR) of 16.4%, and the latter having a CAGR of 33.0%.
Gross and Net Profit Margin (%):
The following table is Match Group Inc.’s gross and net profit margin I’ve computed:
| FY2016 | FY2017 | FY2018 | FY2019 | |
| Gross Profit Margin (%) | 82.5% | 79.0% | 76.3% | 74.3% |
| Net Profit Margin (%) | 15.3% | 26.3% | 27.6% | 26.1% |

Over the past 4 years, the company’s gross profit margin have been on a slow downward decline. Despite of that however, at 70+%, in my opinion, it is still at a comfortable level (and no cause for concern just yet.)
Its net profit margin have, on the other hand, managed to remain at a stable level of around 26+% and 27+%. In the years ahead, if it starts to display a downward decline (just like its gross profit margin, I will be concerned.)
Return on Equity (%):
Finally, let us take a look at the company’s return on equity, or RoE for short – in layman terms, it is a measure of profitability (in percentage terms) the company is able to make for every single dollar of shareholders’ money it uses in its businesses. Personally, I would regard any RoE of 15.0% and above as ideal.
With that, let us take a look at Match Group Inc.’s RoE recorded between FY2016 and FY2019 which I’ve calculated:
| FY2016 | FY2017 | FY2018 | FY2019 | |
| Return on Equity (%) | 34.4% | 69.9% | 379.4% | 167.2% |

Even though its RoE have fluctuated over the years, it has been maintained at a level way higher than my ideal level of 15.0%.
Match Group Inc.’s Debt Profile between FY2016 and FY2019
When I study a company, apart from its financial results, I will also look at its debt profile – my preference is towards companies with little or no borrowings, along with one that is in a net cash position over the years.
Does Match Group Inc.’s debt profile over the past 4 years (between FY2016 and FY2019) satisfy this preference of mine? Let us find out in the table below:
| FY2016 | FY2017 | FY2018 | FY2019 | |
| Cash & Cash Equivalents as at the End of Period (USD’mil) | $254m | $273m | $187m | $466m |
| Total Borrowings (USD’mil) | $1,176m | $1,253m | $1,516m | $1,603m |
| Net Cash/ Debt (USD’mil) | -$922m | -$980m | -$1,329m | -$1,137m |
| Current Ratio | 1.6 | 1.4 | 1.0 | 1.6 |
My Thoughts: Even though its cash and cash equivalents have recorded improvements in 3 out of the 4 years I have looked at (the only exception was in FY2018), its total borrowings have also recorded a steady rise in the same time period. As such, the company is in a net debt position in all of the 4 years I have looked at.
Despite of that, the company have managed to maintain its current ratio at above 1.0 in all of the 4 years I have looked at – which means it is able to fulfil its short-term debt obligations.
Dividend Payout by Match Group Inc. between FY2016 and FY2019
Since the company’s listing, it had only paid out a special dividend of USD2.00/share in FY2018.
A Look at Match Group Inc.’s Current Year Results (Compared to the Same Time Period Last Year)
In this section, let us take a look at the online dating company’s current year results so far (i.e. for the first 9 months of FY2020 ended 30 September 2020), compared against its financial results recorded in the same time period last year (i.e. for the first 9 months of FY2019 ended 30 September 2019) to find out if it has improved or deteriorated:
| 9M FY2019 | 9M FY2020 | % Variance | |
| Total Revenue (USD’mil) | $1,504m | $1,740m | +15.7% |
| Net Profit (USD’mil) | $365m | $358m | -1.9% |
| Gross Profit Margin (%) | 74.4% | 73.4% | -1.0pp |
| Net Profit Margin (%) | 24.3% | 20.6% | -3.7pp |
| Cash & Cash Equivalents as at the End of Period (USD’mil) | $2,948m | $399m | -86.5% |
| Total Borrowings (USD’mil) | $1,603m | $3,521m | >100.0% |
| Net Cash/ Debt (USD’mil) | $1,345m | -$3,122m | N.M. |
The current year so far has been a weaker one in general (compared to the same time period last year.) The only bright spot was its total revenue, which saw a 15.7% year-on-year (y-o-y) improvement.
Its net profit saw a 1.9% y-o-y decline (which can be attributed to a huge 46.4% quarter-on-quarter slump in its net profit in the second quarter of the year ended 30 June 2020.) At the same time, its gross and net profit margin also weakened on a y-o-y basis, along with the company sinking deeper into a net debt position as at 30 September 2020.
Is Match Group Inc.’s Current Share Price Considered Cheap or Expensive?
At the time of writing, the share price of Match Group Inc. was trading at US$148.81. Question: Is the share price considered cheap or expensive?
I’ve captured the consensus estimate of the company’s share price, along with ratings over the years, from ShareInvestor’s WebPro platform, and you can find it in the screenshot below:

Comparing the company’s current traded price of US$148.81 against its mean target price of US$145.22, its current share price is 2.5% above the mean target price, meaning it is considered to be on the ‘expensive’ side.
In Conclusion
While the company’s top- and bottom-line growth since post-IPO have captured my attention (and hence my decision to study the company in more detail), I am a bit concerned by the increase in its total borrowings, and also the fact that it has sunk deeper into a net debt position over the same time period. As such, I will be continuing to monitor its debt profile very closely in the quarters ahead.
With that, I have come to the end of my company analysis of Match Group Inc. I hope you have found the share useful and last but not least, a disclaimer that everything you have just read in this post (along with my opinions) are purely for educational purposes and they do not represent any buy or sell recommendations for the shares of the company. Please do your own due diligence before you make any investment decisions.
Disclaimer: At the time of writing, I am not a shareholder of Match Group Inc.
Stop Spending Hours Reading REIT Reports Every Quarter!
What if you could assess a REIT's portfolio occupancy, debt profile, valuation, and overall health in less than 30 seconds - without having to comb through a single quarterly report?
That's the problem the REIT Screener was built to solve.
Developed through a collaboration between ShareInvestor and The Singaporean Investor, the REIT Screener consolidates many of the key metrics and indicators I personally use when analysing REITs into one easy-to-use platform. Instead of spending hours extracting data manually every earnings season, you can now monitor the REITs you own and research new opportunities in just a few clicks.
If you're serious about REIT investing but don't have the time to manually track quarterly developments, the REIT Screener could be the shortcut you've been looking for:

Take a closer look at the REIT Screener here...


Comments (0)