Brief Overview:
Suntec REIT (SGX: T82U) invests primarily in commercial properties across Singapore, Australia, and the United Kingdom. Its Singapore portfolio is concentrated in prime locations within the Central Business District (CBD), while its overseas properties are located in Adelaide, Melbourne, Sydney, and London.
In Singapore, its portfolio comprises Suntec City, a 66.3% interest in Suntec Singapore Convention & Exhibition Centre, as well as a one-third interest in One Raffles Quay, Marina Bay Financial Centre Towers 1 and 2, and Marina Bay Link Mall.
In Australia, Suntec REIT wholly owns 177 Pacific Highway and 21 Harris Street in Sydney, as well as 55 Currie Street in Adelaide. It also holds a 50% interest in Southgate Complex and Olderfleet, 477 Collins Street, both located in Melbourne.
Over in the United Kingdom, Suntec REIT’s portfolio comprises a 100% interest in The Minster Building and a 50% interest in Nova Properties, both located in London.
Financial Figures (3Q FY2025 vs. 3Q FY2026):
| 3Q FY2025 | 3Q FY2026 | % Variance | |
| Gross Revenue (S$’mil) | $117.5m | $123.6m | +5.2% |
| Property Operating Expenses (S$’mil) | $39.0m | $40.2m | +3.1% |
| Net Property Income (S$’mil) | $78.5m | $83.4m | +6.2% |
| Distributable Income to Unitholders (S$’mil) | $52.4m | $59.9m | +14.3% |
Suntec REIT delivered a steady set of financial results in the third quarter, with gross revenue and net property income recording mid-single-digit growth, while distributable income to unitholders rose by a double-digit percentage.
Gross revenue and net property income increased by 5.2% and 6.2% year on year to S$123.6 million and S$83.4 million respectively. This was driven by stronger operating performances across its Singapore office and retail portfolios, the commencement of backfilled leases at 177 Pacific Highway, and higher contributions from Olderfleet, 477 Collins Street, following an improvement in occupancy. These gains were partially offset by a lower contribution from 21 Harris Street due to weaker occupancy.
Supported by higher net property income, lower financing costs, and the reversal of an Australian withholding tax provision, Suntec REIT’s distributable income to unitholders climbed 14.3% year on year to S$59.9 million.
Financial Figures (9M FY2025 vs. 9M FY2026):
Suntec REIT did not disclose its financial figures for the first nine months of FY2026 on a year-on-year comparative basis. The following figures have therefore been compiled using the financial results for the first half and the third quarter of the respective financial years.
| 9M FY2025 | 9M FY2026 | % Variance | |
| Gross Revenue (S$’mil) | $352.0m | $362.5m | +3.0% |
| Property Operating Expenses (S$’mil) | $114.0m | $120.1m | +5.4% |
| Net Property Income (S$’mil) | $238.0m | $242.4m | +1.8% |
| Distributable Income to Unitholders (S$’mil) | $145.2m | $176.4m | +21.5% |
Supported by steady growth in gross revenue and net property income over the past two quarters, Suntec REIT recorded year-on-year increases of 3.0% and 1.8% in these respective metrics for the first nine months of FY2026, reaching S$362.5 million and S$242.4 million.
Meanwhile, higher net property income, lower financing costs, and the reversal of an Australian withholding tax provision contributed to a 25.5% year-on-year jump in distributable income to unitholders to S$116.5 million for 9M FY2026.
Portfolio Occupancy Profile (2Q FY2026 vs. 3Q FY2026):
| 2Q FY2026 | 3Q FY2026 | Difference (in Percentage Points – pp) | |
| Singapore (Retail) | 99.5% | 98.6% | -0.9pp |
| Singapore (Office) | 99.5% | 99.6% | +0.1pp |
| Australia (Office & Retail) | 90.1% | 89.3% | -0.8pp |
| United Kingdom (Office) | 92.5% | 92.5% | – |
Suntec REIT’s portfolio occupancy rates delivered mixed results across its geographical markets in 3Q FY2026. While its Singapore office properties recorded a slight improvement in occupancy, its Singapore retail properties and Australian portfolio experienced modest declines.
The 0.9-percentage-point decline in occupancy across its Singapore retail properties was primarily attributable to lower occupancy at Suntec City Mall, which fell from 99.6% in 2Q FY2026 to 98.6% in 3Q FY2026.
Meanwhile, occupancy across its Singapore office properties edged up by 0.1 percentage point, supported by improvements at One Raffles Quay, from 99.1% to 99.3%, and MBFC Towers 1 & 2, from 98.7% to 99.1%.
In Australia, portfolio occupancy declined by 0.8 percentage point, mainly due to a drop in occupancy at 21 Harris Street, from 100% in 2Q FY2026 to 91.5% in 3Q FY2026.
On a more positive note, rental reversions for new and renewed leases signed in 3Q FY2026 remained positive across all three segments, coming in at +4.4% for Suntec City Office, +11.0% for One Raffles Quay and MBFC Towers 1 & 2, and +11.2% for Suntec City Mall. These positive rental reversions should help support Suntec REIT’s financial performance in the coming quarters.
Debt Profile (2Q FY2026 vs. 3Q FY2026):
| 2Q FY2026 | 3Q FY2026 | |
| Aggregate Leverage (%) | 43.0% | 43.0% |
| Interest Coverage Ratio (times) | 2.2x | 2.3x |
| Average Term to Debt Maturity (years) | 2.1 years | 2.1 years |
| Average Cost of Debt (%) | 3.55% | 3.57% |
| % of Borrowings Hedged at Fixed Rates (%) | ~57% | ~57% |
Suntec REIT’s debt profile remained largely unchanged compared to the previous quarter.
The key areas to watch are its relatively high aggregate leverage of 43.0% and the fact that only 57% of its borrowings are hedged at fixed interest rates.
With a relatively low proportion of fixed-rate borrowings, the REIT remains exposed to potential increases in interest rates. The US Federal Reserve’s 0.25% rate hike in September 2026 to curb rising inflation driven by higher oil prices, alongside expectations of further hikes, could lead to higher financing costs in the coming quarters.
This may, in turn, put pressure on the REIT’s ability to sustain growth in its distribution payout to unitholders.
Distribution Payout to Unitholders (3Q FY2025 vs. 3Q FY2026):
Suntec REIT remains one of the few Singapore-listed REITs that continues to reward its unitholders with distributions on a quarterly basis.
The table below compares the distribution declared for the quarter under review against the corresponding period a year ago:
| 3Q FY2025 | 3Q FY2026 | % Variance | |
| Distribution Per Unit (S$’cents) | 1.778 cents | 2.017 cents | +13.4% |
Since 1Q FY2025, Suntec REIT has consistently recorded year-on-year growth in its distribution payouts, and the latest quarter was no exception.
The improvement this time round was driven by stronger operating performances across its Singapore office and retail portfolios, lower financing costs, and the reversal of an Australian withholding tax provision.
For unitholders, do take note of the following key dates for Suntec REIT’s upcoming distribution payout:
Ex-Date: 29 October 2026
Record Date: 30 October 2026
Payout Date: 27 November 2026
Distribution Payout to Unitholders (9M FY2025 vs. 9M FY2026):
Together with the 1.936 cents/unit distribution declared in the 1st quarter (up 23.9% year-on-year) and 2.000 cents/unit in the 2nd quarter (up 25.6% year-on-year), Suntec REIT’s total distribution payout for 9M FY2026 comes in at 5.953 cents/unit.
The following table compares its 9M FY2026 distribution payout against that recorded in the corresponding period a year ago:
| 9M FY2025 | 9M FY2026 | % Variance | |
| Distribution Per Unit (S$’cents) | 4.933 cents | 5.953 cents | +20.7% |
CEO Mr Chong Kee Hiong’s Comments & Outlook (from the REIT’s Press Release):
“The results reflect Suntec REIT’s sound fundamentals, underpinned by our portfolio of high-quality assets and resilient income streams. We remain focused on optimising our portfolio, strengthening our balance sheet and enhancing long-term returns for our unitholders.”
Closing Thoughts:
Overall, Suntec REIT delivered another resilient set of results, with its financial figures for both 3Q FY2026 and the first nine months of FY2026 recording steady growth. This was largely driven by improved contributions from its Singapore office and retail properties. Together with lower financing costs and the reversal of an Australian withholding tax provision, these factors supported a double-digit increase in the REIT’s distribution payout. Notably, Suntec REIT has continued to record year-on-year growth in its distribution payout to unitholders since 1Q FY2025.
Occupancy rates across most of its properties remained healthy at above 90%, with the exceptions being Southgate Complex (88.4%), 55 Currie Street (61.1%) and The Minster Building (85.4%). In addition, rental reversions for new and renewed leases remained positive, ranging from +4.4% for Suntec City Office to +11.2% for Suntec City Mall. These positive rental reversions should help support further improvements in the REIT’s financial performance over the coming quarters.
Finally, while Suntec REIT’s debt profile remained largely unchanged from the previous quarter, I remain concerned about its relatively high aggregate leverage of 43.0% and the fact that 43% of its borrowings remain exposed to floating interest rates. Following the US Federal Reserve’s 0.25% rate hike in September 2026, with further hikes being forecast, the REIT could face higher borrowing costs in the coming quarters. This could put pressure on the continued growth of its distribution payouts to unitholders, making its debt profile and financing costs key areas I will continue to monitor.
Related Documents:
Press Release
Presentation Slides
Disclaimer: At the time of writing, I am a unitholder of Suntec REIT.
Join Me for a FREE Live Online Chit-Chat on Thursday, 12 November, from 8–9pm (SGT)!

It's been quite some time since I last had a live chit-chat with the investing community, and I’m excited to be back for another session! A big thank you to my friend, Dinah Poehlmann from Your Finance Mind, for inviting me once again!
This time, we’re taking a little break from REITs and exploring some interesting topics surrounding investing, including my go-to investing resources, when is a stock considered 'investable', my thoughts about using AI for stock analysis and trading, and much more.
Whether you're just starting your investing journey or have been investing for years, I hope this session will offer some useful perspectives and practical takeaways that you can apply to your own investing journey.
Best of all, the session is completely FREE to attend! All you need to do is register in advance to receive the Zoom link:
👉 Click here to reserve your spot!
Stop Spending Hours Reading REIT Reports Every Quarter!
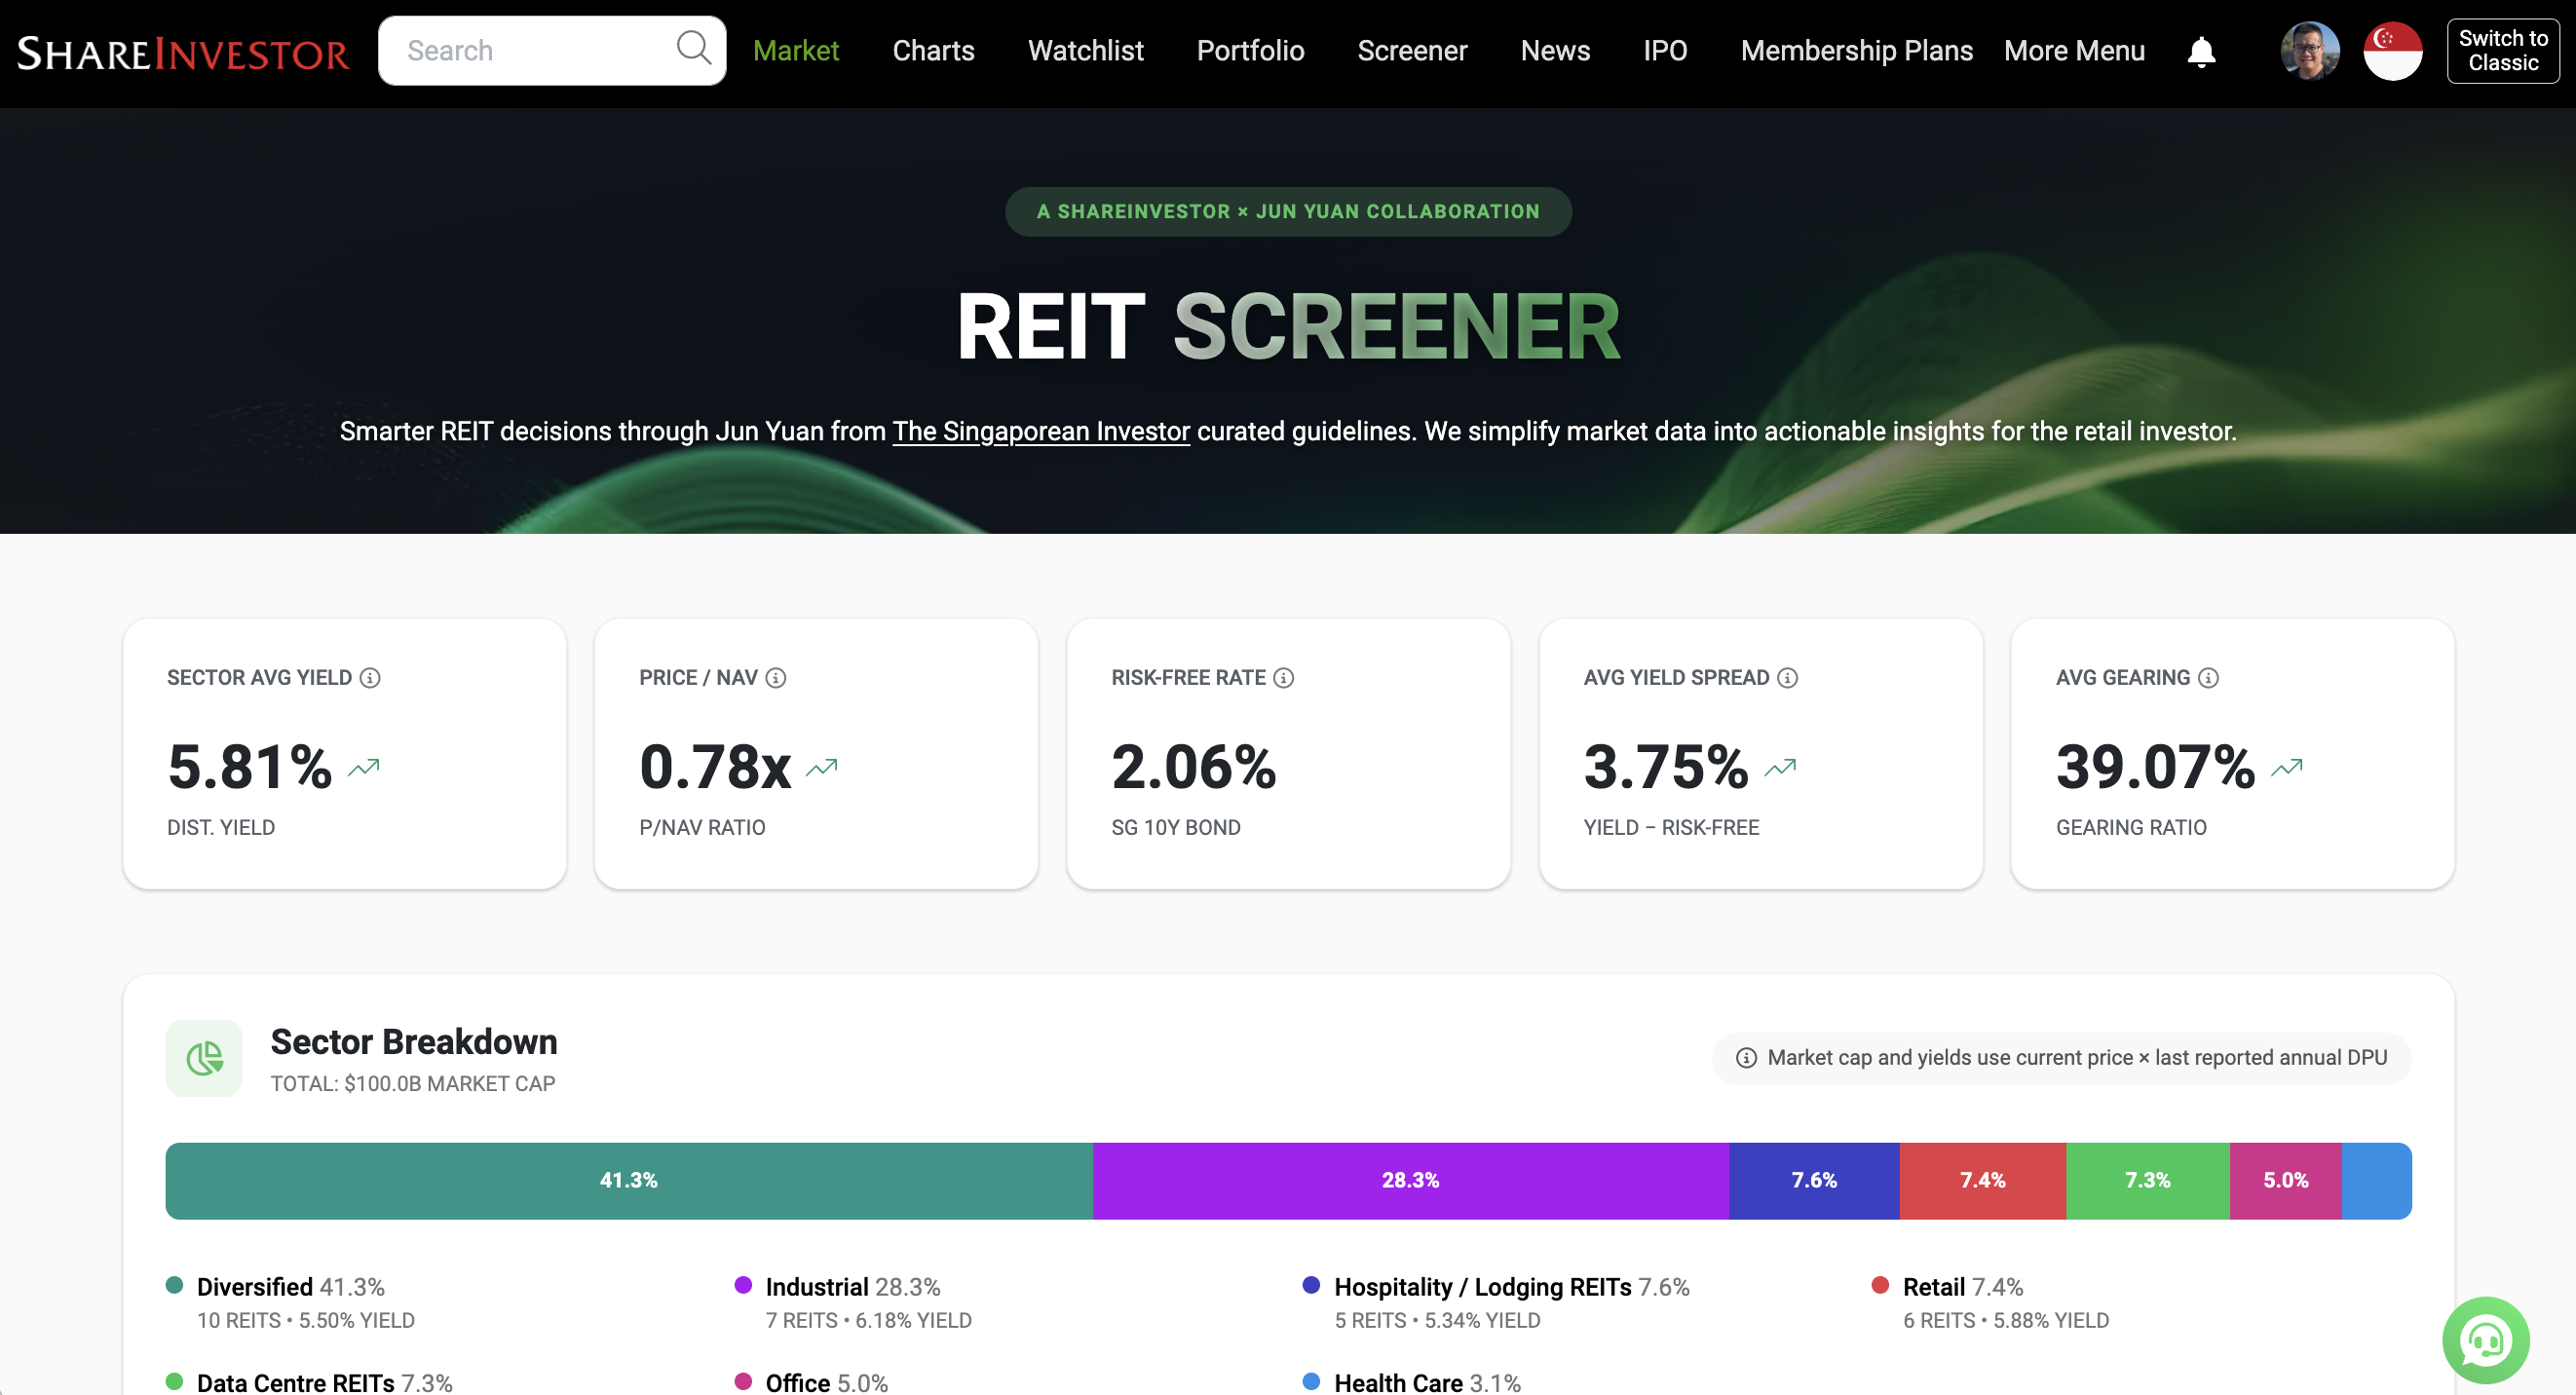
What if you could assess a REIT's portfolio occupancy, debt profile, valuation, and overall health in less than 30 seconds - without having to comb through a single quarterly report?
That's the problem the REIT Screener was built to solve.
Developed through a collaboration between ShareInvestor and The Singaporean Investor, the REIT Screener consolidates many of the key metrics and indicators I personally use when analysing REITs into one easy-to-use platform. Instead of spending hours extracting data manually every earnings season, you can now monitor the REITs you own and research new opportunities in just a few clicks.
If you're serious about REIT investing but don't have the time to manually track quarterly developments, the REIT Screener could be the shortcut you've been looking for:
Take a closer look at the REIT Screener here...



Comments (0)