The 3 Singapore-listed banks have saw their share prices recovering sharply since a year ago, when the ongoing Covid-19 pandemic saw the share prices of many companies plummeting to multi-year lows.
When the market closed yesterday (on 03 March 2021), DBS closed at $27.48 (which is just a whisker away from the 52-week high at $27.53 attained during the day itself), UOB closed at $25.34 (2 cents away from its 52-week high at $25.36 attained during the day itself as well), and OCBC closed at $11.25 (which is its current 52-week high.)
Having said that, one big question that’s probably on your mind is, “are there still further upsides for the 3 Singapore banks in terms of their share price movements?”
While there are no definite ‘yes’ or ‘no’ answer to this question, but what we can do here is to take a look at their recent share price movements, and make use of technical analysis to find out how their share prices might possibly move in the near-term – which is what I’m going to share with you today – my technical analysis of how the share prices of DBS, UOB, as well as OCBC may possibly move in the near-term, along with some key prices to take note of.
Before I begin, let me lay out the technical analysis indicators I’ve used:
- Moving averages on a weekly timeframe – 20 day (in dark green), 50 day (in light green), 100 day (in orange), 150 day (in yellow), and 200 day (in red)
- Bollinger Band on a weekly timeframe, with the upper and lower bands in light blue
- Moving Average Convergence Divergence (MACD) on a daily timeframe
- Stochastic on a daily timeframe
DBS (SGX:D05)

Currently, the share price of Singapore’s biggest bank is on an upward moving trend. In terms of upside, there certainly remains some, as both technical indicators MACD and stochastic are in an uptrend position. In my personal opinion, the bank’s share price could potentially move up to where the upper band of the Bollinger Band is, at $28.62 (I’ve highlighted where it is in the chart above.)
That said, however, we need to be mindful of the fact that stochastic is in an overbought position (as it is above the purple area.) As such, we might see some retracement back down as well, especially if the broad market sentiments weakens. The most immediate support line is where MA20 is, at around $24.76 – this support line is a strong one, as you can see how the share price of the bank bounced back up when it touches this support line (I’ve pointed out where they are with the black up arrows in the chart above.)
UOB (SGX:U11)

Similar to DBS, the share price movements of UOB is also in an uptrend, with technical indicators MACD and stochastic in an uptrend position as well. In the near-term, if the upward movement were to continue, it could potentially reach $25.89, where the upper band of the Bollinger Band is (I’ve highlighted where it is in the chart above.)
Also, just like DBS, the stochastic for UOB is also in an overbought position, suggesting that the share price could also reverse – and if it does, then it could potentially fall to around the $24.33 and $24.58 range (where MA100 and MA200 is respectively) before bouncing back up, if the uptrend is still intact. Otherwise, the share price could further retreat to around $23.39, where MA100 on a weekly timeframe is. In my opinion, this is a strong support line, as share prices tend to bounce back up whenever it touches this line – denoted by black up arrows in the chart above.
OCBC (SGX:O39)
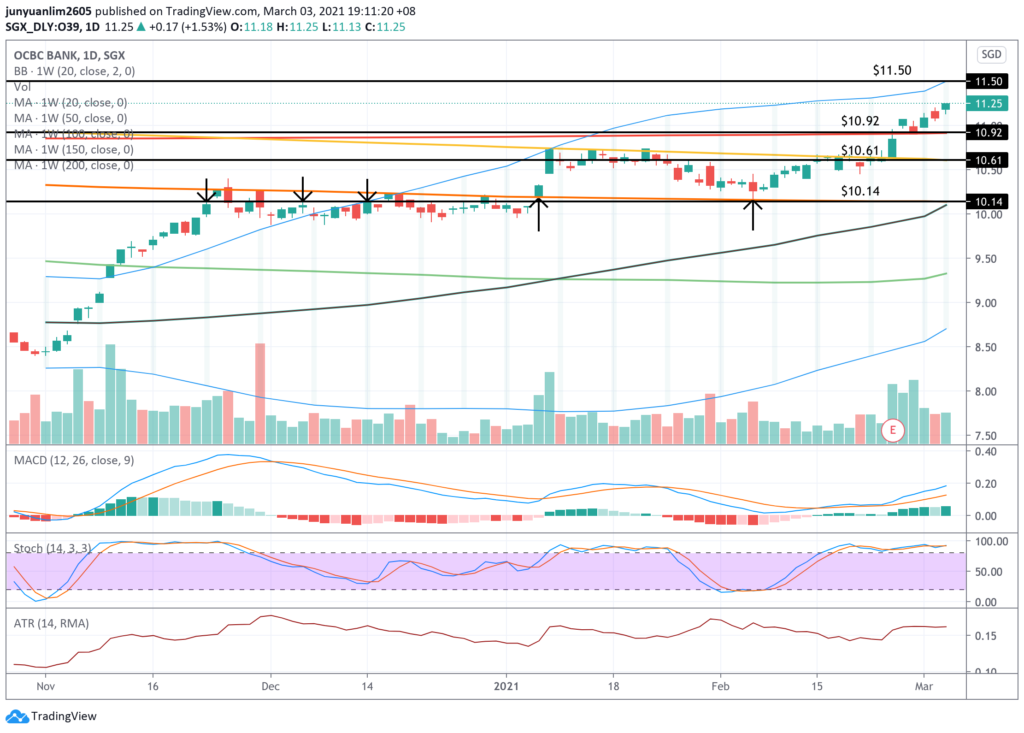
With DBS and UOB’s share prices on an upward moving trend, no surprise there that the share price movement of OCBC is also moving in the same direction. In terms of the technical indicators, both MACD as well as stochastic are also in an uptrend position.
Looking at the moving averages and Bollinger Bands in the chart above, the share price of OCBC could potentially reach the upper band of the Bollinger Band at around $11.50 in the near-term should the uptrend continue to remain intact.
However, as the stochastic is already in an overbought position, there’s also a possibility that its share price may retrace – and when it happens, its share price could potentially go down to where MA200 is, at $10.92. From there, it could either bounce back up, or if it breaks below this line, then it could potentially go down to where MA100 is at $10.61, or even down to $10.14 – this is a major support line (look at how the bank’s share prices bounced back up when it touches this line, denoted by the black up arrows above) / resistance line (notice how the share price tried to break above this price point back in December 2020, denoted by the black down arrows.)
In Conclusion
Looking at how the share prices of the 3 Singapore-listed banks have been moving of late, it certainly is in an uptrend, and my technical analysis of the share price movements suggests that there are further upside to its upward movement. At the same time, as the stochastic of all 3 banks are in overbought position, there is also a possibility that their share prices may retrace – I’ve highlighted some of the price points you can take note of (both in the bull case scenario, as well as in the bear case scenario.)
With that, I have come to the end of my post today on the technical analysis of the 3 Singapore banks’ share price movements, along with how they may potentially move in the near-term. Before I end, a disclaimer to take note of – everything you have read about in this post is purely for educational purposes only. They do not represent any buy or sell calls for the shares of DBS, UOB, and OCBC. As always, please do your own due diligence before you commit to any investing or trading decisions.
Disclaimer: At the time of writing, I am a shareholder of DBS Group Holdings Limited, United Overseas Bank Limited, and Overseas-Chinese Banking Corporation Limited.
REITs vs Banks: Which Investment Delivers More for Income Seekers?

If you thought 2025 was a wild ride for the stock market, wait until you see 2026! With not only the uncertainty of interest rate changes and geopolitical tensions but also a military operation by Israel and the United States against Iran, it's set to be even more turbulent.
So, with all this in mind, which is the better choice for income investors: REITs or banks?
I'm honoured to be re-invited by Dinah Poehlmann from Your Finance Mind for a fireside chat on Zoom this year, where I'll be sharing my insights on this topic.
Join me on Thursday, 19 March 2026, from 8pm to 9pm, as I offer my thoughts and answer any questions you may have.
Best part? Registration is completely free! Secure your spot now through the link below:
👉 Sign Up Now and Mark Your Calendars
Are You Worried about Not Having Enough Money for Retirement?
You're not alone. According to the OCBC Financial Wellness Index, only 62% of people in their 20s and 56% of people in their 30s are confident that they will have enough money to retire.
But there is still time to take action. One way to ensure that you have a comfortable retirement is to invest in real estate investment trusts (REITs).
In 'Building Your REIT-irement Portfolio' which I've authored, you will learn everything you need to know to build a successful REIT investment portfolio, including a list of 9 things to look at to determine whether a REIT is worthy of your investment, 1 simple method to help you maximise your returns from your REIT investment, 4 signs of 'red flags' to look out for and what you can do as a shareholder, and more!

You can find out more about the book, and grab your copy (ebook or physical book) here...


Comments (2)