As a retail investor, one of the things I do on a regular basis is to actively look for possible investment opportunities. When it comes to selecting a company to invest my money in, some of the criteria include a steadily improving set of financial results, minimal debt levels, and preferably, one that pays out dividends (and a growing one) on a regular basis.
Today, I would like to share with you researches I have done on this NYSE-listed company called Stanley Black & Decker Inc. (NYSE:SWK) – this company should not sound too ‘alien’ to you, considering its electric hand tools (like drills and screwdriver), as well as portable vacuum cleaners are readily available in DIY shops all across the island.
But what you may not be aware of is that the company’s business involves more than just retailing consumer products. In fact, its operations can be classified into 3 reportable business segments, and they are:
(i) Tools and Storage, where products include hand drills, power tools, as well as storage solutions catered for professionals and consumers. Stanley Black & Decker is the worldwide leader in this business segment. In FY2019, this business segment contributed 70% towards the company’s total revenues.
(ii) Industrial, which ranges from preferred engineered fastening solutions in the automotive and industrial channels to infrastructure solutions such as pipeline construction and hydraulic tools. This business segment contributed 17% towards the company’s total revenues in FY2019.
(iii) Security, where the company primarily sells automatic doors to its commercial customers. This business segment contributed 13% towards the company’s total revenues in FY2019.
Next, in terms of Stanley Black & Decker’s revenue contribution by geographical locations in FY2019, a lion’s share came from the United States of America (at 59%), followed by Europe (at 20%), Emerging Markets (at 13%), and finally Canada (at 4%.)
Now that you have a better understanding about the company’s businesses and where it derives its revenues from, in the rest of today’s post, you will read more about its historical financial performances, debt profile, along with its dividend payout to shareholders between FY2015 and FY2020 (the company has a financial year-end on the Saturday closest to 31 December.)
Let’s begin…
Financial Performance between FY2015 and FY2020
In this section, let us take an in-depth look at Stanley Black & Decker’s financial performance over the past 6 financial years – between FY2015 and FY2020:
Total Revenue & Net Profit (US$’mil):
| FY2015 | FY2016 | FY2017 | FY2018 | |
| Total Revenue (US$’mil) | $11,172m | $11,594m | $12,967m | $13,982m |
| Net Profit (US$’mil) | $884m | $968m | $1,227m | $605m |
| FY2019 | FY2020 | |||
| Total Revenue (US$’mil) | $14,442m | $14,535m | ||
| Net Profit (US$’mil) | $956m | $1,210m |
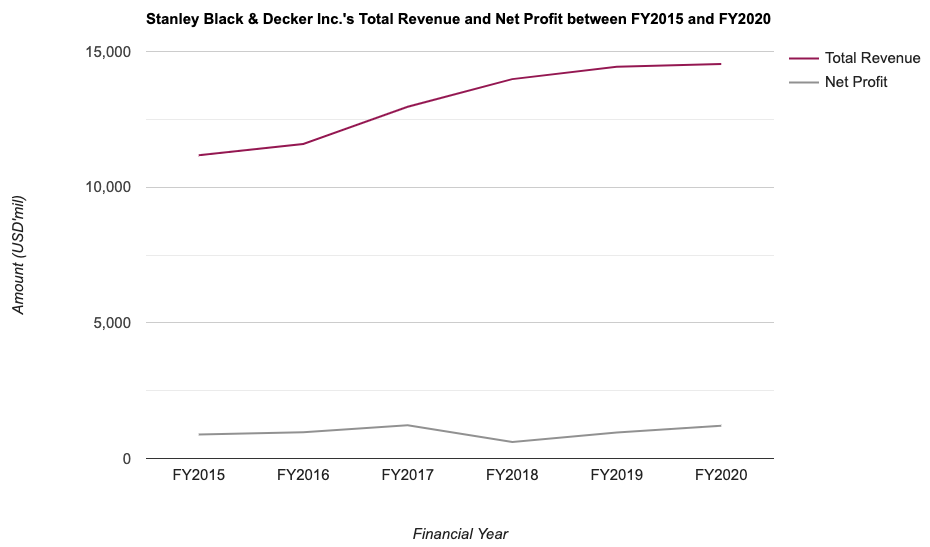
The company have recorded improvements in its total revenue every single year over the past 6 financial years – from US$11,172m in FY2015 to US$14,535m in FY2020, a compound annual growth rate (or CAGR) of 4.5% over a 6 year period.
For its net profit, other than in FY2018 (which saw a huge 50.7% plunge compared to the previous year due to one-time tax expenses related to the acquisition of Nelson Fastener Systems), the other 5 years saw year-on-year (y-o-y) improvements. Over a 6-year period, its net profit grew at a CAGR of 5.4%.
Gross & Net Profit Margins (%):
The following table is Stanley Black & Decker’s gross and net profit margins over the past 6 financial years which I’ve computed:
| FY2015 | FY2016 | FY2017 | FY2018 | |
| Gross Profit Margin (%) | 63.6% | 63.2% | 63.1% | 65.3% |
| Net Profit Margin (%) | 7.9% | 8.3% | 9.5% | 4.3% |
| FY2019 | FY2020 | |||
| Gross Profit Margin (%) | 66.7% | 65.8% | ||
| Net Profit Margin (%) | 6.6% | 8.3% |
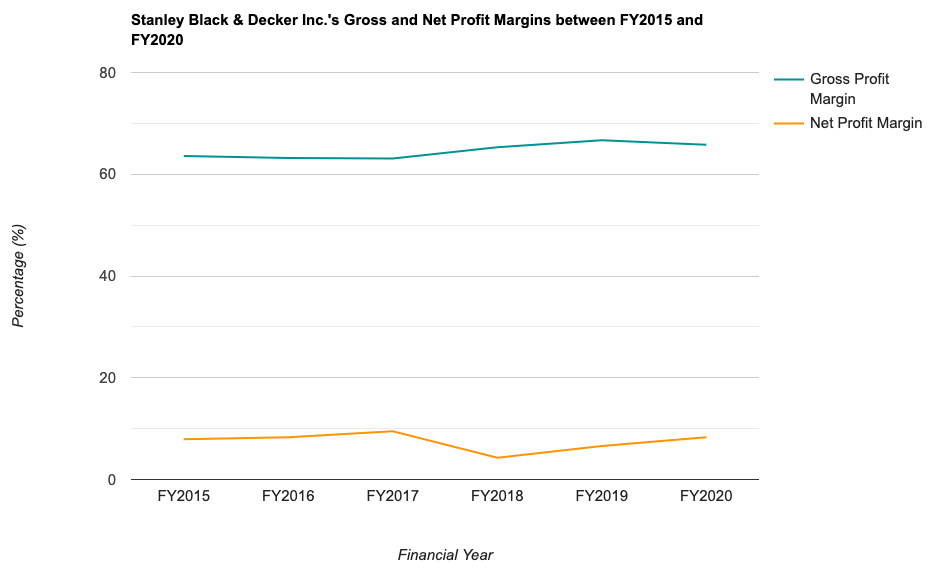
Over the 6-year period I have looked at, the company’s gross profit margin have somewhat remained stable at around 60+%.
Looking at its net profit margin, other than a drop in FY2018 (in-line with the decline in its net profit), all the other years saw an improvement compared to the year before. Overall, its net profit margin have been steadily on the rise.
Return on Equity (%):
Return on Equity, or RoE for short, refers to the amount of profits (in percentage terms) the company was able to generate for every dollar of shareholders’ money it uses in its businesses. My preference is to invest in companies that are able to keep its RoE consistent at above 15.0%.
So, did Stanley Black & Decker’s RoE over a 6-year period meet this criteria of mine? Let us find out in the table below:
| FY2015 | FY2016 | FY2017 | FY2018 | |
| Return on Equity (%) | 15.2% | 15.2% | 14.8% | 7.7% |
| FY2019 | FY2020 | |||
| Return on Equity (%) | 10.5% | 10.9% |

From a high of 15.2% in FY2015 and FY2016, the company’s RoE saw a downward decline to a low of 7.7% in FY2018 before recovering again in the subsequent years.
Debt Profile between FY2015 and FY2020
As I have shared in the beginning of this post, one of my criteria for selecting a company to invest in is that the company should have minimal or no debt.
In this section, let us take a look at Stanley Black & Decker’s debt profile over the past 6 financial years (between FY2015 and FY2020) I have compiled in the table below:
| FY2015 | FY2016 | FY2017 | FY2018 | |
| Cash & Cash Equivalents at the End of Period (US$’mil) | $465m | $1,177m | $655m | $311m |
| Total Borrowings (US$’mil) | $3,800m | $3,827m | $3,811m | $4,198m |
| Net Cash/Debt (US$’mil) | -$3,334m | -$2,650m | -$3,156m | -$3,887m |
| FY2019 | FY2020 | |||
| Cash & Cash Equivalents at the End of Period (US$’mil) | $315m | $1,398m | ||
| Total Borrowings (US$’mil) | $3,517m | $4,247m | ||
| Net Cash/Debt (US$’mil) | -$3,202m | -$2,849m |
If there is one thing I do not quite like about the company, it would be its debt profile, where its cash and cash equivalents have fluctuated over the years, its total borrowings have been on the rise in the same time period, and also the fact that the company is in a net debt position in all the 6 financial years I have looked at.
Since the company’s total borrowings have increased over the years, the next question I have is whether or not it is able to fulfil its short-term debt obligations – for this, I will look at its current ratio, where a ratio of 1.0 and above means that the company is able to fulfil its short-term debt obligations:
| FY2015 | FY2016 | FY2017 | FY2018 | |
| Current Ratio | 1.3 | 1.7 | 1.0 | 1.1 |
| FY2019 | FY2020 | |||
| Current Ratio | 1.0 | 1.3 |
From the table above, its current ratio have stayed at 1.0 and above in all the 6 financial years I have looked at, suggesting that it is able to fulfil its short-term debt commitments.
Dividend Payout to Shareholders between FY2015 and FY2020
The management of Stanley Black & Decker declares a dividend payout to its shareholders on a quarterly basis. However, do take note that if you are a Singaporean investing in a US-listed company, all dividends received are subjected to a 30.0% withholding tax (meaning the payout you eventually receive will be 30.0% lesser than what was declared by the company.)
With that, the following table is Stanley Black & Decker’s dividend payout to its shareholders over the past 6 year period (between FY2015 and FY2020), along with its payout ratios which I have computed:
| FY2015 | FY2016 | FY2017 | FY2018 | |
| Dividend Per Share (USD) | $2.17 | $2.29 | $2.47 | $2.61 |
| Dividend Payout Ratio (%) | 37.5% | 35.1% | 30.7% | 65.4% |
| FY2019 | FY2020 | |||
| Dividend Per Share (USD) | $2.73 | $2.79 | ||
| Dividend Payout Ratio (%) | 43.0% | 35.9% |
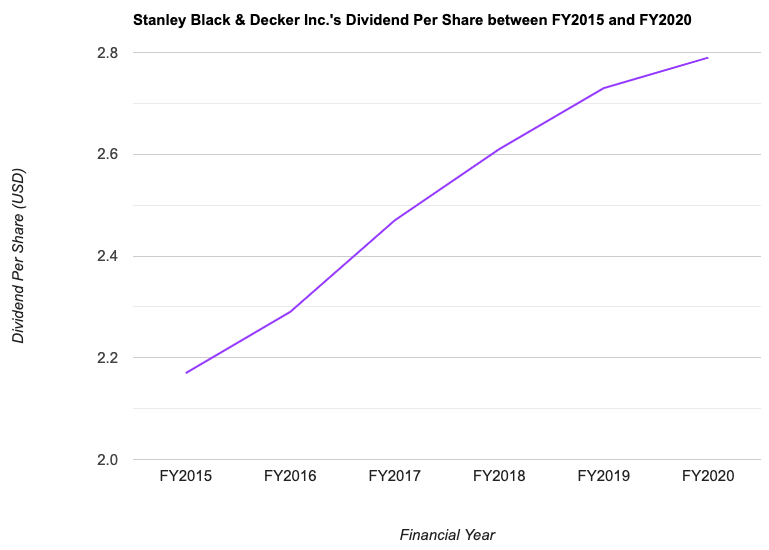
The company’s dividend payout have went up every single year over the last 6 years, and more importantly, it have grown at a CAGR of 4.3%.
From its dividend payout ratio, in 4 out of 6 years, its payout has been kept at under 40.0%, suggesting that the company may have a policy in distributing 40.0% of its earnings back to its shareholders as dividends, while retaining the remaining 60.0% for its business operations.
Is the Current Price of Stanley Black & Decker Considered ‘Cheap’ or ‘Expensive’?
One of the easiest ways I use to determine whether or not the current share price of a company is considered cheap or expensive is to take its current valuations (based on its current share price), and compare against its historical valuations over the years.
The following is Stanley Black & Decker’s historical valuations I’ve computed:
| FY2015 | FY2016 | FY2017 | FY2018 | |
| P/E Ratio | 18.4 | 17.6 | 21.1 | 29.8 |
| P/B Ratio | 2.8 | 2.7 | 3.1 | 2.3 |
| Dividend Yield | 2.0% | 2.0% | 1.5% | 2.2% |
| FY2019 | FY2020 | Average | ||
| P/E Ratio | 26.1 | 23.0 | 22.7 | |
| P/B Ratio | 2.8 | 2.6 | 2.7 | |
| Dividend Yield | 1.6% | 1.6% | 1.8% |
At the time of writing, the share price of the company was trading at US$185.47, and as such, its current valuations are as follows (taken from the ShareInvestor WebPro platform):
P/E Ratio: 24.7
P/B Ratio: 3.1
Dividend Yield: 1.5% (calculated based on a total dividend payout of US$2.79 in FY2020)
Comparing its current valuations against its 6-year average, the current traded price of Stanley Black & Decker seems to be slight on the ‘expensive’ side, due to its slightly higher than average current P/E and P/B ratios, along with a slightly lower than average current dividend yield.
In Conclusion
A steadily growing top- and bottom-line, along with improving dividend payouts declared by the company’s management to its shareholders every single year over the past 6 years, are reasons why I fancy the company. While its results for FY2020 were negatively affected in the first and second quarter, but it has recovered strongly in the third and fourth quarter – the recovery was so strong such that on a y-o-y basis, its results recorded improvements (compared to the previous FY2019.)
As mentioned earlier, if there’s one thing I don’t quite like about the company is its debt profile, where its total borrowings have been on the rise, along with it being in a net debt position in all of the 6 financial years I have looked at.
Finally, in terms of pricing, looking at its current vs. its 6-year historical valuations, it seems that the current traded price is a bit on the ‘expensive’ side. That said, all the above you have just read is solely my own opinion, which I am sharing for educational purposes only. They certainly do not represent any recommendations to buy or sell shares of the company. Please do your own due diligence before you make any investment decisions.
Disclaimer: At the time of writing, I am not a shareholder of Stanley Black & Decker Inc.
Stop Spending Hours Reading REIT Reports Every Quarter!
What if you could assess a REIT's portfolio occupancy, debt profile, valuation, and overall health in less than 30 seconds - without having to comb through a single quarterly report?
That's the problem the REIT Screener was built to solve.
Developed through a collaboration between ShareInvestor and The Singaporean Investor, the REIT Screener consolidates many of the key metrics and indicators I personally use when analysing REITs into one easy-to-use platform. Instead of spending hours extracting data manually every earnings season, you can now monitor the REITs you own and research new opportunities in just a few clicks.
If you're serious about REIT investing but don't have the time to manually track quarterly developments, the REIT Screener could be the shortcut you've been looking for:

Take a closer look at the REIT Screener here...


Comments (0)