With my investment in UOB (SGX:U11) on 06 March 2020 at my intended entry price of S$23.26 (based on this entry price, and a dividend payout of S$1.30/share in FY2019, my dividend yield is 5.6%), I now have all 3 Singapore banks, plus another financial institution in Hong Leong Finance (SGX:S41) in my long-term investment portfolio.
In my post today, I would like to share with you reasons why I’ve invested in the bank…
Brief Introduction to United Overseas Bank
Before I talk about the bank’s historical financial performance, along with its dividend payouts to shareholders over the years, let me first a quick introduction about the bank.
Besides Singapore, UOB has more than 500 branches and offices in 19 countries (Australia, Brunei, Canada, China, France, Hong Kong, India, Indonesia, Japan, Malaysia, Myanmar, Philippines, Singapore, South Korea, Taiwan, Thailand, United Kingdom, United States of America, and Vietnam.)
Historical Financial Performance of UOB over the Past 10 Years
Before I put my hard-earned money into any company, I will need to make sure the company fulfils some criteria – one of which is an improving set of financial results reported by the company over the years.
In this section, I will be sharing some of the key financial statistics reported by UOB over a period of 10 years (between FY2010 and FY2019):
Net Interest Income, Net Fee & Commission Income, and Other Non-Interest Income:
UOB’s “Total Income” comprises of 3 business components – (i) Net Interest Income, (ii) Net Fee & Commission Income, and (iii) Other Non-Interest Income.
Let us now take a look at the performances of these 3 business components between FY2010 and FY2019:
| FY2010 | FY2011 | FY2012 | FY2013 | FY2014 | |
| Net Interest Income (S$’mil) | $3,532m | $3,678m | $3,917m | $4,120m | $4,558m |
| Net Fee & Commission Income (S$’mil) | $1,163m | $1,318m | $1,508m | $1,731m | $1,749m |
| Other Non-Interest Income (S$’mil) | $811m | $703m | $1,070m | $870m | $1,151m |
| FY2015 | FY2016 | FY2017 | FY2018 | FY2019 | |
| Net Interest Income (S$’mil) | $4,926m | $4,991m | $5,528m | $6,220m | $6,562m |
| Net Fee & Commission Income (S$’mil) | $1,883m | $1,931m | $1,873m | $1,967m | $2,032m |
| Other Non-Interest Income (S$’mil) | $1,238m | $1,140m | $1,162m | $930m | $1,435m |

UOB’s net interest income grew at a compound annual growth rate (CAGR) of 6.4% over a 10-year period, with improvements recorded every single year.
The bank’s net fee and commission income also recorded a pretty good set of results over the years, where it recorded year-on-year (y-o-y) improvements every year except for a slight dip in FY2017. Over a 10-year period, its net fee and commission income saw a CAGR of 5.8%.
Finally, its other non interest income saw y-o-y declines in 4 out of 10 years:
- FY2011: Due to lower trading and investment income as a result of weaker global market sentiments in the second half of the year
- FY2013: Due to lower gains from sale of securities as a result of market volatility amid concerns over US quantitative easing tapering
- FY2016: Due to lower gains from sale of investment securities
- FY2018: Due to unrealised mark-to-market on investment securities, and lower gains from sale of investment securities
Despite of that, over a period of 10-years, the bank’s other non-interest income still managed to grow at a CAGR of 5.9%.
My Thoughts: It’s improving sets of financial results over the years is one of the reasons why I’ve invested in the bank. While past statistics is by no means a guarantee for the future, but personally I am confident of the bank recording further growth in the years ahead.
Net Profit Attributable to Shareholders:
| FY2010 | FY2011 | FY2012 | FY2013 | FY2014 | |
| Net Profit Attributable to Shareholders (S$’mil) | $2,696m | $2,327m | $2,803m | $3,008m | $3,249m |
| FY2015 | FY2016 | FY2017 | FY2018 | FY2019 | |
| Net Profit Attributable to Shareholders (S$’mil) | $3,209m | $3,096m | $3,390m | $4,008m | $4,343m |

UOB’s net profit attributable to shareholders saw y-o-y declines in 3 out of 10 years:
- FY2011: Due to higher expenses, coupled with higher collective impairment charges set aside due to strong loans growth
- FY2015: Due to higher expenses, along with specific allowances set aside for loans mainly from non-performing accounts in Singapore, Indonesia, and Greater China
- FY2016: Due to higher expenses, and also an increase in specific allowances on loans from non-performing loans in oil and gas, as well as from the shipping industries
Despite of that, over a 10-year period, the bank’s net profit attributable to shareholders still managed to grow at a CAGR of 4.9%.
Return on Equity:
For those of you who are unfamiliar with what this is, in layman terms, a company’s Return on Equity, or RoE in short, is a measure (in percentage terms) of the amount of profit a company is able to generate for every dollar of shareholders’ money it uses.
Let’s say a company’s RoE in a particular year is 15.0%; this means that the company has generated a profit of $15 for every $100 of shareholders’ money it uses in its business.
The following table is UOB’s RoE over a 10-year period:
| FY2010 | FY2011 | FY2012 | FY2013 | FY2014 | |
| Return on Equity (%) | 14.3% | 11.1% | 12.4% | 12.3% | 12.3% |
| FY2015 | FY2016 | FY2017 | FY2018 | FY2019 | |
| Return on Equity (%) | 11.0% | 10.2% | 10.2% | 11.3% | 11.6% |
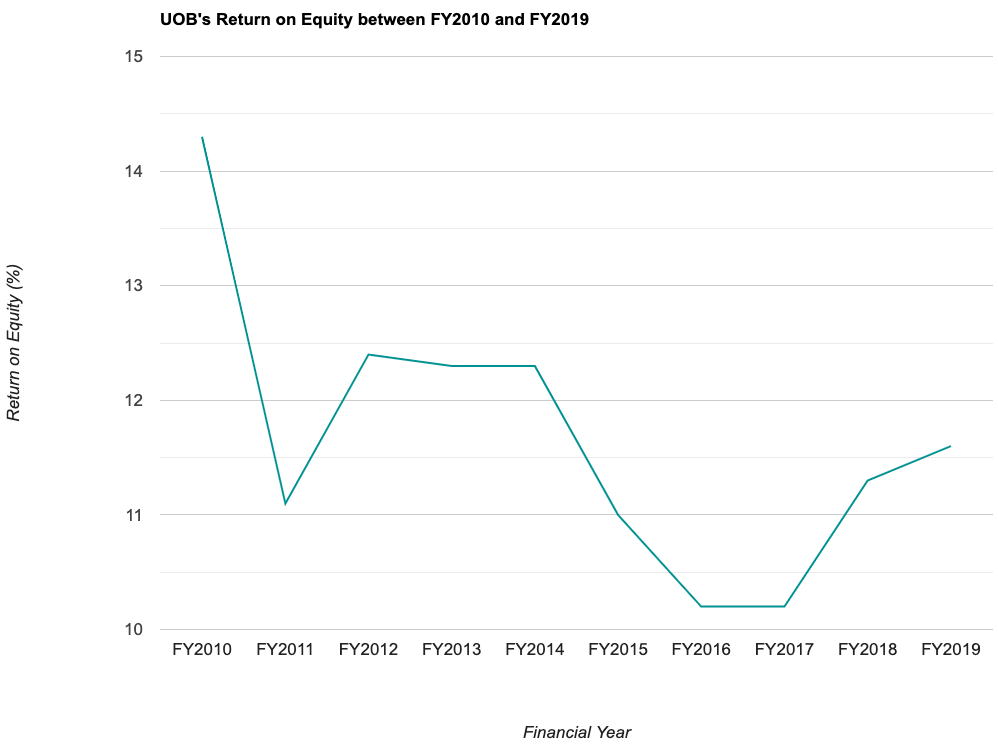
UOB’s RoE has saw a gradual slide between FY2012 and FY2017 (a period of 6 years) where it fell from 12.4% (in FY2012) to 10.2% (in FY2016 and FY2017.)
While its RoE gradually improved in FY2018 and FY2019, it is still lower than the high of 14.3% recorded in FY2010.
My Thoughts: While I am not expecting the bank’s RoE to improve in the year ahead due to headwinds relating to Covid-19 outbreak worldwide, but I will be concerned if its RoE were to fall below 10.0%.
UOB’s Dividend Payout to Shareholders over the Years
The management of UOB declares a dividend payout to shareholders on a half-yearly basis – once when they announce their second quarter results, and once when they announce their fourth quarter results.
In this section, let us have a look at UOB’s dividend payout to shareholders, along with its payment ratio, between FY2010 and FY2019:
| FY2010 | FY2011 | FY2012 | FY2013 | FY2014 | |
| Dividend Per Share (S$’cents) | 70.0 cents | 60.0 cents | 70.0 cents | 75.0 cents | 75.0 cents |
| Dividend Payout Ratio (%) | 46.1% | 42.3% | 40.9% | 40.8% | 38.1% |
| FY2015 | FY2016 | FY2017 | FY2018 | FY2019 | |
| Dividend Per Share (S$’cents) | 90.0 cents | 70.0 cents | 100.0 cents | 120.0 cents | 130.0 cents |
| Dividend Payout Ratio (%) | 46.6% | 37.8% | 50.5% | 51.5% | 51.2% |
Special dividends were declared in the following years:
- FY2010: 10.0 cents/share
- FY2013 & FY2014: 5.0 cents/share
- FY2015: 20.0 cents/share
If we were to strip out all special dividend payouts, then the bank’s dividend payout over the actually moves up in a straight line:

Looking at the bank’s dividend payout ratio over the years, they have been maintaining it at around 30+% and 40+% range between FY2010 and FY2016, before increasing their payout ratio to about 50.0% from FY2017.
My Thoughts: Personally, I feel the bank will have no problem in maintaining its 130.0 cents/share of dividend payout in the year ahead if it wants to. However, if they were to maintain their payout ratio at around 50.0%, then we may potentially see its dividend payout come down should the coming year’s financial results deteriorates significantly (due to headwinds relating to the Covid-19 outbreak globally.)
In Conclusion
Overall, I am satisfied with UOB’s performance over the past 10 years, which is why I’ve decided to invest in the bank, and intending to hold on to my shareholdings for the long-term.
I understand that since my investment in the bank on 06 March 2020, its share price have plunged by 17.9% from my initial buy price (at S$23.26) to S$19.09 at the time of writing. In case you are wondering if I will be averaging down, I am still in the midst of monitoring its share price movements for now, and I might do so when the share price drop stabilises (I will be making use of technical analysis to help me with my share price analysis.)
Finally, being a shareholder of the bank, I will be sharing summaries of its annual reports as and when they are published, along with summaries of their annual general meetings (if I am attending them), so do keep a lookout for them.
Disclaimer: At the time of writing, I am a shareholder of United Overseas Bank Limited.
Are You Worried about Not Having Enough Money for Retirement?
You're not alone. According to the OCBC Financial Wellness Index, only 62% of people in their 20s and 56% of people in their 30s are confident that they will have enough money to retire.
But there is still time to take action. One way to ensure that you have a comfortable retirement is to invest in real estate investment trusts (REITs).
In 'Building Your REIT-irement Portfolio' which I've authored, you will learn everything you need to know to build a successful REIT investment portfolio, including a list of 9 things to look at to determine whether a REIT is worthy of your investment, 1 simple method to help you maximise your returns from your REIT investment, 4 signs of 'red flags' to look out for and what you can do as a shareholder, and more!

You can find out more about the book, and grab your copy (ebook or physical book) here...


Comments (0)