Singapore’s Straits Times Index fell by 139.47 points (or another 5.52%) to close at 2,389.29 points when trading ended last Friday (03 April 2020.)
With a short trading week this week (due to the Good Friday public holiday on 10 April 2020), how will the Straits Times Index, and also each of the 30 companies in the index, possibly move over the next 4 trading days?
In today’s post, I’ll be sharing with you their weekly charts, and also my personal analysis of how may the share prices possibly move this week:
1. Straits Times Index
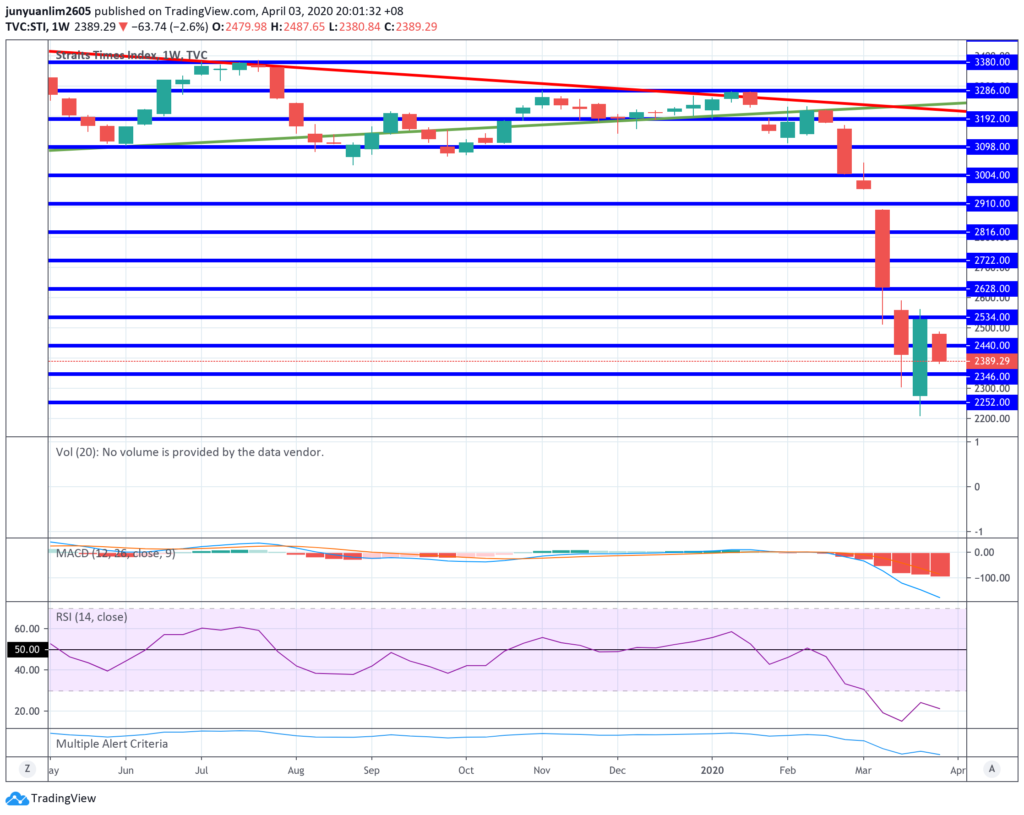
I mentioned in my post last week that, should the STI break above 2,560 points on Friday, we could see a bullish run ahead (in case you missed the post, you can check it out here.)
Unfortunately, the STI closed the week at 2,389 points, suggesting that the index is still in a bearish territory. In the week ahead, should the index be able to end the week above 2,560 points, then we may be seeing a rebound. Otherwise, we may see the index moving towards the support level 2,346 points should the bearish run were to continue.
2. Ascendas REIT (SGX:A17U)
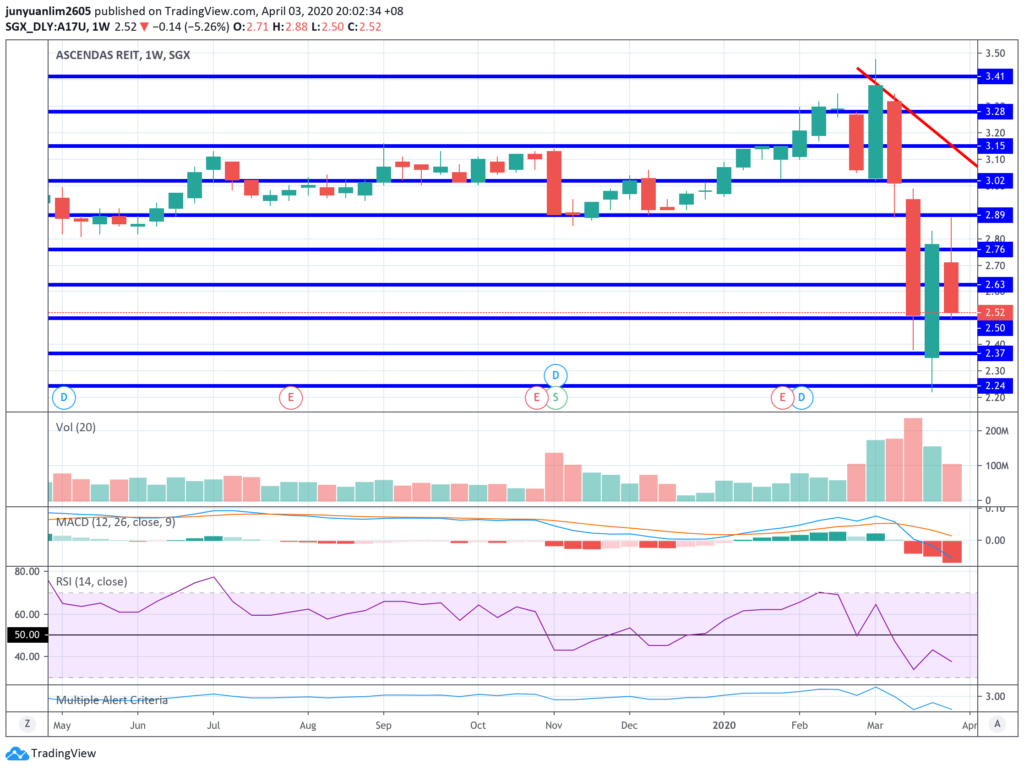
Looking at the most recent weekly candlestick, Ascendas REIT’s went up to the resistance line at S$2.89, before coming down again, where it broke under the support lines at S$2.76 and S$2.63, to finish the week at S$2.52 – just 2 cents away from the support line at S$2.50.
However, if you look at the trading volume, it has gradually come down for the past 3 weeks, suggesting that the bearish trend may have weakened. In the week ahead, the unit price could once again test the resistance line at S$2.63, and if the bullish trend is strong enough, it may even break above this line and up to the next resistance line at S$2.76; however, if the bearish run were to continue, it may test the S$2.50 support line once again, and if it breaks under this support line, its unit price may move to the next support line at S$2.37.
3. CapitaLand (SGX:C31)
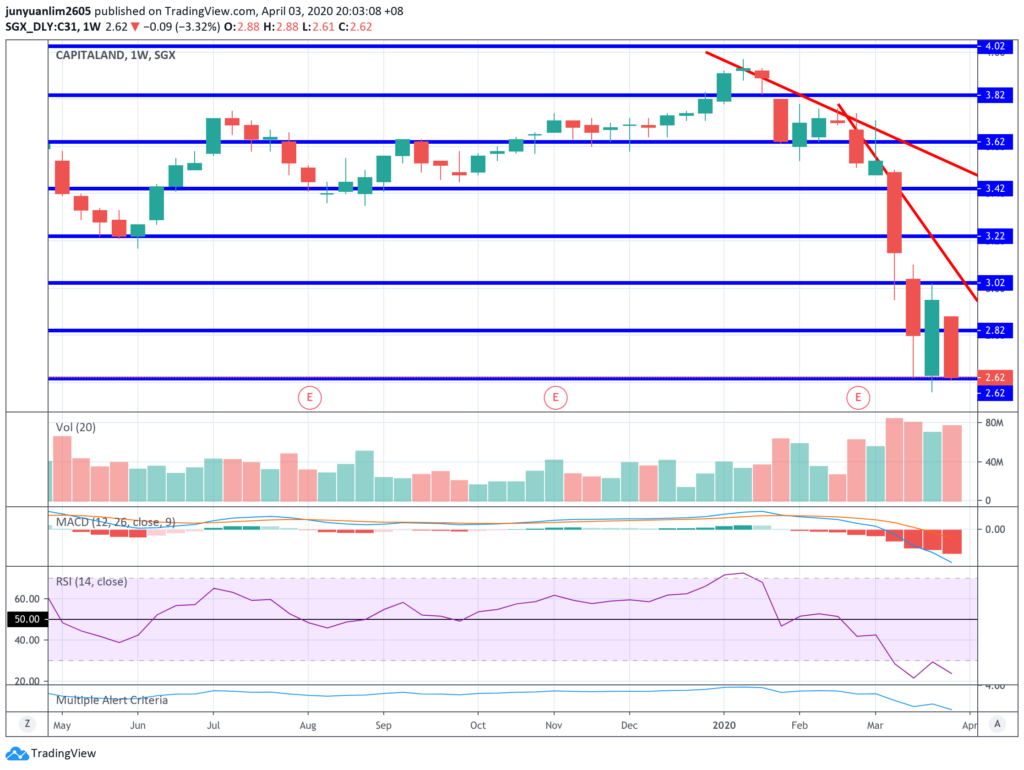
CapitaLand’s share price continue to fall last week, where it finished the week at the S$2.62 support line. As last week’s trading volume is higher compared to the week before, along with the fact that last week’s trading volume was also higher than average, it suggests that the share price may likely break under the S$2.62 support line and move towards the next support line at S$2.42 in the week ahead.
4. CapitaLand Commercial Trust (SGX:C61U)
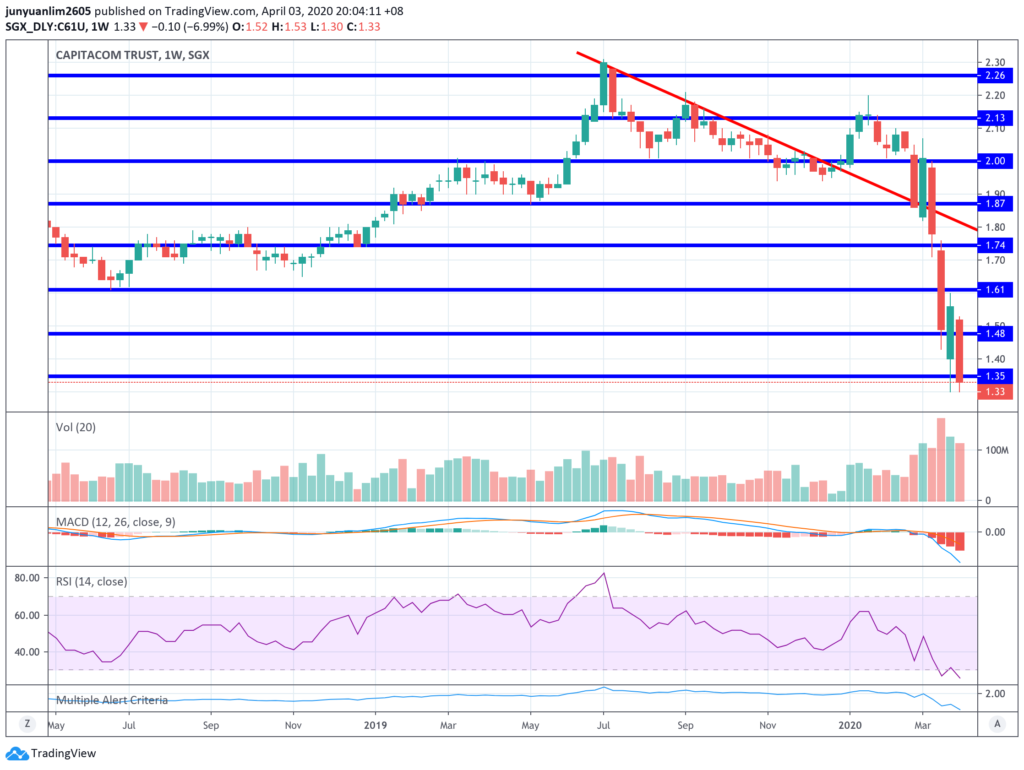
CapitaLand Commercial Trust’s unit price resumed its downward descend after some pullback the week before, where it fell by 23 cents (or 14.74%) last week to end the week at S$1.33.
Looking at the volume, however, it is lower than the week before, suggesting that the downward fall may have weakened. As such, in the week ahead, the unit price of this one may break above the support turned resistance line at S$1.35 towards the next resistance line at S$1.48. However, if the bearish run were to continue, its unit price could possibly move towards the next support line at S$1.22.
5. CapitaLand Mall Trust (SGX:C38U)
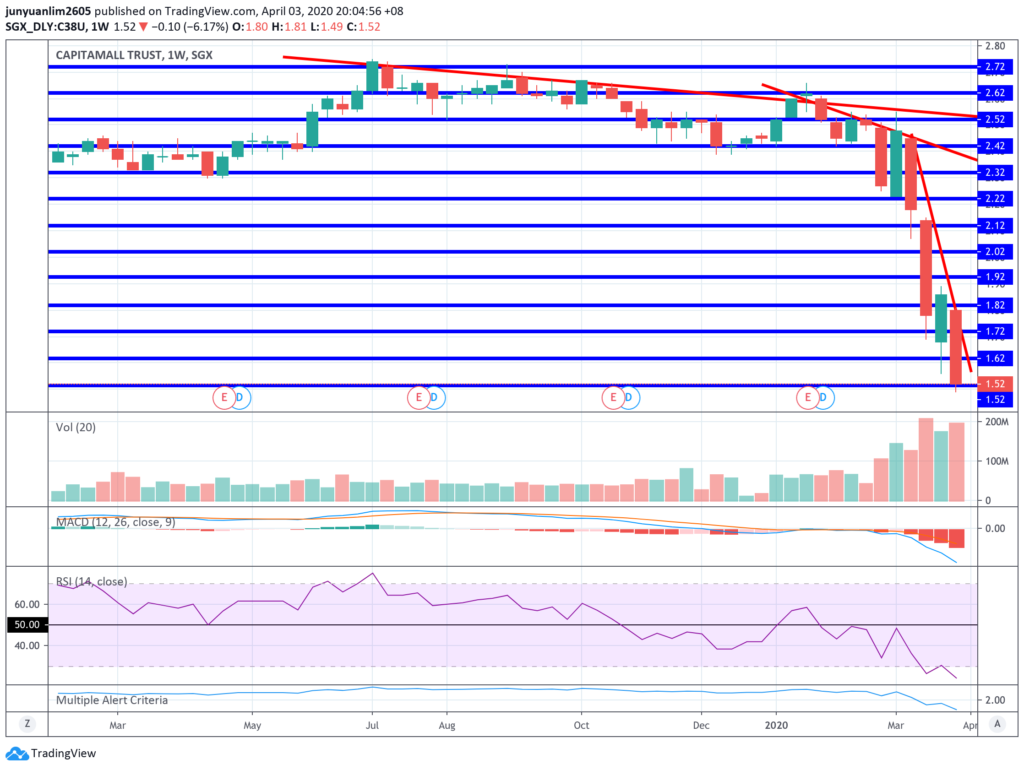
The retail REIT’s unit price broke below the support lines at S$1.72 and S$1.62 to finish the week at the next support line at S$1.52. Trading volume compared to the week before was also higher, and it was also higher than the average traded volume (compared to the weeks preceding it), suggesting that it is likely that the unit price may break under the support line at S$1.52 this week and move towards the next support line at S$1.42 (or even lower.)
6. City Developments (SGX:C09)
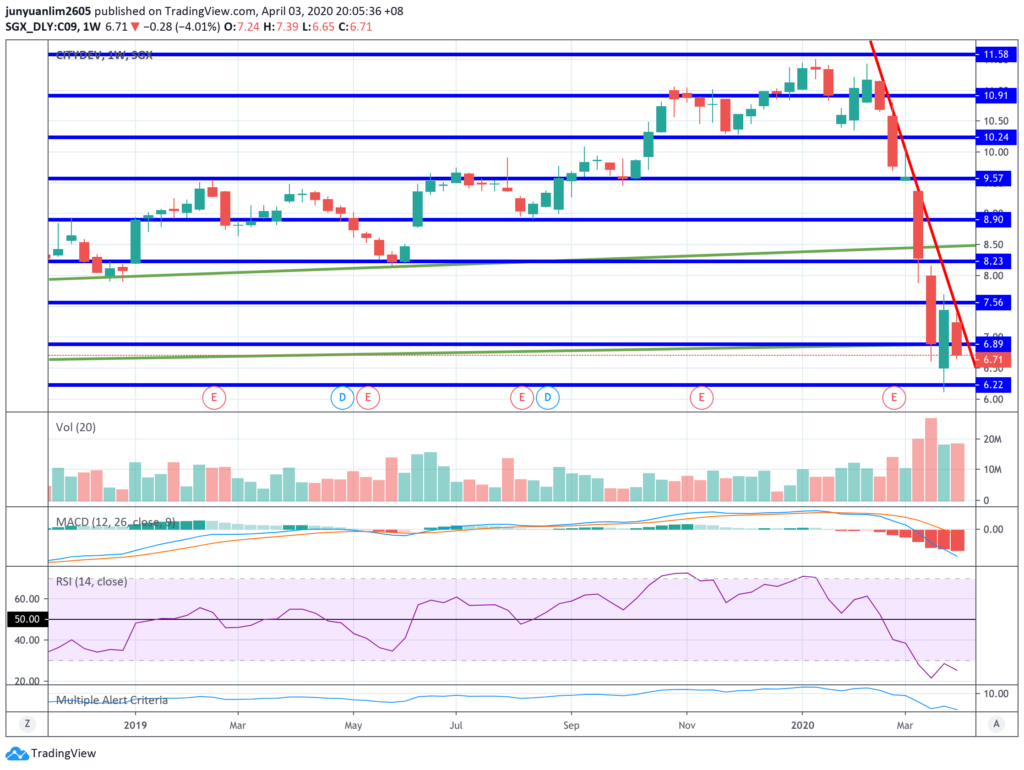
City Developments’ share price touched the red downtrend line at S$7.40, failed to break above it and fell (and even breaking under the S$6.89 support line) to finish the week at S$6.71. Trading volume, compared to the last week, was somewhat the same.
In the week ahead, should the share price be able to break above the red downtrend line, it could possibly move up to the resistance line at S$7.56. Otherwise, its share price could possibly move towards the next support line at S$6.22.
7. ComfortDelGro (SGX:C52)
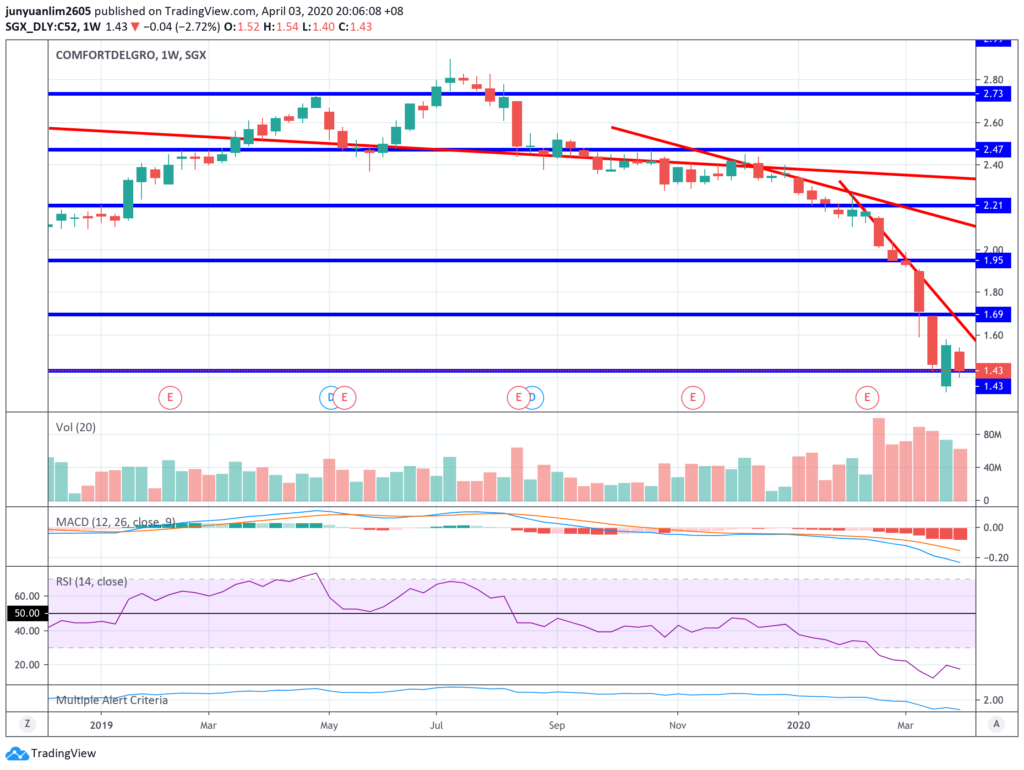
After some pullback the week before, ComfortDelGro’s share price continued its downward descend last week, where the week ended at S$1.43, which is also the support line. Looking at the trading volume, it has been descending for 4 weeks in a row, suggesting that the bears may have weakened.
In the week ahead, its share price could either bounce back up once again and move towards the next resistance line at S$1.69, or break under the S$1.43 support line and move towards the next support line at S$1.17.
8. Dairy Fram International (SGX:D01)
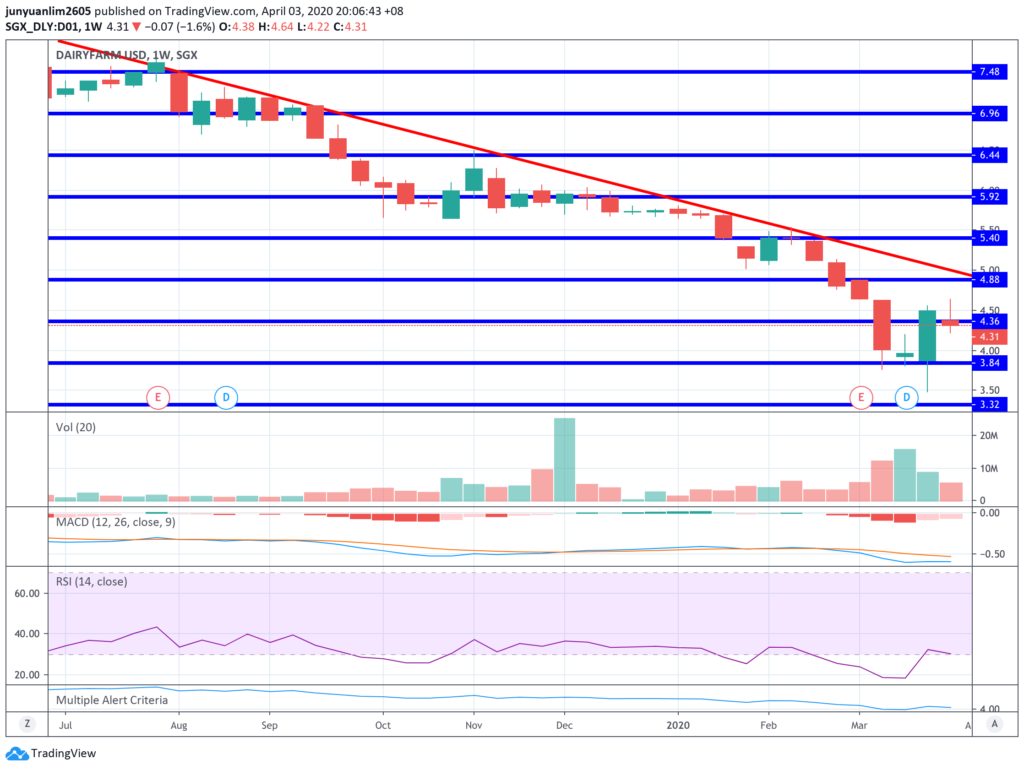
In my weekly post last week (you can check it out here in case you’ve missed it), I mentioned that, should Dairy Farm’s share price end the week above US$4.63, we may be seeing a trend reversal (from a bear to a bull.) In the week that ended last Friday (03 April), its share price broke above US$4.63, but was pulled down and the week ended with the share price just under the US$4.36 support line at US$4.31.
In the week ahead, its share price could break the support turned resistance line and attempt to once again finish the week above US$4.63 (for a trend reversal.) However, if the bearish run were to continue, its share price could move towards the support line at US$3.84.
9. DBS (SGX:D05)
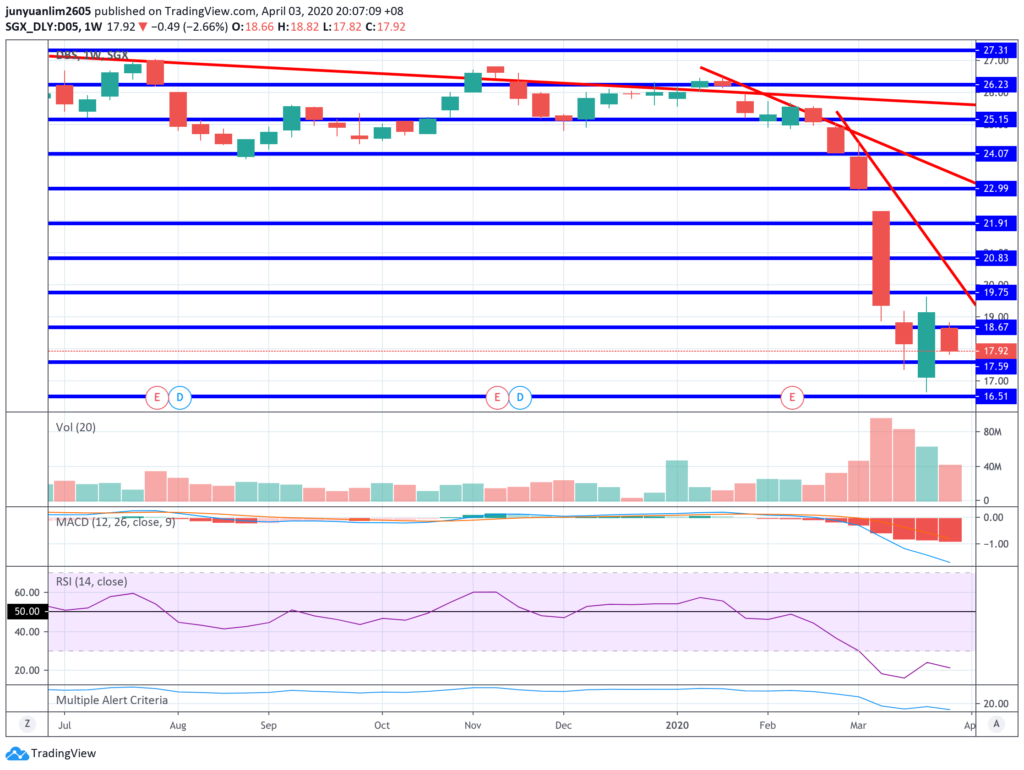
DBS’ share price movement failed to continue its upward last week, but fell under the S$18.67 support line to finish the week at S$17.92. However, the trading volume was lower compared to last week. Also, I noticed that the trading volume have fell for 4 straight weeks, suggesting that the bears may have weakened.
In the week ahead, we could see 2 scenarios – in a bullish one, we could see the share price breaking above the support turned resistance line at S$18.67, and moving towards the next resistance line at S$19.75; in a bearish one, we could see the share price move towards the next support line at S$17.59, and if it break under this line, it could move towards the next support line at S$16.51.
10. Genting Singapore (SGX:G13)
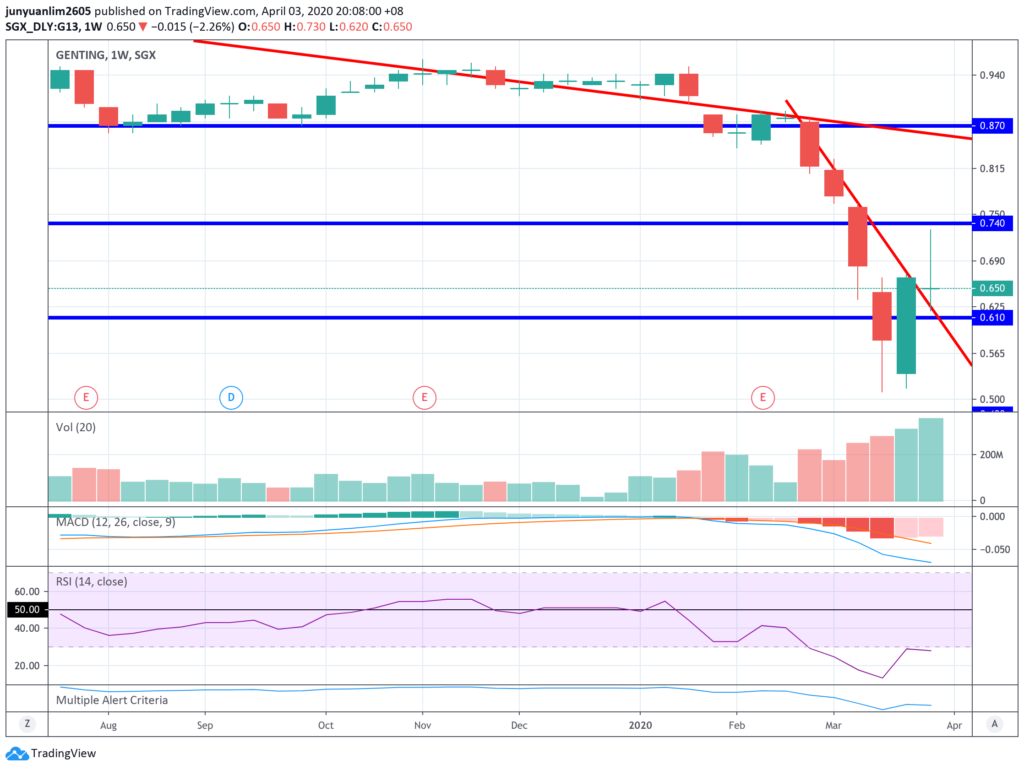
Genting Singapore’s share price continued its bullish run where it moved up towards the resistance at S$0.740, before being pulled back by the bears and the week ended (on 03 April) with the share price at S$0.650.
In the week ahead, we could possibly see the share price testing the S$0.740 resistance line once again. Or if the share price were to fall under the red downtrend line again, it could move towards the support line at S$0.610.
11. Hongkong Land (SGX:H78)

We saw a hammer candlestick formation last week, where the share price ended the week at US$3.89.
In the week ahead, the share price could move towards the resistance line at US$3.99, and if it can break upwards, it may move towards the next resistance line at US$4.34. However, if the bearish run were to continue, it could move towards the next support line at US$3.53.
12. Jardine Cycle & Carriage (SGX:C07)
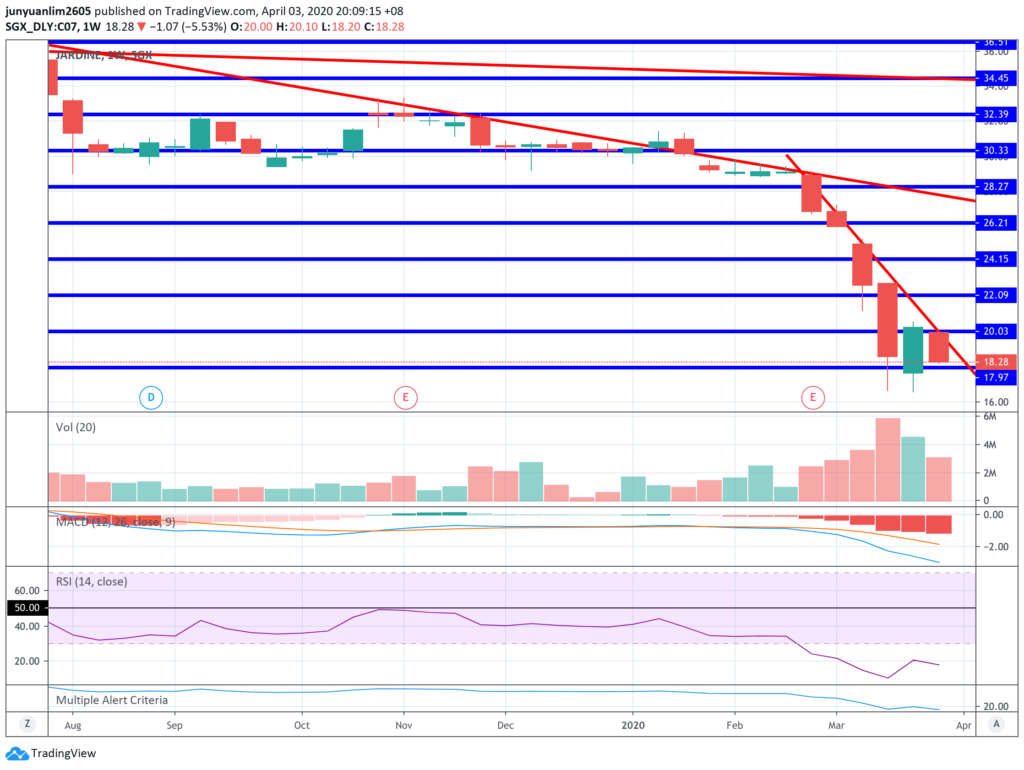
Jardine Cycle & Carriage share price fell once again, after failing to break above the red downtrend and also the resistance line at S$20.03, to end the week at S$18.28 (on 03 April.)
In the week ahead, its share price may once again attempt to break above the red downtrend also resistance line at S$20.03 (and if it is able to do so, it may move up towards the next resistance line at S$22.09.) However, if the downward fall were to continue, it may break under the support line at S$17.97, and move towards the next support line at S$15.91.
13. Jardine Matheson (SGX:J36)
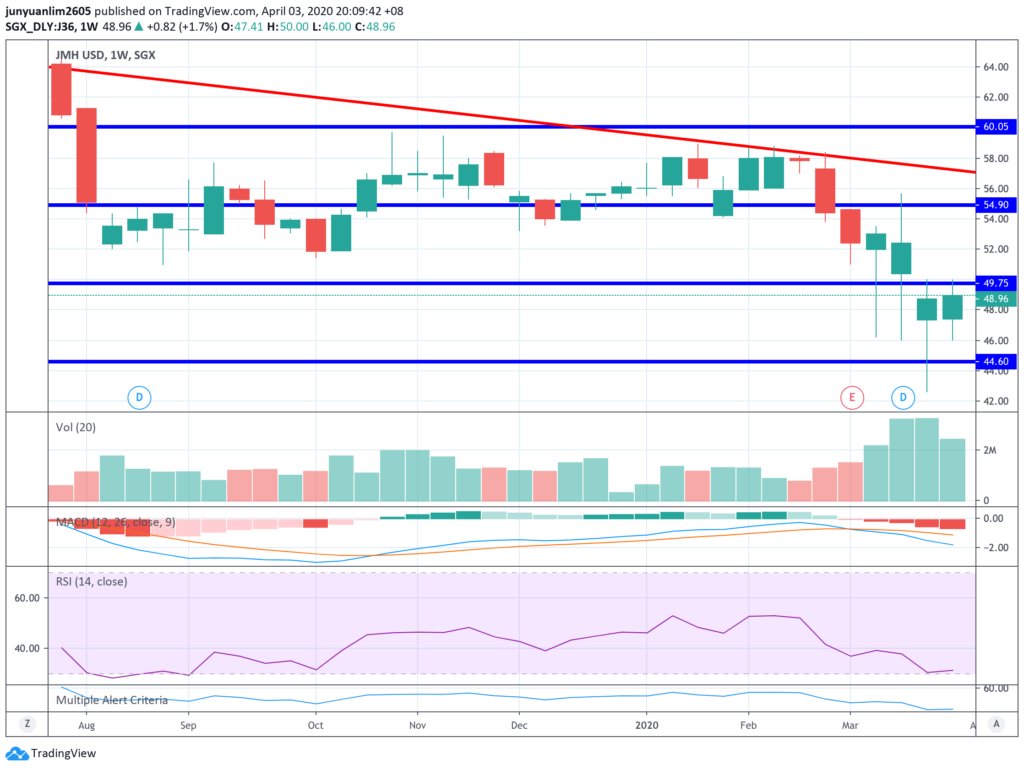
Jardine Matheson’s share price, for 2 weeks in a row, attempted to break above the US$47.95 resistance line and move higher but failed. In the week which ended last Friday (03 April), its share price was at US$48.96.
Personally, I feel that the share price may attempt to once again break above this resistance line this week. If it is able to do so and move upwards from there, the share price could move up to the next resistance line at US$54.90. However, should the bears were to come in and push the share price down once again, we could see the company’s share move towards the support line at US$44.60.
14. Jardine Strategic (SGX:J37)
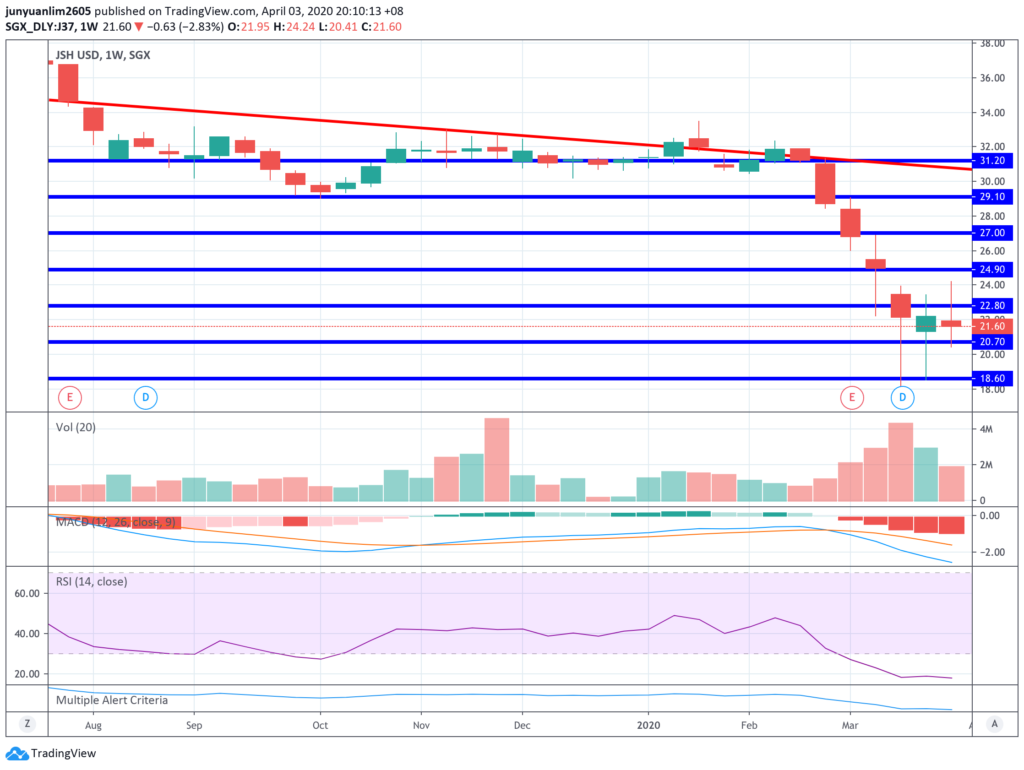
Jardine Strategic’s share price broke above the US$22.80 resistance line and moved towards the next resistance line at US$24.90 before being pulled back down again, where the share price ended the week (on 03 April) at US$21.60.
In the week ahead, its share price may once again attempt to move higher, where it may once again attempt to break above the resistance line at US$22.80 and move towards the next resistance line at US$24.90. However, if the bears were to come in and push the share price down once again, it may once again test the support line at US$20.70.
15. Keppel Corporation (SGX:BN4)
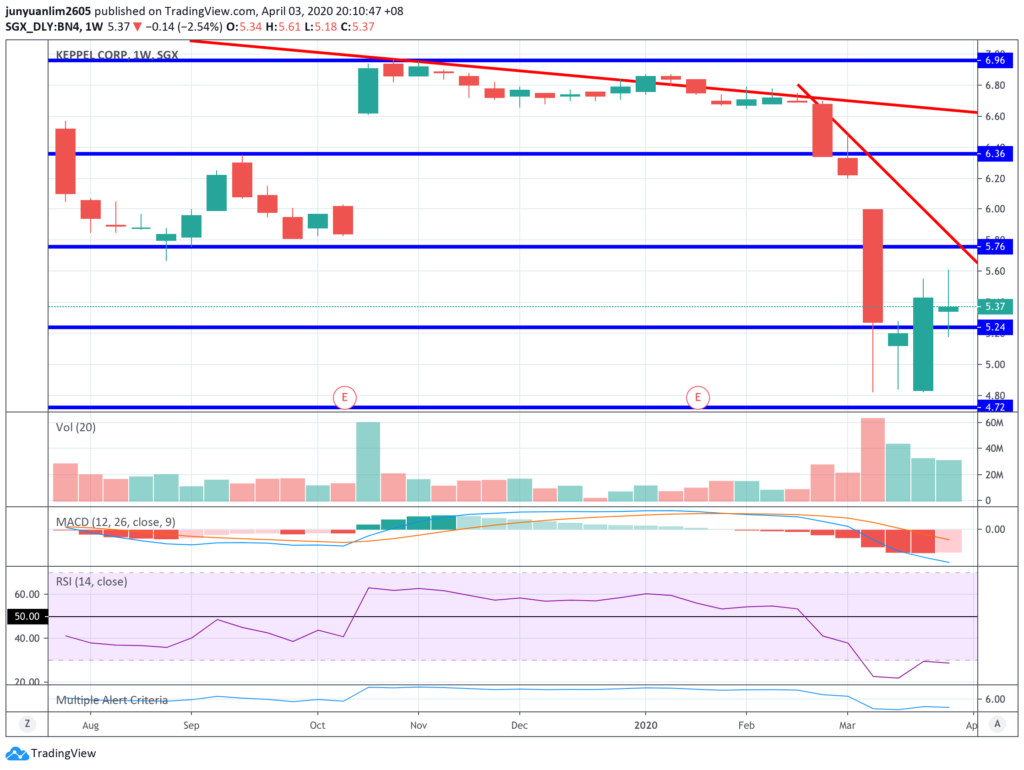
Keppel Corporation’s share price fell slightly under the S$5.24 support line last week, before being pulled up to finish the week (on 03 April) at S$5.37.
Two scenarios could happen in the week ahead – in a bullish one, it could test the resistance line at S$5.76; in a bearish one, it could test the support line at S$5.24.
16. Mapletree Commercial Trust (SGX:N2IU)

Mapletree Commercial Trust’s unit price continued its downward descend last week, where it fell by 39 cents to finish the week (on 03 April) at S$1.50.
Looking at its trading volume (which is higher than last week), it is likely that the unit price may move towards the support line at S$1.47; should it break under this support line, its unit price may move towards the next support line at S$1.37.
17. Mapletree Logistics Trust (SGX:M44U)
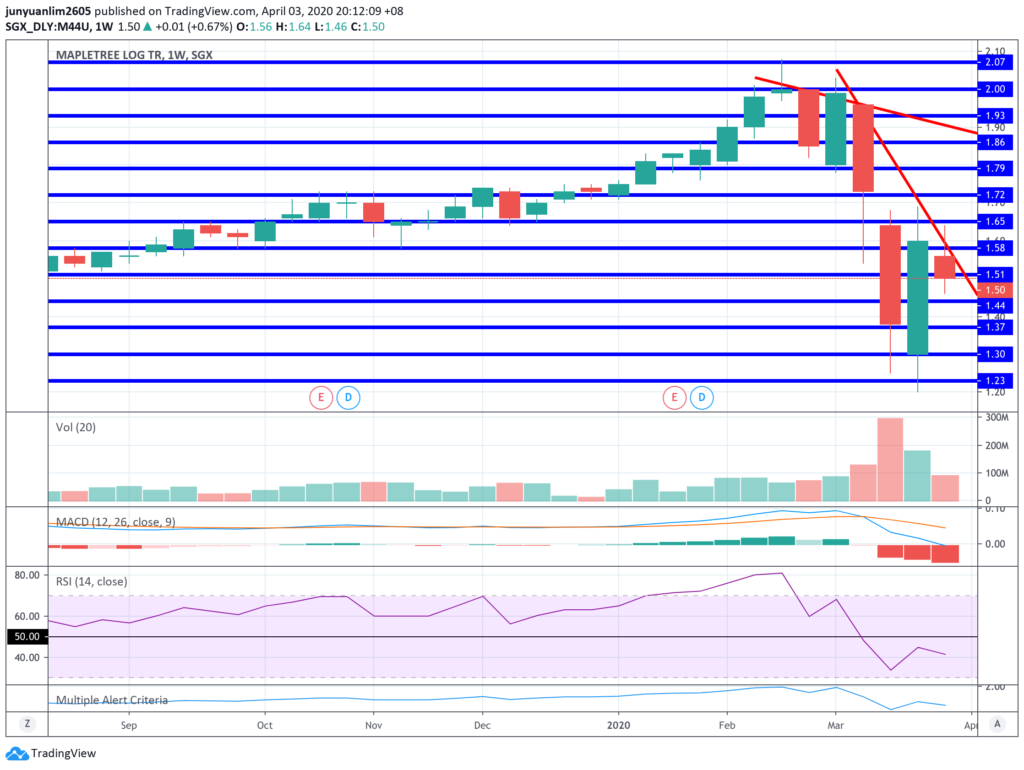
Looking at the unit price movement of the logistics REIT last week, it has momentarily broke above the red downtrend line at around S$1.56 and resistance line at S$1.58 before being pulled down again, where the unit price ended the week (on 03 April) just under the support line at S$1.50.
In the week ahead, its unit price may attempt to once again break out of the red downtrend line at S$1.56 and also the resistance line at S$1.58. If it is able to do so, then the unit price could move towards the next resistance line at S$1.65. However, should the downward fall continue this week, it could move towards the next support line at S$1.44.
18. OCBC (SGX:O39)
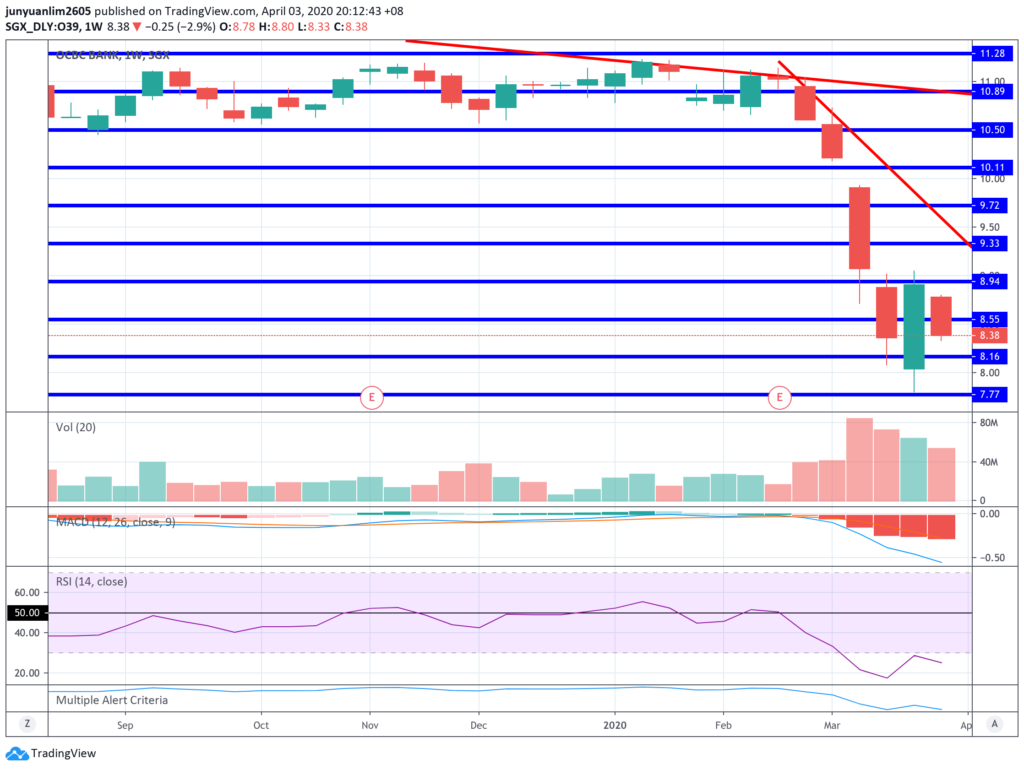
OCBC’s share price failed to break above the resistance line at S$8.94 last week, but fell below the support line at S$8.55 to finish the week (on 03 April) at S$8.38. However, looking at the trading volume, it has fell for 4 successive weeks, suggesting that the bears may have weakened.
In the week ahead, its share price may either break above the support turned resistance line at S$8.55, and up to the next resistance line at S$8.94, or it may continue its fall towards the next support line at S$8.16.
19. SATS (SGX:S58)
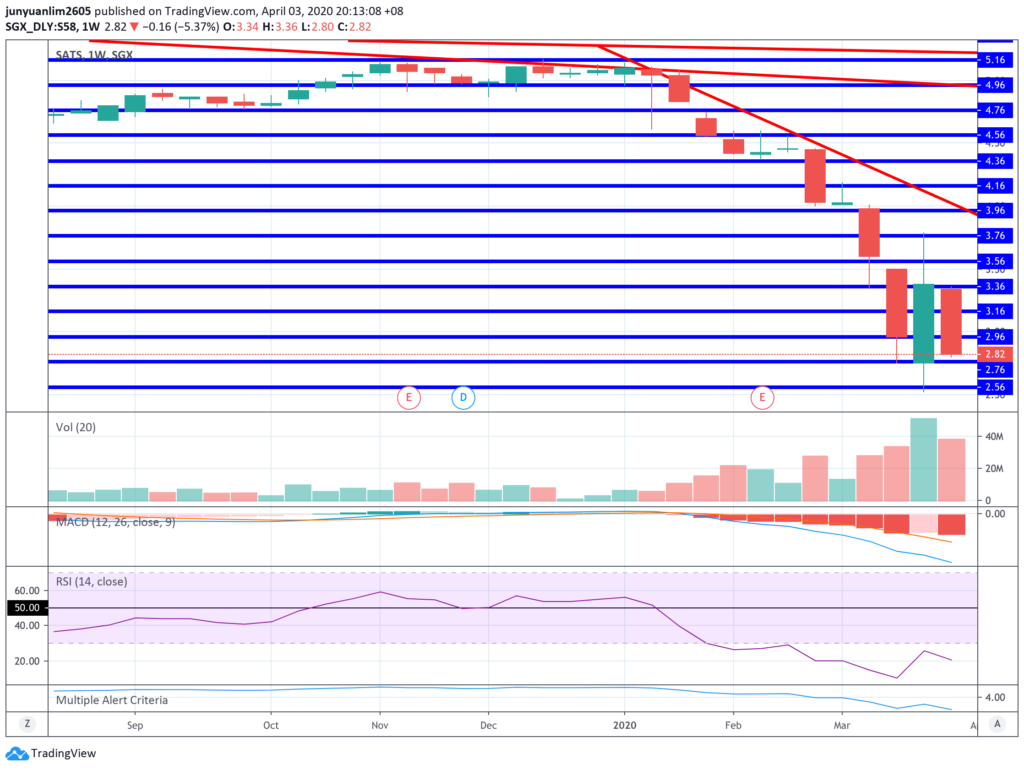
SATS’ share price touched the resistance line at S$3.36 last week and broke under the support lines at S$3.16 and S$2.96 to finish the week (on 03 April) at S$2.82.
In the week ahead, its share price could either test the most immediate support line at S$2.76, or should there be any form of rebound, it could break above the resistance line at S$2.96 and up towards S$3.16.
20. Sembcorp Industries (SGX:U96)
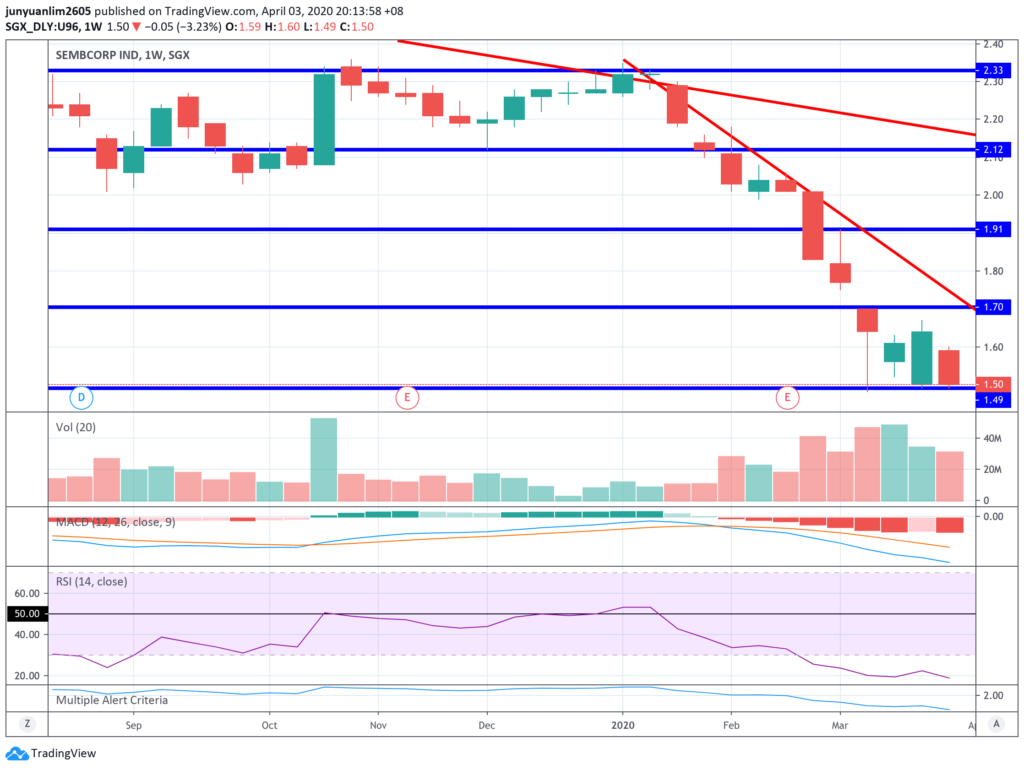
Sembcorp Industries’ share price continued its downward descend last week, where it ended the week (on 03 April) just one-cent above the support line at S$1.49.
In the week ahead, its share price could either break below this support line and move towards the next support line at S$1.28, or there may be some pull back up towards the next resistance line at S$1.70.
21. SGX (SGX:S68)
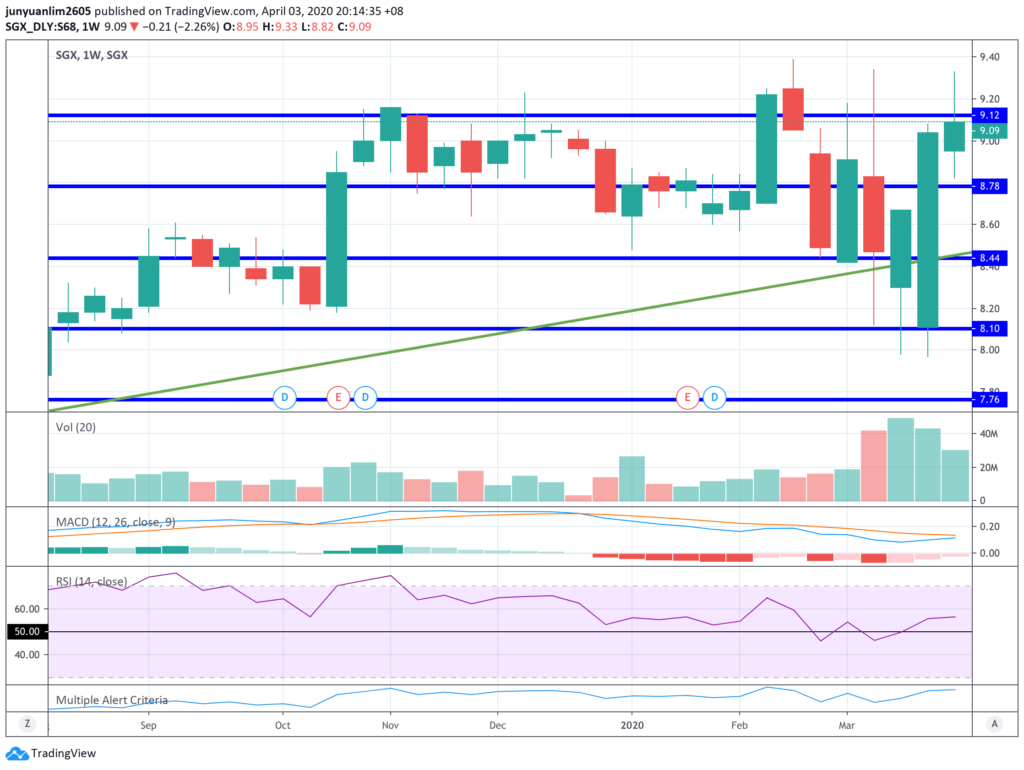
Looking at its MACD, it is likely that the share price of SGX may attempt to break above the S$9.12 resistance line in the week ahead and move towards the next resistance line at S$9.46.
However, I also noticed that the volume have come down for the past 3 weeks – so it is possible that the upward moving trend may be weakening. If there’s any push down in its share price, then it could move towards the S$8.78 support line.
22. SIA (SGX:C6L)
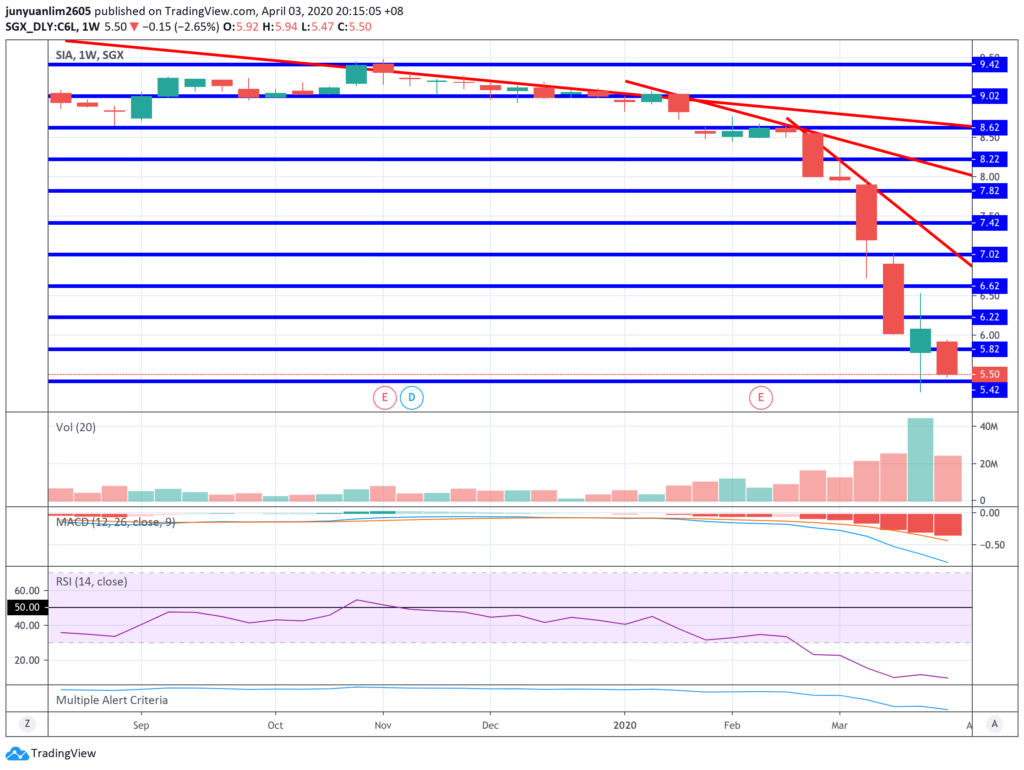
SIA’s share price continued to drop last week, where it closed at S$5.50 (when trading ended last Friday, 03 April.)
In the week ahead, there could either be some bounce back up towards the most immediate resistance line at S$5.82, or it may test the support line at S$5.42 – and should it fall below this line, the next support line is at S$5.02.
22. SingTel (SGX:Z74)
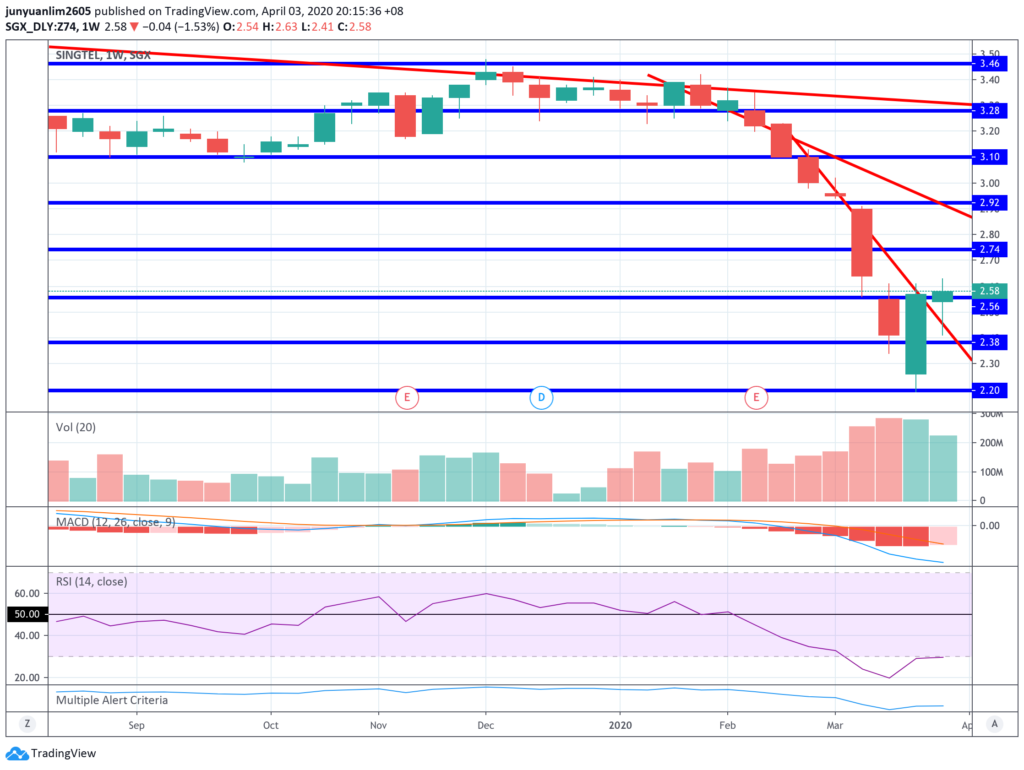
SingTel’s share price broke above the S$2.56 resistance line to finish the week (on 03 April) at S$2.58. Looking at the MACD, it seems that the share price movement may be moving upwards in the near term, where it could possibly move towards the next resistance line at S$2.74.
However, in a bearish scenario, it could break under the resistance turned support line at S$2.56 and down towards the next support line at S$2.38.
24. SPH (SGX:T39)
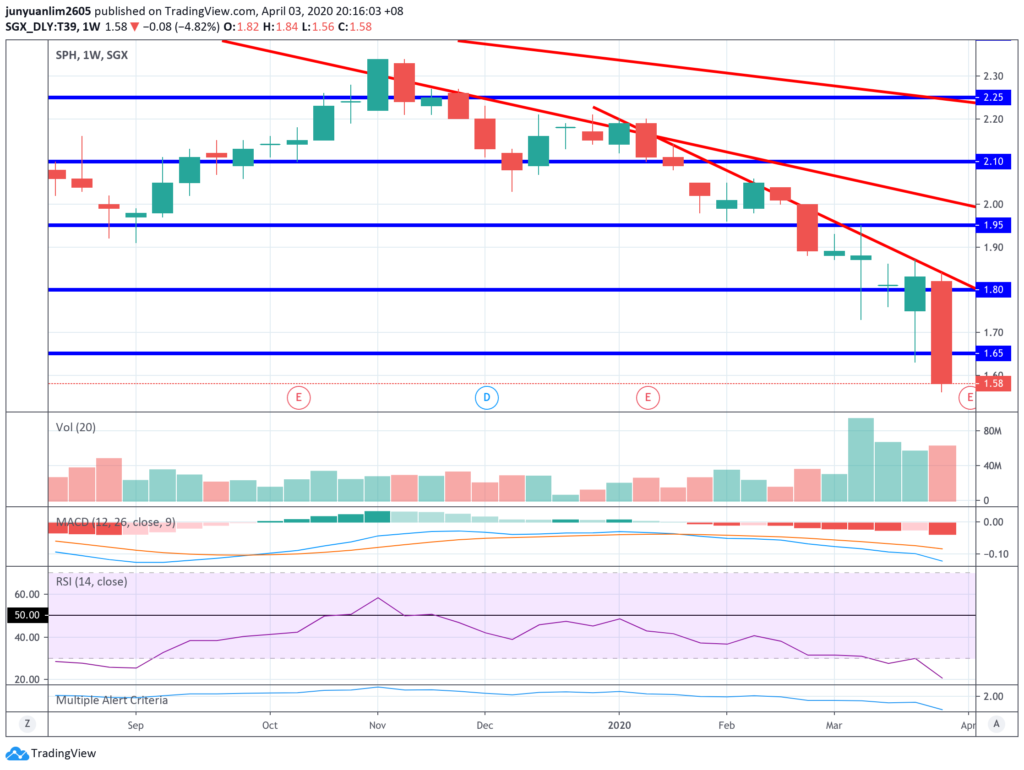
SPH’s share price bounced down after hitting the red downtrend line at S$1.84, where it finished the week at S$1.58.
From the looks of this red bearish candlestick, the share price could fall further in the week ahead, where it could move towards the next support line at S$1.50.
25. ST Engineering (SGX:S63)
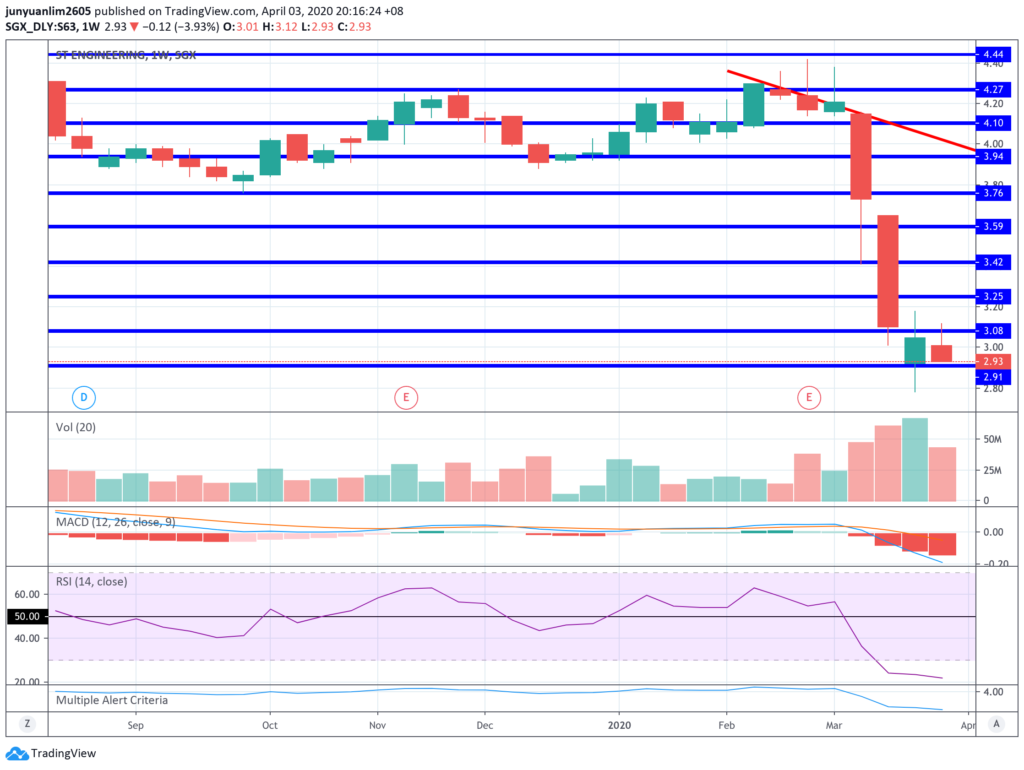
ST Engineering’s share price broke above the S$3.08 support line and attempted to move higher from there, but failed and the share price slipped down and closed at S$2.93 when the market closed last Friday (03 April.)
In the week ahead, we could see 2 scenarios – in a bullish mode, we could see the share price once again break above S$3.08 resistance line and move higher from there; in a bearish move, it could break under the S$2.91 support line and move towards the next support line at S$2.74.
26. ThaiBev (SGX:Y92)
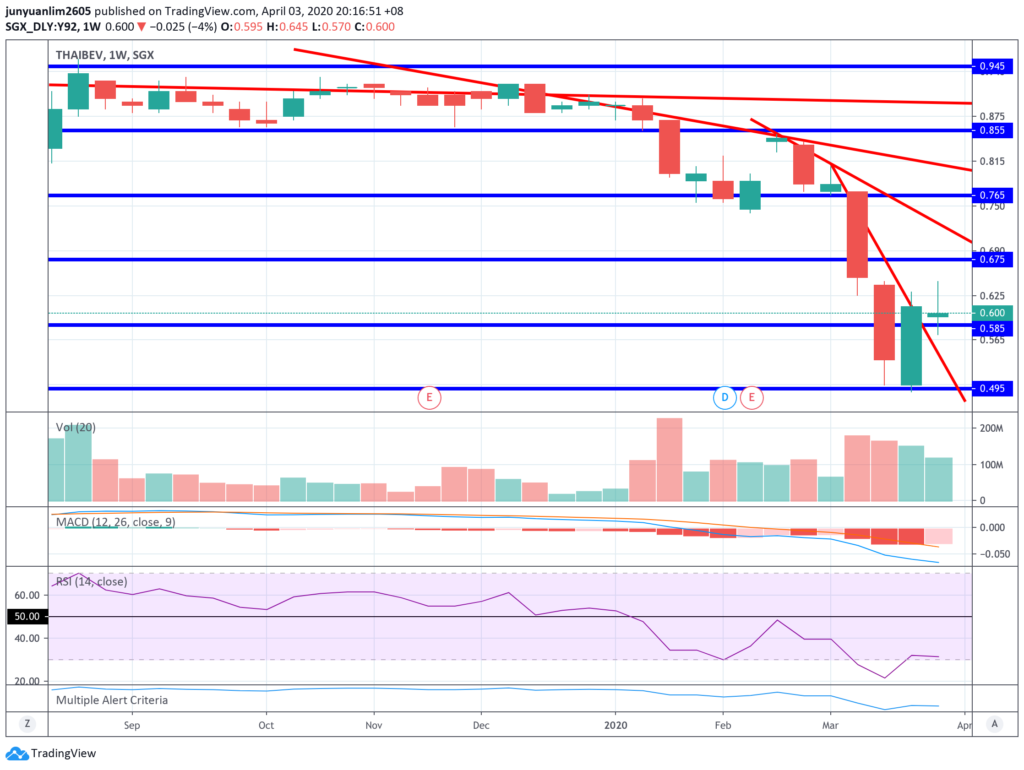
ThaiBev’s share price broke under the S$0.585 support line during the week, but it bounced back up and the week ended at S$0.600 (on 03 April.) Looking at the MACD, it is possible that the share price could move upwards in the week ahead, towards the resistance line at S$0.675.
27. UOB (SGX:U11)
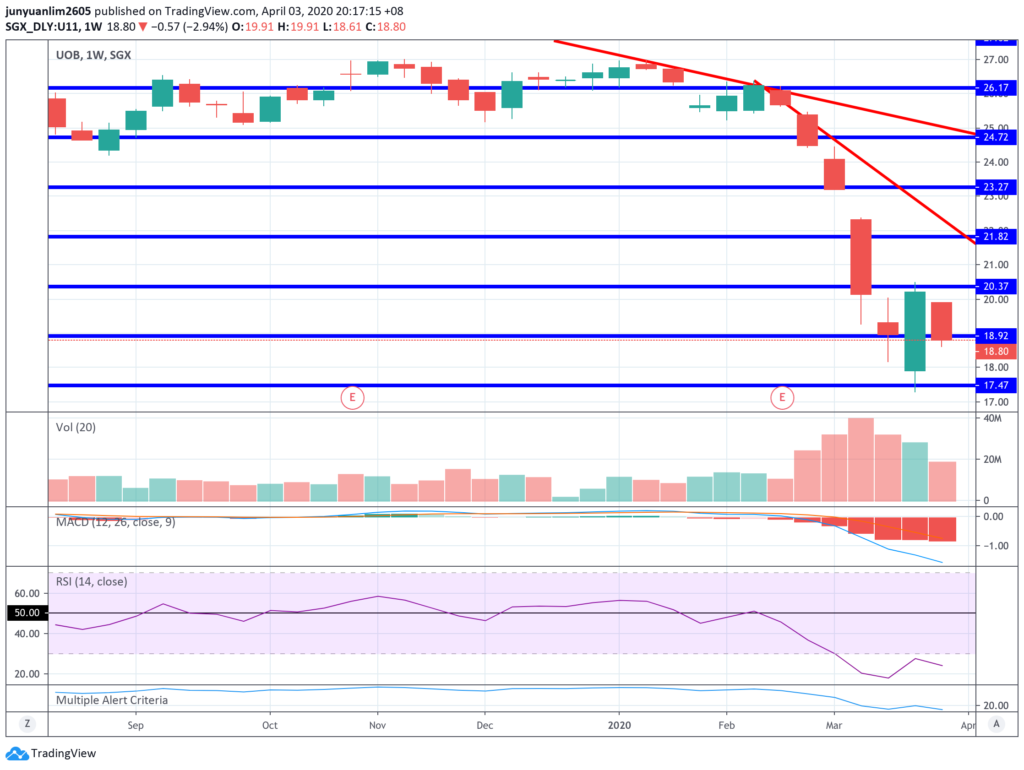
UOB’s share price failed to continue its bounce back up the week before where it dropped once again – the share price fell below the support line at S$18.92 to end the week (on 03 April) at S$18.80.
Looking at the trading volume, it has fell for 4 consecutive weeks, suggesting that the downward movement may have weakened. In the week ahead, its share price could see a bounce back up once again above the support turned resistance line at S$18.92, and up towards the next resistance line at S$20.37. However, should the bearish run were to continue, we could see the share price move towards the support line at S$17.47.
28. UOL (SGX:U14)
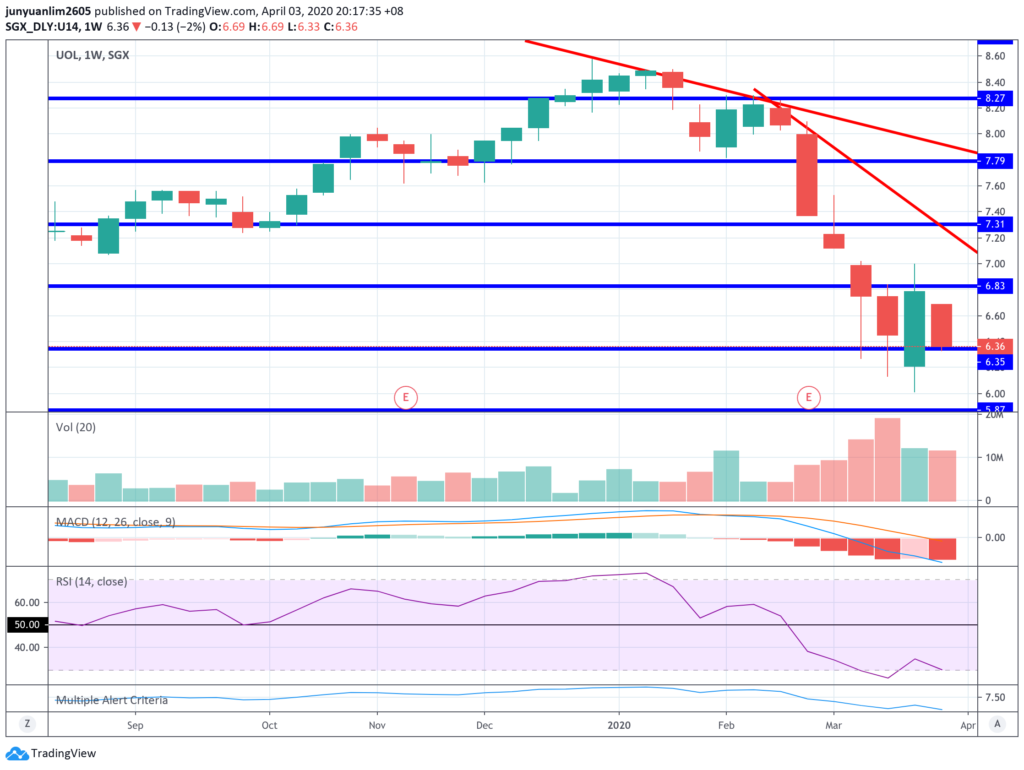
UOL’s share price failed to move above the resistance line at S$6.83 last week, but instead fell to the support line at S$6.35 (it ended the week on 03 April one-cent above the support line at S$6.36.)
In the week ahead, the share price of UOL could either bounce back up once again and move towards the resistance line at S$6.83, or it could break under the support line at S$6.35 and move towards the next support line at S$5.87.
29. Venture Corporation (SGX:V03)
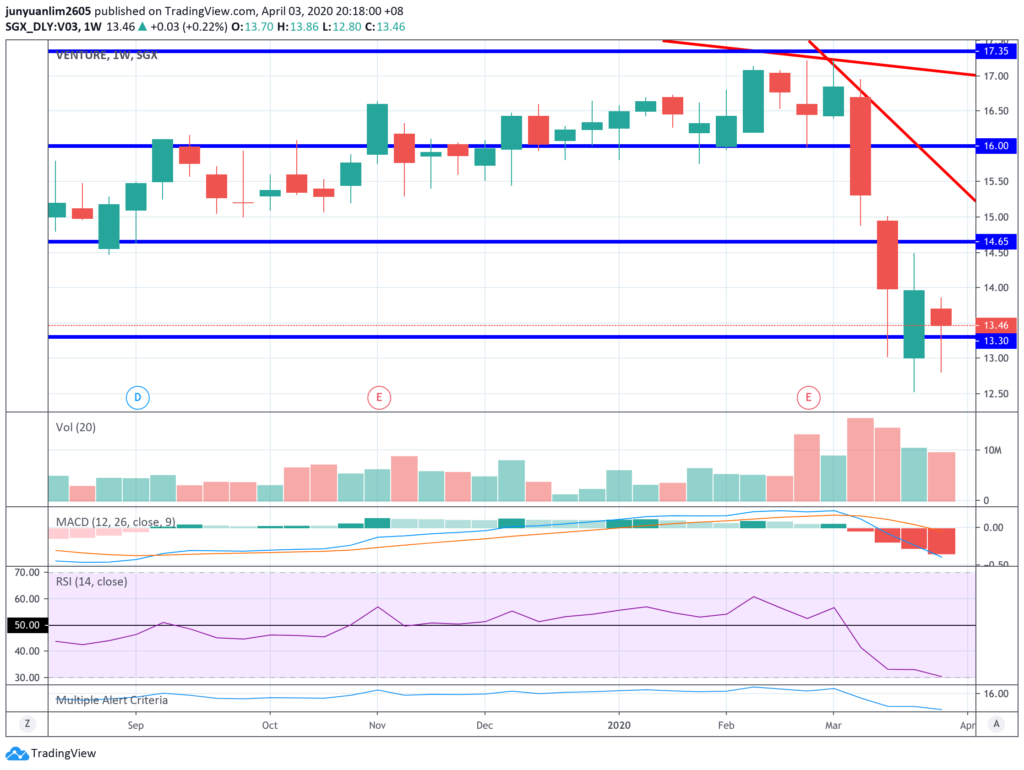
Venture Corporation’s share price fell under the support line at S$13.30 before bouncing back up and closing at S$13.46 last Friday (03 April.)
2 scenarios could happen this week – in a bullish one, the share price could move up towards the resistance line at S$14.65; in a bearish one, the share price could break under the support line at S$13.30 and move towards the next support line at S$11.95.
30. Wilmar International (SGX:F34)

Wilmar International’s share price broke above the red downtrend line and also the S$3.28 resistance line, towards the next resistance line at S$3.41 before falling once again to close under the red downtrend line and also just under the S$3.15 support line (at S$3.14.)
In the week ahead, we could either see Wilmar’s share price attempting to break above the red downtrend line and also the resistance lines just like last week, or it could continue to fall towards the next support line at S$3.02.
31. Yangzijiang Shipbuilding (SGX:BS6)
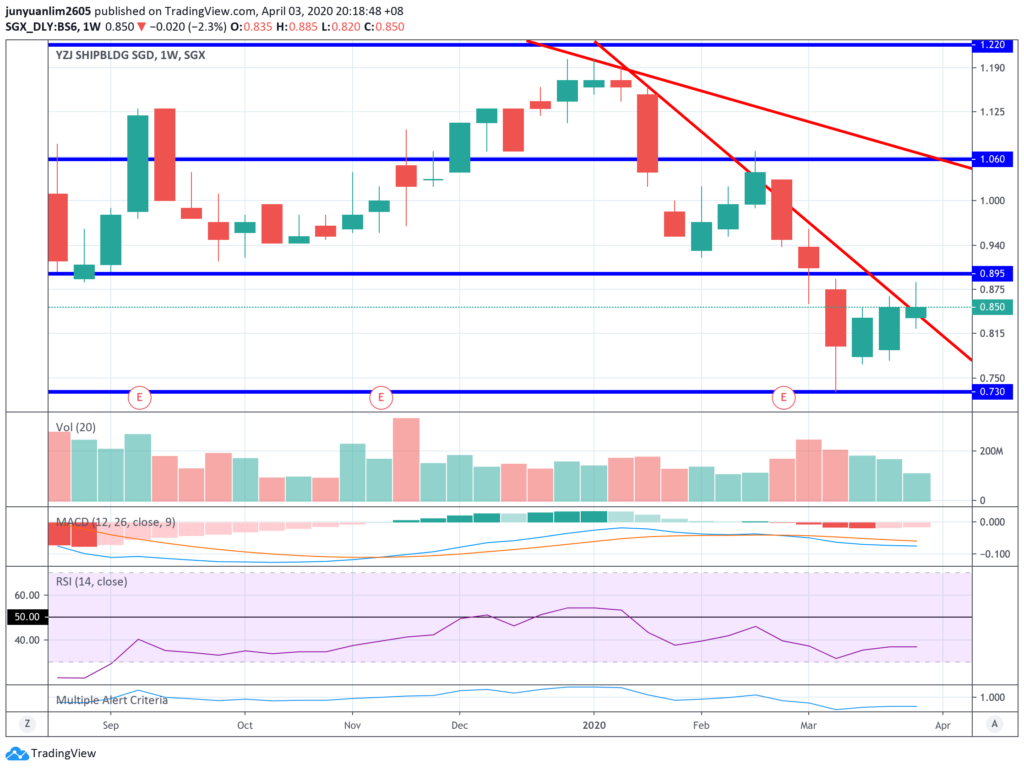
Looking at the trading volume, and also the MACD, the share price of Yangzijiang could move in either direction in the week ahead – it could either move up towards the resistance line at S$0.895, or down towards the support line once again at S$0.730.
Disclaimer: Please note that the above sharing is for your educational purposes only, and it does not imply any buying/selling calls for any of the companies above. At the time of writing, I am a shareholder of Ascendas REIT, CapitaLand Mall Trust, ComfortDelGro, DBS, Mapletree Commercial Trust, SATS, SIA, SingTel, OCBC, and UOB.
Stop Spending Hours Reading REIT Reports Every Quarter!
What if you could assess a REIT's portfolio occupancy, debt profile, valuation, and overall health in less than 30 seconds - without having to comb through a single quarterly report?
That's the problem the REIT Screener was built to solve.
Developed through a collaboration between ShareInvestor and The Singaporean Investor, the REIT Screener consolidates many of the key metrics and indicators I personally use when analysing REITs into one easy-to-use platform. Instead of spending hours extracting data manually every earnings season, you can now monitor the REITs you own and research new opportunities in just a few clicks.
If you're serious about REIT investing but don't have the time to manually track quarterly developments, the REIT Screener could be the shortcut you've been looking for:

Take a closer look at the REIT Screener here...


Comments (0)