Brief Overview:
Mapletree Industrial Trust (SGX: ME8U), or MIT, is a real estate investment trust that owns a diversified portfolio of industrial properties across Singapore and overseas markets.
Its Singapore portfolio comprises assets such as hi-tech buildings, business park properties, and general industrial facilities, while its overseas exposure comes primarily from data centre assets located globally. MIT also invests in other real estate-related assets as part of its investment strategy.
As at 30 September 2026, MIT’s portfolio consisted of 79 properties in Singapore, 53 properties in North America (including 13 data centres held through a joint venture with its Sponsor, Mapletree Investments Pte Ltd), and 2 properties in Japan. Collectively, these properties contributed to a total assets under management value of approximately S$8.3 billion.
Financial Figures (1H FY2025/26 vs. 1H FY2026/27):
| 1H FY2025/26 | 1H FY2026/27 | % Variance | |
| Gross Revenue (S$’mil) | $346.1m | $329.3m | -4.9% |
| Property Operating Expenses (S$’mil) | $88.5m | $87.3m | -1.4% |
| Net Property Income (S$’mil) | $257.6m | $242.1m | -6.0% |
| Distributable Income to Unitholders (S$’mil) | $184.7m | $173.6m | -5.7% |
MIT’s gross revenue and net property income declined by 4.9% and 6.0% year on year to S$329.3 million and S$242.1 million, respectively. The weaker performance was primarily due to the loss of income following the divestment of 3 industrial properties in Singapore in August 2025, lower contributions from its North American portfolio arising from non-renewal of leases, as well as the depreciation of the US Dollar and Japanese Yen against the Singapore Dollar. However, these were partially cushioned by higher revenue from new leases and lease renewals across its Singapore portfolio, alongside increased utility recovery income from its North American properties.
Meanwhile, property operating expenses decreased by 1.4% year on year to S$87.3 million, mainly attributable to cost savings following the divestment of the 3 industrial properties in Singapore. These savings were partially offset by higher recoverable utility costs in its North American portfolio and an increase in other property operating expenses.
Finally, MIT’s distributable income to unitholders fell by 5.7% year on year to S$173.6 million, largely due to lower operational cash net property income. However, the decline was partially mitigated by a 16.3% year-on-year reduction in borrowing costs, supported by loan repayments using proceeds from the divestment of the 3 Singapore industrial properties, lower interest expenses on unhedged floating-rate borrowings, and interest savings from the temporary repayment of loans using proceeds raised through the issuance of new perpetual securities in March 2026.
Financial Figures (2Q FY2025/26 vs. 2Q FY2026/27):
| 2Q FY2025/26 | 2Q FY2026/27 | % Variance | |
| Gross Revenue (S$’mil) | $170.2m | $167.0m | -1.9% |
| Property Operating Expenses (S$’mil) | $46.2m | $47.3m | +2.4% |
| Net Property Income (S$’mil) | $124.0m | $119.8m | -3.4% |
| Distributable Income to Unitholders (S$’mil) | $91.0m | $84.8m | -6.5% |
Once again, weakness in MIT’s North American portfolio weighed on its financial performance, marking the 5th consecutive quarter in which the REIT recorded year-on-year declines in gross revenue, net property income, and distributable income to unitholders.
MIT’s gross revenue and net property income fell by 1.9% and 3.4% year on year to S$167.0 million and S$119.8 million, respectively. The decline was primarily attributable to the non-renewal of leases in its North American portfolio, the absence of income following the divestment of 3 industrial properties in Singapore in August 2025, and the depreciation of the Japanese Yen against the Singapore Dollar. These headwinds were partially offset by higher revenue from new leases and renewals in its Singapore portfolio, as well as increased utility recovery income from its North American portfolio.
Meanwhile, property operating expenses rose by 2.4% year on year to S$47.3 million, mainly due to higher expenses in the North American portfolio, partially offset by lower property operating expenses in Singapore.
Finally, MIT’s distributable income to unitholders declined by 6.5% year on year to S$84.8 million, reflecting lower operational cash net property income. The decline was partially mitigated by a 6.8% year-on-year reduction in borrowing costs, driven by loan repayments funded by the net proceeds from the divestment of the 3 Singapore industrial properties, as well as lower interest expenses on unhedged floating-rate loans.
Portfolio Occupancy Profile (1Q FY2026/27 vs. 2Q FY2026/27):
| 1Q FY2026/27 | 2Q FY2026/27 | |
| Portfolio Occupancy (%) | 90.7% | 89.7% |
| Portfolio WALE (by Gross Revenue – years) | 4.5 years | 4.4 years |
MIT’s portfolio occupancy declined by 1.0 percentage point (pp) quarter on quarter to 89.7%, reflecting lower occupancy across both its Singapore and North American portfolios.
In Singapore, occupancy edged down by 0.1pp from 94.3% in the previous quarter to 94.2%.
Meanwhile, occupancy in North America has continued to trend downwards every quarter since 2Q FY2024/25, as shown below:
90.9% (2Q FY2024/25) → 90.3% (3Q) → 88.2% (4Q) → 88.0% (1Q FY2025/26) → 87.8% (2Q) → 87.5% (3Q) → 86.1% (4Q) → 82.5% (1Q FY2026/27) → 79.1% (2Q)
The latest quarter’s decline was primarily attributable to the full-quarter impact of a lease non-renewal at 7337 Trade Street in San Diego, California.
In contrast, MIT’s properties in Japan maintained full occupancy in both the current and previous quarters.
Looking ahead, MIT has a relatively manageable lease expiry schedule in the near term, with just 6.4% of its leases due for renewal in the second half of FY2026/27. Over the following 3 financial years, from FY2027/28 to FY2029/30, an average of approximately 17% of leases will expire annually, while the remaining 42.6% of leases are scheduled to expire in FY2030/31 or later.
Debt Profile (1Q FY2026/27 vs. 2Q FY2026/27):
| 1Q FY2026/27 | 2Q FY2026/27 | |
| Aggregate Leverage (%) | 37.5% | 37.7% |
| Interest Coverage Ratio (times) | 4.0x | 4.0x |
| Average Cost of Debt (%) | 3.2% | 3.3% |
| Average Term to Debt Maturity (years) | 3.4 years | 3.5 years |
| % of Borrowings Hedged at Fixed Rates (%) | 73.3% | 72.7% |
Compared to the previous quarter, MIT’s debt profile deteriorated slightly, with a modest increase in both its aggregate leverage and average cost of debt, alongside a slight decline in the proportion of borrowings hedged at fixed interest rates.
Nevertheless, MIT’s aggregate leverage remains at a healthy 37.7%, providing a comfortable debt headroom below the regulatory limit of 50.0%.
In terms of debt maturity, MIT faces relatively limited refinancing requirements in the near term, with just 4% of its borrowings due for refinancing in the second half of FY2026/27. However, refinancing requirements will rise to 27% in FY2027/28. Thereafter, the proportion of borrowings due for refinancing over the following 4 financial years, from FY2028/29 to FY2031/32, stands at 7%, 10%, 20%, and 23%, respectively, with the remaining 9% maturing in FY2032/33 or later.
Distribution Payout to Unitholders (2Q FY2025/26 vs. 2Q FY2026/27):
MIT declares its distributions on a quarterly basis.
The table below summarises the REIT’s distribution payout for 2Q FY2026/27, alongside the corresponding distribution amount paid in the same period a year earlier for comparison:
| 2Q FY2025/26 | 2Q FY2026/27 | % Variance | |
| Distribution Per Unit (S$’cents) | 3.18 cents | 2.97 cents | -6.6% |
For MIT unitholders, the following are the key dates to take note of for the upcoming distribution payout:
Ex-Date: 03 November 2026
Record Date: 04 November 2026
Payout Date: 09 December 2026
Distribution Payout to Unitholders (1H FY2025/26 vs. 1H FY2026/27):
Together with the 3.11 cents distribution declared in the first quarter, MIT’s total distribution payout for the first half of FY2026/27 amounted to 6.08 cents.
The table below compares MIT’s distribution payout for 1H FY2026/27 against the corresponding period a year earlier:
| 1H FY2025/26 | 1H FY2026/27 | % Variance | |
| Distribution Per Unit (S$’cents) | 6.45 cents | 6.08 cents | -5.7% |
CEO Mr Anand Tze Ming Chandran’s Comments & Outlook (from the REIT’s Press Release):
“We continue to advance our leasing and portfolio rejuvenation efforts, marked by the successful backfilling of the Alpharetta Data Centre and San Jose Data Centre and the divestment of the Eagan Data Centre. With most enterprise leases having completed their initial renewal cycles, our proactive engagement with tenants has improved visibility over upcoming expiries and contributed to a more balanced lease expiry profile. Amid persistent interest rate headwinds, with maturing interest rate swaps being repriced at higher rates, we remain focused on progressing selective divestments and actively rebalancing the portfolio to strengthen its resilience.”
Closing Thoughts:
Another quarter, another disappointing set of results from MIT, as ongoing weakness in its North American portfolio continues to weigh on its financial performance. In fact, this marks the 5th consecutive quarter in which the REIT has recorded year-on-year declines in its financial figures.
Occupancy in its North American portfolio has also continued to deteriorate, falling steadily from a recent high of 90.9% in 2Q FY2024/25.
Meanwhile, MIT’s debt profile weakened slightly compared to the previous quarter, with aggregate leverage increasing by 0.2pp to 37.7% and its average cost of debt rising by 0.1pp to 3.3%. Nevertheless, both metrics remain at reasonable levels.
The only bright spot, at least in my opinion, was the improvement in rental reversions, with MIT achieving a positive rental reversion rate of +6.9% for new and renewed leases during the quarter, up from +5.3% in the previous quarter.
Related Documents:
Press Release
Financial Statements
Presentation Slides
Disclaimer: At the time of writing, I am a unitholder of Mapletree Industrial Trust.
Join Me for a FREE Live Online Chit-Chat on Thursday, 12 November, from 8–9pm (SGT)!

It's been quite some time since I last had a live chit-chat with the investing community, and I’m excited to be back for another session! A big thank you to my friend, Dinah Poehlmann from Your Finance Mind, for inviting me once again!
This time, we’re taking a little break from REITs and exploring some interesting topics surrounding investing, including my go-to investing resources, when is a stock considered 'investable', my thoughts about using AI for stock analysis and trading, and much more.
Whether you're just starting your investing journey or have been investing for years, I hope this session will offer some useful perspectives and practical takeaways that you can apply to your own investing journey.
Best of all, the session is completely FREE to attend! All you need to do is register in advance to receive the Zoom link:
👉 Click here to reserve your spot!
Stop Spending Hours Reading REIT Reports Every Quarter!
What if you could assess a REIT's portfolio occupancy, debt profile, valuation, and overall health in less than 30 seconds - without having to comb through a single quarterly report?
That's the problem the REIT Screener was built to solve.
Developed through a collaboration between ShareInvestor and The Singaporean Investor, the REIT Screener consolidates many of the key metrics and indicators I personally use when analysing REITs into one easy-to-use platform. Instead of spending hours extracting data manually every earnings season, you can now monitor the REITs you own and research new opportunities in just a few clicks.
If you're serious about REIT investing but don't have the time to manually track quarterly developments, the REIT Screener could be the shortcut you've been looking for:
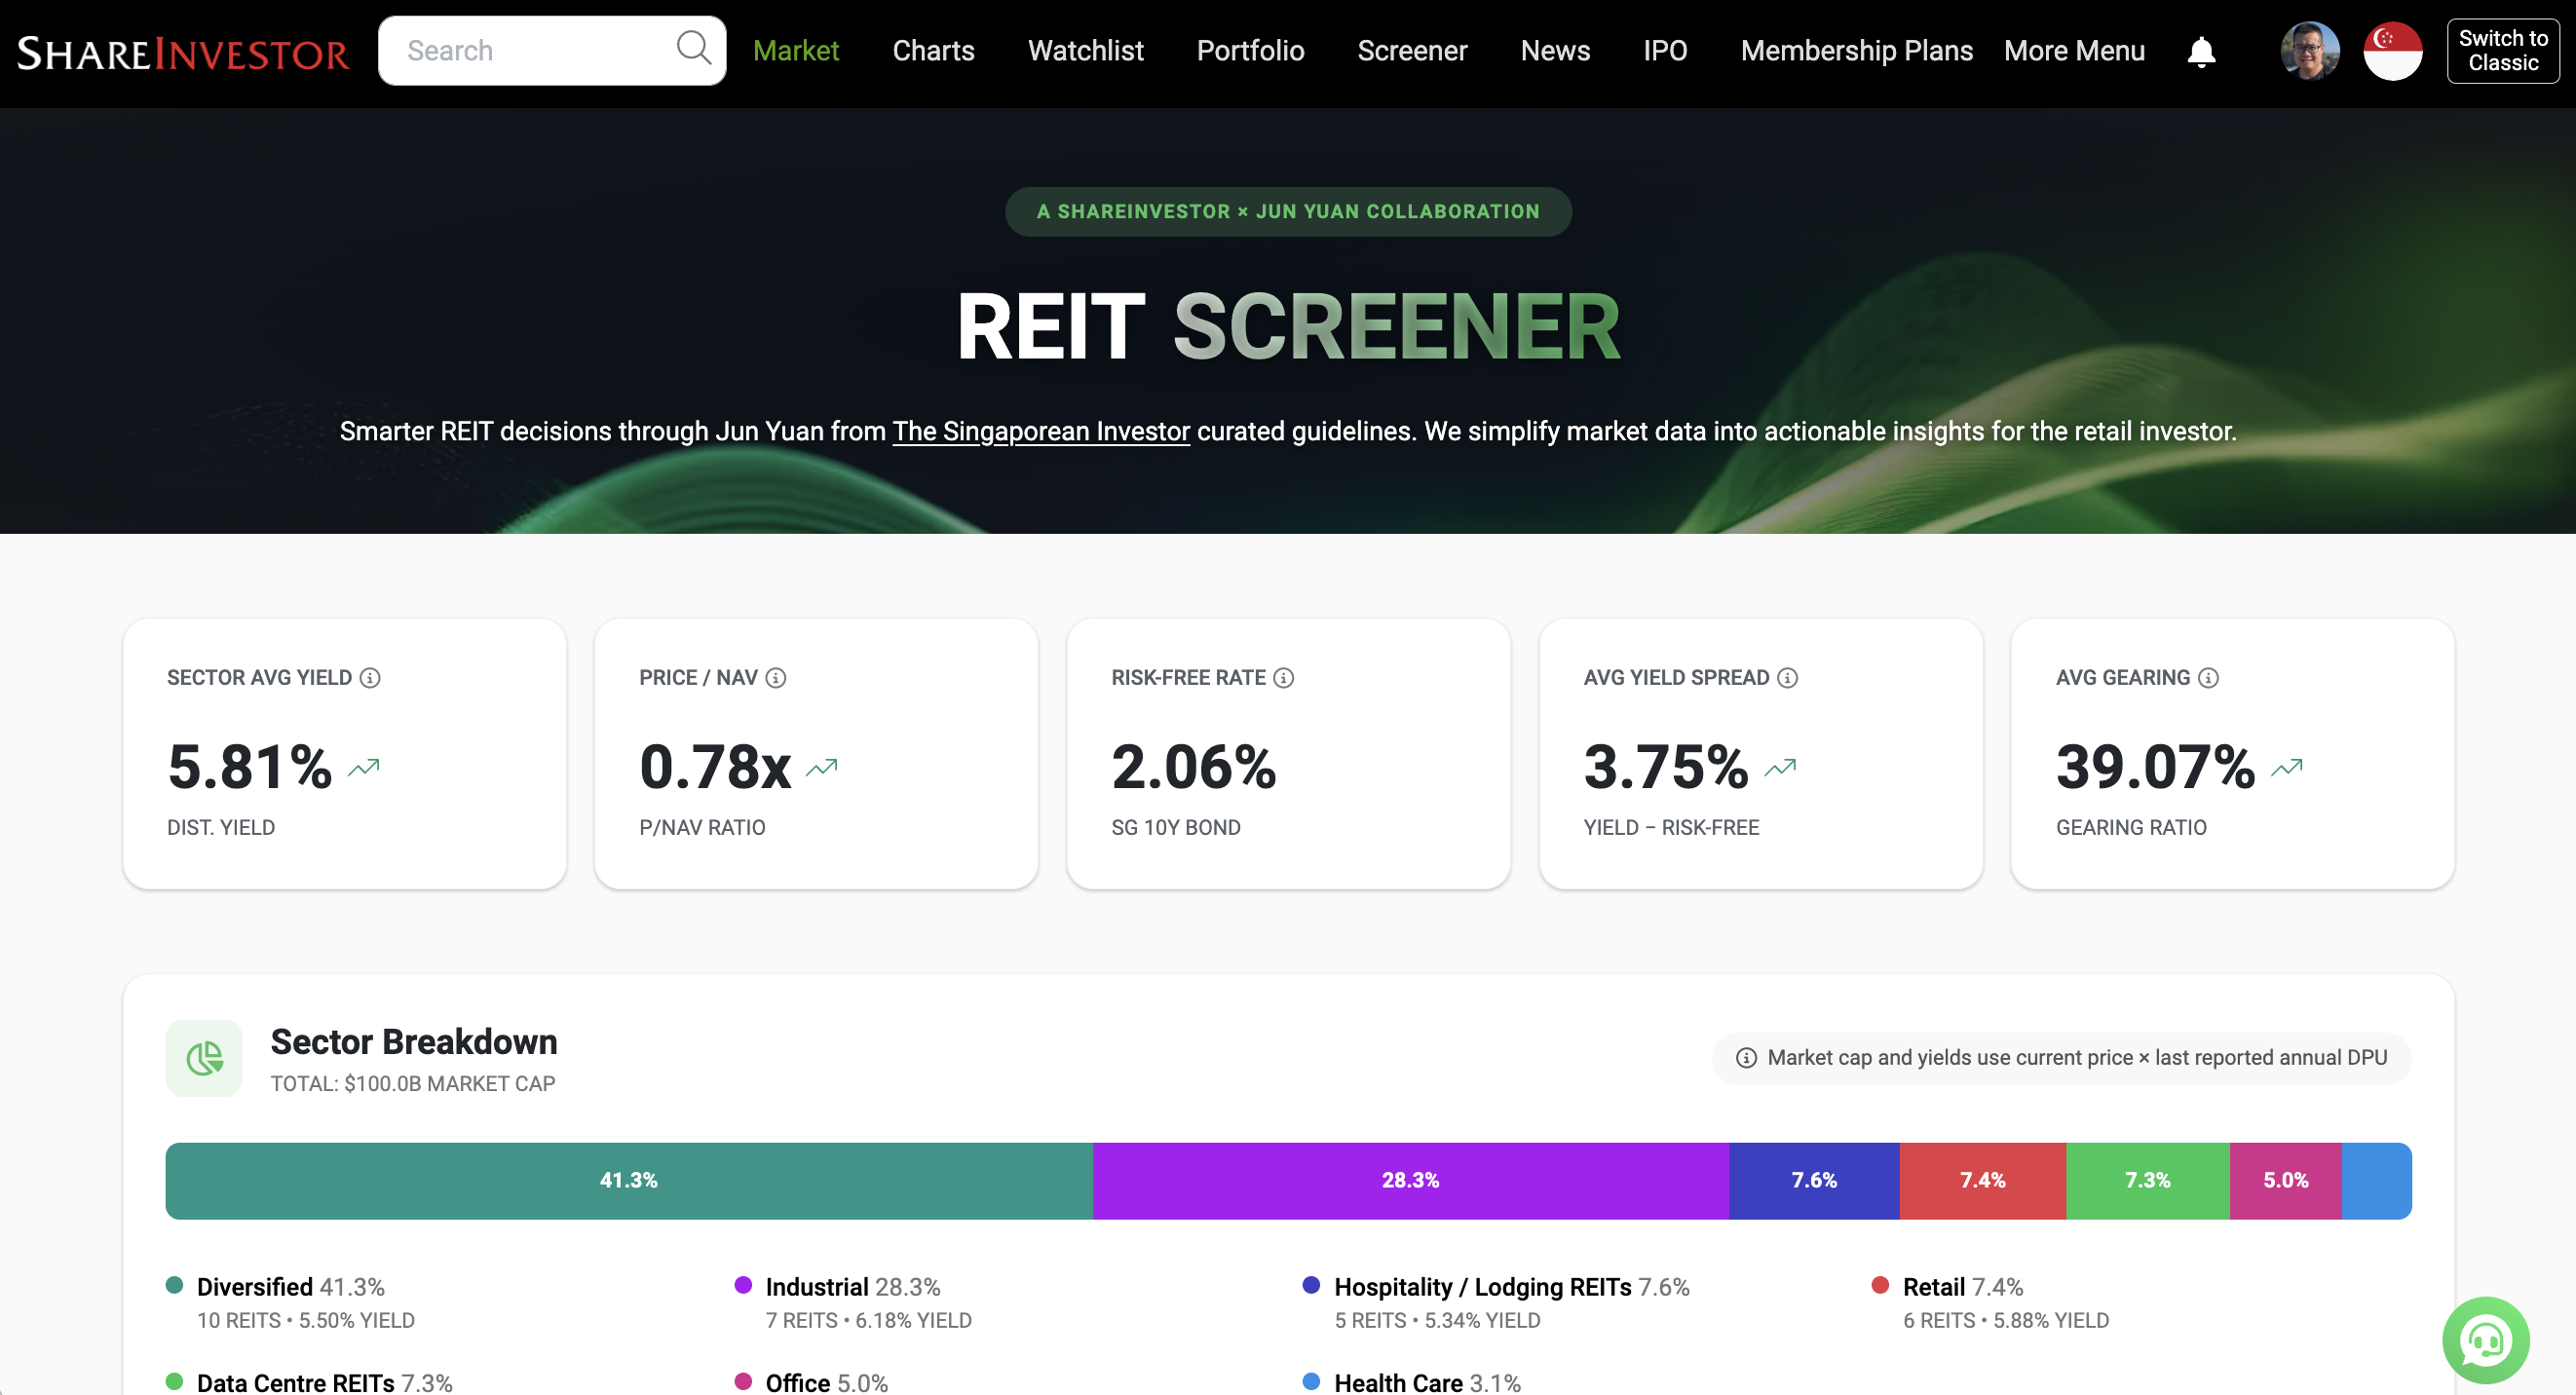
Take a closer look at the REIT Screener here...



Comments (0)