Brief Description:
CapitaLand Integrated Commercial Trust (SGX: C38U), or CICT, traces its roots back to July 2002, when it was listed as CapitaLand Mall Trust with a focus on retail properties in Singapore. In November 2020, CapitaLand Mall Trust merged with office-focused CapitaLand Commercial Trust to form CICT, which is currently Singapore’s largest listed REIT.
CICT invests primarily in income-producing commercial properties used for retail and office purposes, with Singapore as its core market. As at 30 June 2026, its portfolio comprises 21 properties in Singapore, 2 in Frankfurt, Germany, and 3 in Sydney, Australia. Collectively, these properties are valued at S$30.9 billion.
Financial Figures (9M FY2025 vs. 9M FY2026):
| 9M FY2025 | 9M FY2026 | % Variance | |
| Gross Revenue (S$’mil) | $1,191.6m | $1,311.2m | +10.0% |
| Property Operating Expenses (S$’mil) | $317.4m | $345.8m | +8.9% |
| Net Property Income (S$’mil) | $874.2m | $965.4m | +10.4% |
Gross revenue and net property income increased by 10.0% and 10.4% year on year to S$1,311.2 million and S$965.4 million respectively, mainly driven by contributions from Paragon, Gallileo and the step-up acquisition of CapitaSpring. These gains were partially offset by the loss of income contributions from Bukit Panjang Plaza and Asia Square Tower 2 following their divestments.
Financial Figures (3Q FY2025 vs. 3Q FY2026):
| Q3 FY2025 | Q3 FY2026 | % Variance | |
| Gross Revenue (S$’mil) | $404.0m | $464.5m | +15.0% |
| Property Operating Expenses (S$’mil) | $109.5m | $129.6m | +18.4% |
| Net Property Income (S$’mil) | $294.3m | $334.9m | +13.8% |
CICT delivered a strong financial performance in the 3rd quarter, with gross revenue and net property income rising 15.0% and 13.8% year on year to S$464.5 million and S$334.9 million, respectively.
The growth was primarily driven by contributions from Paragon, Gallileo and the step-up acquisition of CapitaSpring, partially offset by the divestments of Bukit Panjang Plaza on 27 February 2026 and Asia Square Tower 2 on 17 September 2026.
Portfolio Occupancy Profile (2Q FY2026 vs. 3Q FY2026):
| 2Q FY2026 | 3Q FY2026 | |
| Occupancy (Retail) (%) | 97.7% | 97.3% |
| WALE (Retail) (years) | 2.0 years | 2.0 years |
| Rental Reversion (Retail) (%) | +4.0% | +4.6% |
| Occupancy (Office) (%) | 94.4% | 95.4% |
| WALE (Office) (years) | 3.0 years | 3.0 years |
| Rental Reversion (Office) (%) | +6.5% | +7.1% |
| Occupancy (Integrated Development) (%) | 95.5% | 96.4% |
| WALE (Integrated Development) (years) | 4.4 years | 4.4 years |
CICT’s properties continue to maintain high occupancy rates of above 95%, alongside positive rental reversions for new and renewed leases of +4.6% for retail spaces and +7.1% for office spaces. These healthy leasing trends are expected to support further financial growth in the coming quarters.
In terms of lease expiries, only 1.2% of retail leases and 1.4% of office leases are due for renewal in the final quarter of FY2026. Between FY2027 and FY2029, expiries are well staggered, averaging approximately 16.4% of retail leases and 8.4% of office leases annually. The remaining 8.7% of retail leases, 10.2% of office leases and 4.2% of hospitality leases are not due for renewal until FY2030 or later.
Debt Profile (2Q FY2026 vs. 3Q FY2026):
| 2Q FY2026 | 3Q FY2026 | |
| Aggregate Leverage (%) | 37.4% | 39.7% |
| Interest Coverage Ratio (times) | 3.9x | 3.8x |
| Average Cost of Debt (%) | 2.9% | 2.8% |
| Average Term to Debt Maturity (years) | 4.1 years | 4.2 years |
| % of Borrowings Hedged at Fixed Rates (%) | 78.0% | 76.0% |
Although CICT’s aggregate leverage increased by 2.3 percentage points to 39.7%, it remains comfortably below the 50% regulatory limit imposed by the Monetary Authority of Singapore (MAS).
Its debt maturity profile is also well-staggered, with only 2% of borrowings due for refinancing in the remaining quarter of FY2026 and a further 3% in FY2027. Over FY2028 to FY2032, an average of 16% of borrowings will mature annually, while the remaining 15% is not due for refinancing until FY2033 or later.
Closing Thoughts:
In my view, CICT delivered a solid financial performance in both the 3rd quarter and the first 9 months of FY2026, with gross revenue and net property income recording double-digit growth, largely driven by contributions from Paragon, Gallileo and the step-up acquisition of CapitaSpring.
Occupancy rates across its retail, office and integrated development properties remained high at above 95%, while positive rental reversions of +4.6% for retail leases and +7.1% for office leases further underscored the strength of its leasing performance.
Although CICT’s aggregate leverage increased to 39.7%, it remains at a healthy level. Its debt maturity profile is also well staggered, with no more than 18% of borrowings due for refinancing in any given year through to FY2035, helping to manage refinancing risks.
As CICT distributes income on a semi-annual basis, no distribution was declared for the quarter under review.
Related Documents:
Reviews of Business Updates by Other CapitaLand REITs & Business Trusts:
CapitaLand Ascendas REIT (SGX: A17U): 3Q FY2026 Business Update Review
CapitaLand India Trust (SGX: CY6U): 3Q & 9M FY2026 Business Update Review
Disclaimer: At the time of writing, I am a unitholder of CapitaLand Integrated Commercial Trust.
Join Me for a FREE Live Online Chit-Chat on Thursday, 12 November, from 8–9pm (SGT)!

It's been quite some time since I last had a live chit-chat with the investing community, and I’m excited to be back for another session! A big thank you to my friend, Dinah Poehlmann from Your Finance Mind, for inviting me once again!
This time, we’re taking a little break from REITs and exploring some interesting topics surrounding investing, including my go-to investing resources, when is a stock considered 'investable', my thoughts about using AI for stock analysis and trading, and much more.
Whether you're just starting your investing journey or have been investing for years, I hope this session will offer some useful perspectives and practical takeaways that you can apply to your own investing journey.
Best of all, the session is completely FREE to attend! All you need to do is register in advance to receive the Zoom link:
👉 Click here to reserve your spot!
Stop Spending Hours Reading REIT Reports Every Quarter!
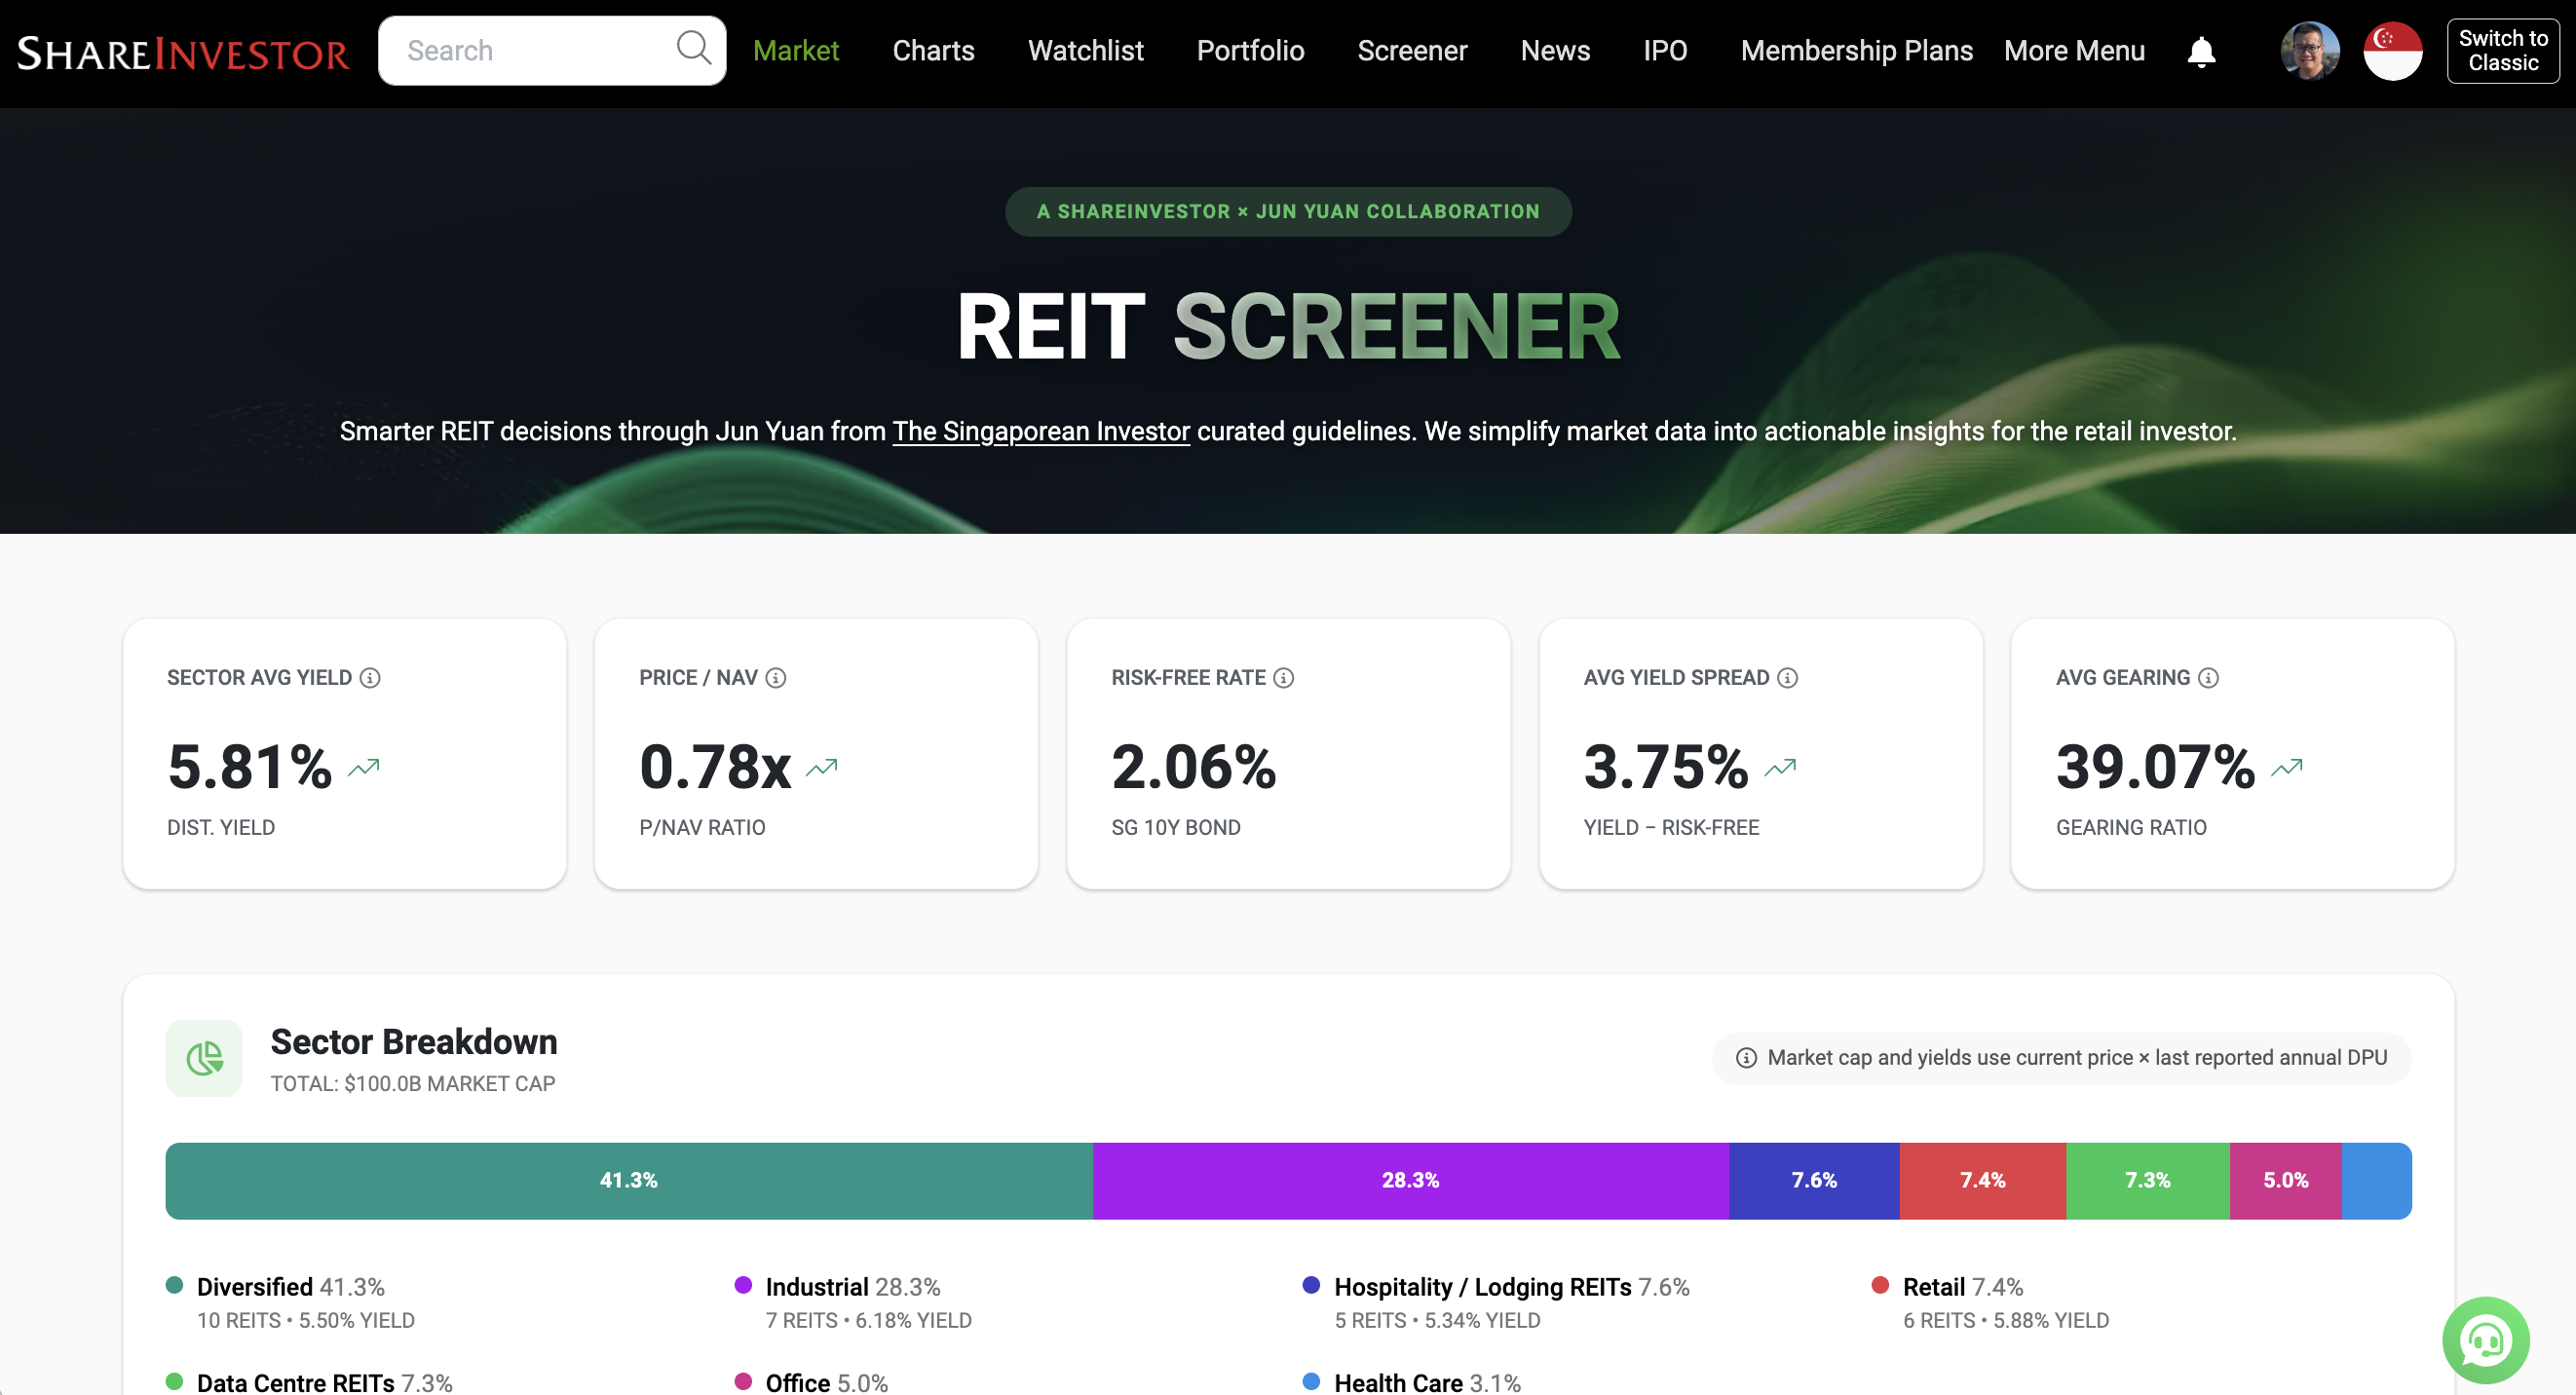
What if you could assess a REIT's portfolio occupancy, debt profile, valuation, and overall health in less than 30 seconds - without having to comb through a single quarterly report?
That's the problem the REIT Screener was built to solve.
Developed through a collaboration between ShareInvestor and The Singaporean Investor, the REIT Screener consolidates many of the key metrics and indicators I personally use when analysing REITs into one easy-to-use platform. Instead of spending hours extracting data manually every earnings season, you can now monitor the REITs you own and research new opportunities in just a few clicks.
If you're serious about REIT investing but don't have the time to manually track quarterly developments, the REIT Screener could be the shortcut you've been looking for:
Take a closer look at the REIT Screener here...



Comments (0)