To sum up what Linde Plc (NASDAQ:LIN) does in simple, layman terms, they are the world’s largest producer of industrial gas. Its customers are companies in the healthcare, chemicals and energy, manufacturing, metals and mining, food and beverage, and electronics sectors.
To go into more detail about the US-listed company’s operations, its products include atmospheric gases (oxygen, nitrogen, argon, and rare gases), process gases (carbon dioxide, helium, hydrogen, electronic gases, specialty gases, acetylene, etc.) On top of that, Linde Plc also designs and builds equipment that produces industrial gases and offers customers a wide range of gas production and processing services such as olefin plants, natural gas plants, air separation plants, hydrogen and synthesis plants, and other types of plants.
The company is one of the constituents in the S&P 500 index, and under the SPDR Basic Materials ETF (NYSE ARCA:XLB) – in fact, the company holds the heaviest weightage in the ETF at the time of writing, at close to 22%. As such, any positive or negative movements in the company’s share price will have an impact on the ETF’s movement.
In this post, you will find researches I have done about the company – particularly, its financial performance, debt profile, and dividend payout to shareholders over the last 5 years (between FY2018 and FY2020 – the company has a financial year end every 31 December) – all of which I will be sharing with you in today’s post, together with whether or not the company’s current traded price is considered ‘cheap’ or ‘expensive’.
Let’s get started…
Financial Performance
In this section, you will find Linde Plc’s total revenue and net profit, gross and net profit margin, and return on equity over the last 5 financial years:
Total Revenue & Net Profit:
| FY2018 | FY2019 | FY2020 | FY2021 | FY2022 | |
| Total Revenue (US$’mil) | $14,836m | $28,228m | $27,243m | $30,793m | $33,364m |
| Net Profit (US$’mil) | $4,381m | $2,285m | $2,501m | $3,826m | $4,147m |
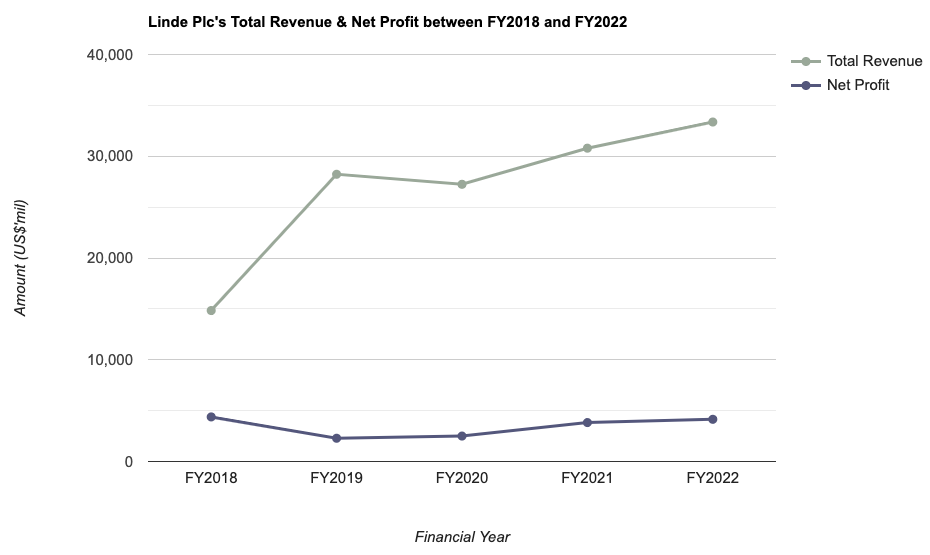
The company’s total revenue and net profit saw year-on-year improvements in 4 out of 5 years I have looked at.
For its total revenue, the only year which recorded a decline was in FY2020, due to a 2% decline in revenue as a result of global macroeconomic slowdown from the Covid-19 pandemic. For its net profit, it fell by close to 48% in FY2019, which can be attributed to a lack of gain on merger-related divestitures made in the preceding year.
In terms of the compound annual growth rate (CAGR) of its total revenue and net profit over a 5-year period, the former grew at a decent 17.6%, while for the latter, it was at a negative 1.1% (this was due to a high net profit recorded in FY2018 as a result of a gain on merger-related divestitures). However, if you were to just compute the CAGR based on results recorded between FY2019 and FY2022 (a period of 4 years), then it is at a good 16.1%.
Gross & Net Profit Margins:
The following table is Linde Plc’s gross and net profit margins I have computed:
| FY2018 | FY2019 | FY2020 | FY2021 | FY2022 | |
| Gross Profit Margin (%) | 39.2% | 41.0% | 43.5% | 43.0% | 41.7% |
| Net Profit Margin (%) | 29.5% | 8.1% | 9.2% | 12.4% | 12.4% |
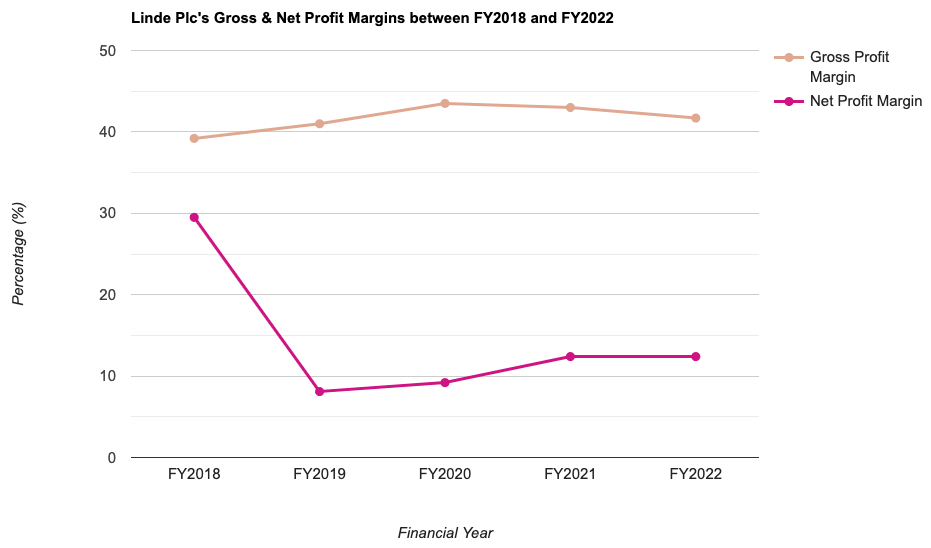
The company’s gross profit margin have slid in successive years (between FY2020 and FY2022) where it fell from a high of 43.5% in FY2020 (the highest in 5 years) to 41.7% in FY2022 (the latest financial year under review). It is something I will continue to monitor in its upcoming full year results (which will be out in early-February 2024).
Excluding the net profit margin recorded in FY2018 (where the amount was inclusive of gain from merger-related divestitures), the remaining years saw its net profit margin recording improvements.
Return on Equity:
For those who may be unfamiliar with what Return on Equity (or RoE for short) is, to explain in layman terms, it is a measure of a company’s profitability (in percentage terms) for every dollar of shareholders’ money it uses in its businesses.
The following table is Linde Plc’s RoE over the last 5 years which I have computed:
| FY2018 | FY2019 | FY2020 | FY2021 | FY2022 | |
| Return on Equity (%) | 8.5% | 4.7% | 5.3% | 8.7% | 10.4% |
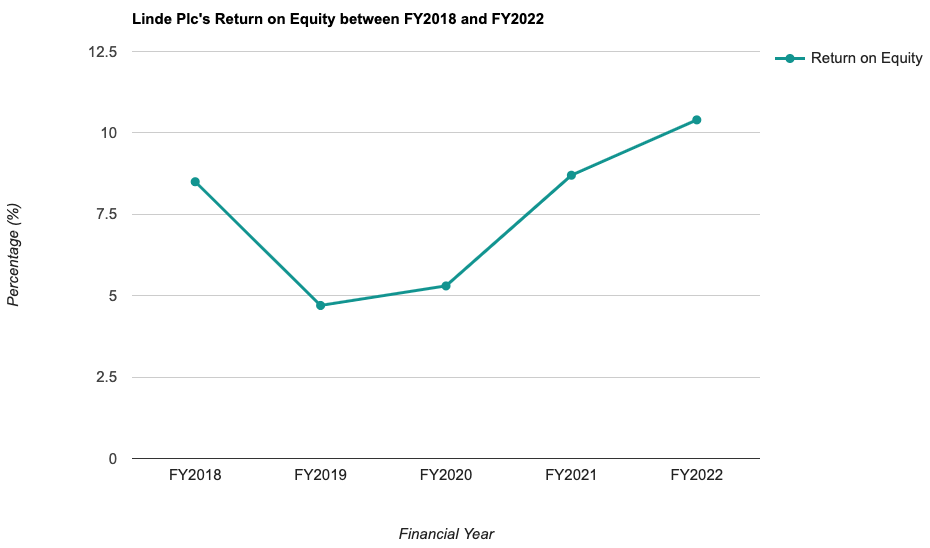
Apart from FY2018, where the RoE was inclusive of a divestment gain, the following years saw the company’s RoE recording gradual improvements; particularly, its RoE, at 10.4% in FY2022, was the highest in 5 years.
Debt Profile
Whenever I conduct a research about a particular company, besides its financial performance, another area of focus is on its debt profile – especially in the current high interest rate environment, coupled with the US Federal Reserve signalling for a higher for longer interest rate in order to bring inflation down to 2.0%, it becomes all the more important to make sure that the company is not overly leveraged.
With that, here’s Linde Plc’s debt profile recorded over the last 5 years (between FY2018 and FY2022) in the table below:
| FY2018 | FY2019 | FY2020 | FY2021 | FY2022 | |
| Cash & Cash Equivalent (US$’mil) | $4,466m | $2,700m | $3,754m | $2,823m | $5,436m |
| Total Borrowings (US$’mil) | $13,773m | $12,425m | $15,403m | $12,498m | $16,315m |
| Net Cash/ Debt (US$’mil) | -$9,307m | -$9,725m | -$11,649m | -$9,675m | -$10,879m |
| Current Ratio | 1.3 | 0.9 | 0.8 | 0.7 | 0.8 |
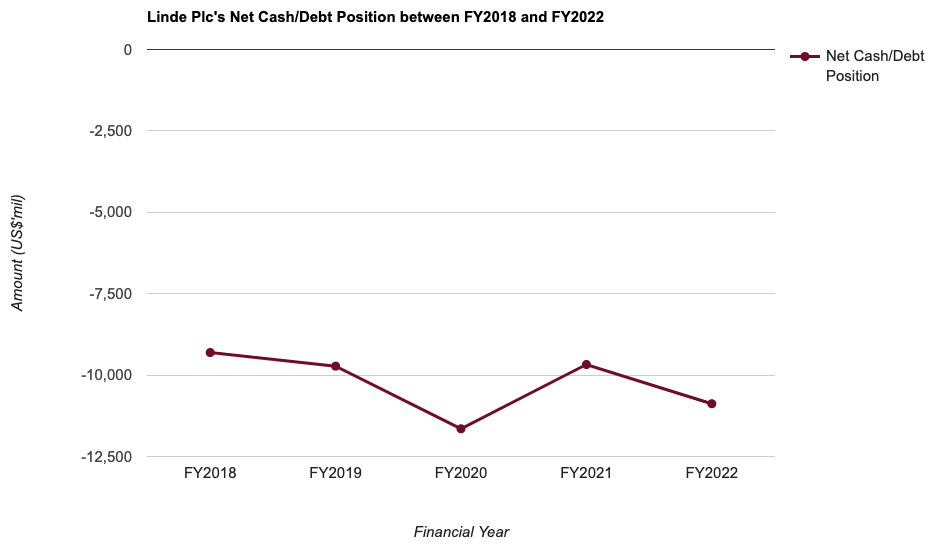
2 things to note here – the company is in a net debt position throughout the entire 5-year period; also, its current ratio is under 1.0 between FY2019 and FY2022 – this implies that it may have difficulties in fulfilling any short-term debt obligations if it is required to do so.
Dividend Payout to Shareholders
The management of Linde Plc declares a dividend payout to its shareholders on a quarterly basis.
The following table is the company’s dividend payout over the last 5 years (between FY2018 and FY2022):
| FY2018 | FY2019 | FY2020 | FY2021 | FY2022 | |
| Dividend Per Share (US$) | $3.30 | $3.50 | $3.85 | $4.24 | $4.68 |
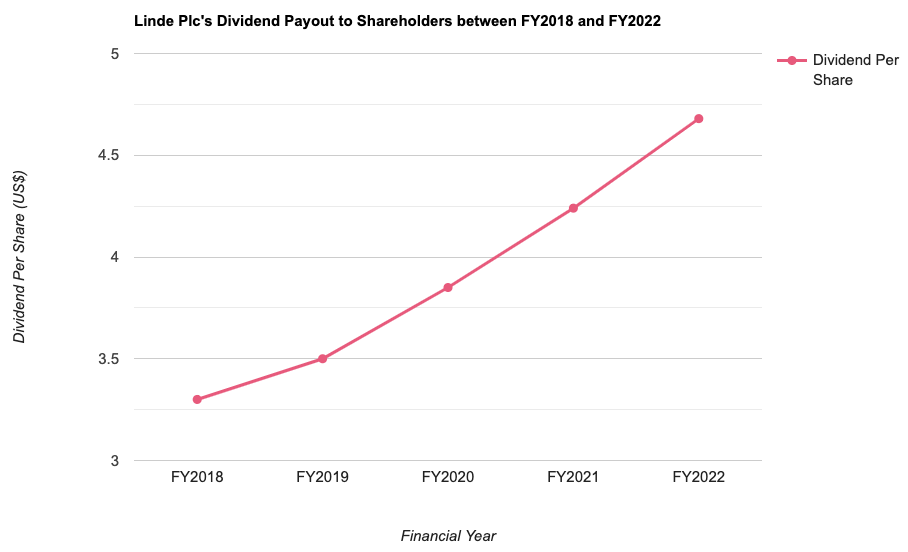
Linde Plc’s dividend payout has been on a rise every single year over the last 5 years. In terms of increment, apart from FY2019, the other years saw the company increasing its dividend payout by about 10%.
Also, over a 5-year period, the company’s dividend payout have grown at a CAGR of 7.2%.
Is the Current Traded Price of Linde Plc Considered ‘Cheap’ or ‘Expensive’?
This is the question on everyone’s minds – whether the current traded price is considered ‘cheap’ or ‘expensive’.
How I answer this question is to take the current valuations of the company (based on its current traded price of US$412.09 as at market close on 19 December 2023) and compare them against its average valuations (recorded over the last 5 years n this case), and you can find them in the table below:
| Current | 5-Year Average | |
| P/S Ratio | 6.24 | 5.1 |
| P/B Ratio | 5.10 | 3.0 |
| Dividend Yield | 1.1%^^ | 1.6% |
Looking at the above, it is obvious that the current traded price of Linde Plc is considered ‘expensive’, due to a higher current P/S and P/B ratios, and at the same time, a higher current dividend yield compared against its 5-year average.
Finally, for those who are wondering what is the ‘fair value’ price of the company, based on its 5-year average valuations, it is at US$296.98 – hence, at its current traded price of US$412.09, it is trading at a 27.9% premium.
Closing Thoughts
Some of the aspects about Linde Plc I find desirable is its stable growth in terms of its total revenue and net profit, its return on equity, and also its dividend payout to shareholders (for income investors, I’m sure this is something you’ll agree as well).
On the other hand, its declining gross profit in recent years (where it has fallen from a high of 43.5% in FY2020 to 41.7%), along with the company being in a net debt position, coupled with the fact that its current ratio is under 1.0 (implying it could have difficulties in fulfilling its short-term debt obligations) is something I am not too comfortable with.
Another thing to note is that, at its current traded price of US$412.09, it is also considered to be ‘expensive’ if I were to compare its current valuations against its valuations over the last 5 years.
With that, I have come to the end of my share about the US-listed Linde Plc. I hope the contents above have given you a better understanding of the company’s businesses, and also its financial performances, debt profile, and dividend payout. However, do note that everything I have just shared is purely for educational purposes only. You should always do your own due diligence before you make any investment decisions.
Disclaimer: At the time of writing, I do not have shares of Linde Plc.
Are You Worried about Not Having Enough Money for Retirement?
You're not alone. According to the OCBC Financial Wellness Index, only 62% of people in their 20s and 56% of people in their 30s are confident that they will have enough money to retire.
But there is still time to take action. One way to ensure that you have a comfortable retirement is to invest in real estate investment trusts (REITs).
In 'Building Your REIT-irement Portfolio' which I've authored, you will learn everything you need to know to build a successful REIT investment portfolio, including a list of 9 things to look at to determine whether a REIT is worthy of your investment, 1 simple method to help you maximise your returns from your REIT investment, 4 signs of 'red flags' to look out for and what you can do as a shareholder, and more!

You can find out more about the book, and grab your copy (ebook or physical book) here...


Comments (0)