Whenever I shortlist for a list of companies to invest in, one of my many criteria is that the company must have a simple-to-understand business.
One of the companies under my investment radar is social media conglomerate Facebook Inc. (NASDAQ:FB), which is listed in the United States.
Unless you have been living under a rock all these while, you should know its business – chief of which is its namesake social networking site (many of you should have a personal Facebook account which you use to keep in touch with your loved ones.)
Apart from Facebook, the conglomerate also owns Instagram, Messenger, as well as WhatsApp – all of them you should be familiar with as well, so I shall not further elaborate. Another business which it owns which you may not be familiar with is a company by the name of Oculus (https://www.oculus.com), which produces virtual reality products (the company was acquired by Facebook Inc. in March 2014.)
In terms of revenue, it comes from selling ad placements (on Facebook, Instagram, Messenger, and other third-party applications and websites) to marketers (where they have the option of selecting their target audiences based on a variety of factors including age, gender, location, interests, and behaviours.)
In this post, you will learn about the conglomerate’s historical financial performance, as well as its debt profile over a five year period (between FY2015 and FY2019), along with a look at its historical valuations (over a 5-year period as well), and comparing against its current valuations (based on its current traded price) to find out whether or not the current price of Facebook is trading at a discount or at a premium.
Let’s get started…
Historical Financial Performance of Facebook Inc. over the Past 5 Years
Facebook Inc. has a financial year-end on 31 December, and in this section, I will be taking a look at some of the key financial figures of the conglomerate recorded over the past 5 years – from FY2015 to FY2019:
Total Revenue and Net Profit (US$’mil):
| FY2015 | FY2016 | FY2017 | FY2018 | FY2019 | |
| Total Revenue (US$’mil) | $17,928m | $27,638m | $40,653m | $55,838m | $70,697m |
| Net Profit (US$’mil) | $3,669m | $10,188m | $15,920m | $22,111m | $18,485m |
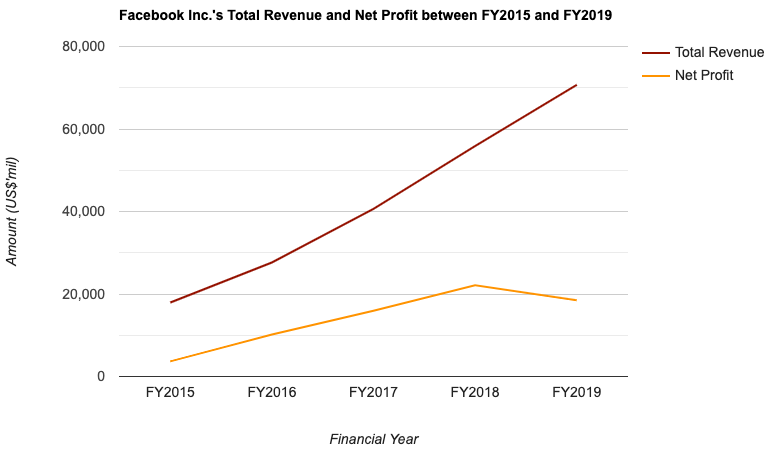
Facebook Inc.’s total revenue saw year-on-year (y-o-y) improvements every single year over the past five years, growing at a compound annual growth rate (or CAGR) of 31.6%.
As for its net profit, even though it suffered a 16.4% y-o-y dip in FY2019, all the remaining 4 years saw the conglomerate record y-o-y growth. More importantly, over a 5-year period, its net profit saw an impressive CAGR of 38.2%!
Gross and Net Profit Margin (%):
| FY2015 | FY2016 | FY2017 | FY2018 | FY2019 | |
| Gross Profit Margin (%) | 84.0% | 86.3% | 86.6% | 83.2% | 81.9% |
| Net Profit Margin (%) | 20.5% | 36.9% | 39.2% | 39.6% | 26.1% |
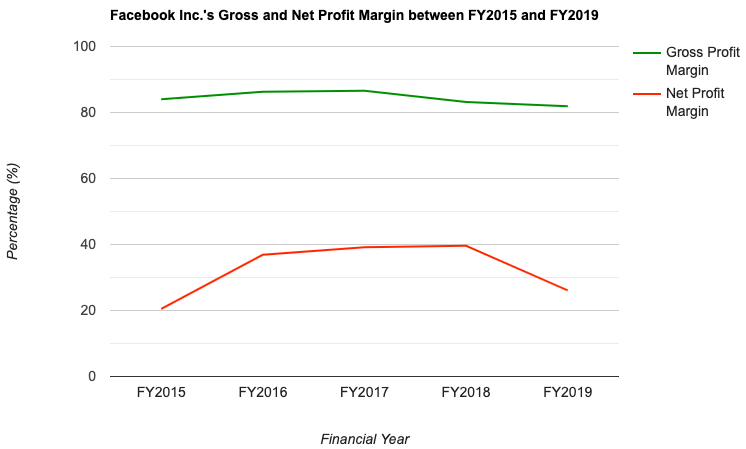
Even though the conglomerate’s gross profit margin slipped in FY2018 and FY2019 after reaching a high of 86.6% in FY2019, personally, I feel there is no cause for concern as its gross profit margin continues to be maintained at 80.0% over a 5-year period.
As for its net profit margin, other than a 13.5 percentage point y-o-y drop in FY2019, all the other years saw improvements. Unless its net profit continues to go on a downward slide over the next few years, I am not too concerned personally.
Return on Equity (%):
Return on Equity (or RoE), represented in percentage-terms, in layman terms, is a measure of the amount of profits the company is able to generate for every dollar of shareholders’ money it uses in its businesses (for instance, if the company’s RoE is 15.0%, it means the company is able to generate a $15 profit for every $100 of shareholders’ money it uses in its businesses.)
Now, let use take a look at Facebook Inc.’s RoE which I have computed over the past 5-years:
| FY2015 | FY2016 | FY2017 | FY2018 | FY2019 | |
| Return on Equity (%) | 8.3% | 17.2% | 21.4% | 26.3% | 18.3% |
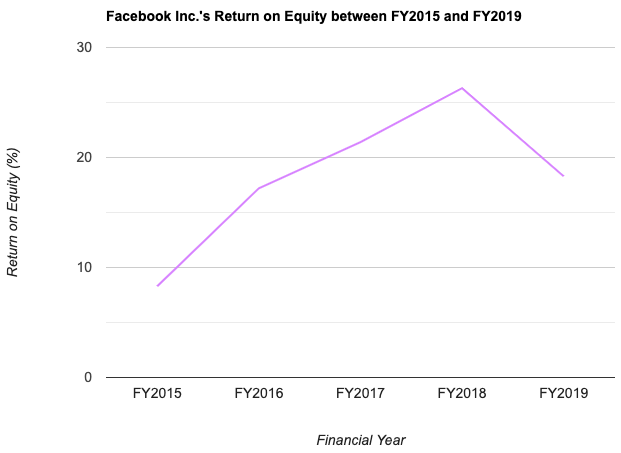
Other than a drop in FY2019, the remaining four years I have looked at saw Facebook Inc.’s RoE recording y-o-y improvements.
Facebook Inc.’s Debt Profile between FY2015 and FY2019
Apart from an improving set of top- and bottom-line (over the last 5 years), I will also only invest my money in companies with little or no debt. Facebook Inc. meets this criteria of mine as it has zero borrowings over the past 5 years. Therefore, the conglomerate is in a net cash position throughout the five years I have looked at:
| FY2015 | FY2016 | FY2017 | FY2018 | FY2019 | |
| Net Cash (US$’mil) | $4,907m | $9,109m | $8,204m | $10,124m | $19,279m |
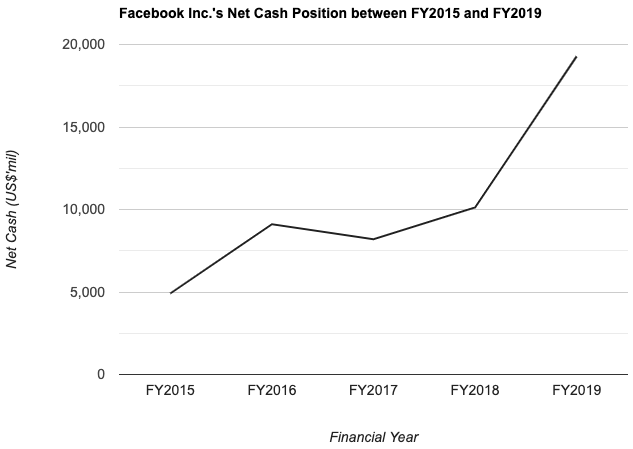
Other than in FY2017, all the other years I have looked at saw the conglomerate’s net cash position recording improvements on a y-o-y basis, and as far as I am concerned, I am happy to see growths like that.
Facebook Inc.’s Key Financial Statistics for 1H FY2020 (Compared against 1H FY2019)
On 30 July 2020, the social media conglomerate released its 1H FY2020 results for the period between 01 January and 30 June 2020.
In this section, let us take a look at some of the key financial statistics, compared against the same period last year (i.e. 1H FY2019) to find out if they have improved or deteriorated:
| 1H FY2019 | 1H FY2020 | % Variance | |
| Total Revenue (US$’mil) | $31,963m | $36,424m | +14.0% |
| Net Profit (US$’mil) | $5,045m | $10,080m | +99.8% |
| Gross Profit Margin (%) | 80.8% | 80.0% | |
| Net Profit Margin (%) | 15.8% | 27.7% | |
| Total Borrowings (US$’mil) | – | – | |
| Net Cash/Debt (US$’mil) | $13,998m | $21,569m | +54.1% |
Looking at the table above, I am sure you will share the same sentiments with me that its most recent set of results is a fantastic one.
The 14.0% y-o-y improvement in the conglomerate’s total revenue is due to an increase in ad revenues as a result of an increase in the number of ads delivered. Also, its net profit saw an impressive 99.8% y-o-y jump to US$10,080m.
Also, just like in the previous years, as at the end of 1H FY2020, the conglomerate does not have any borrowings, with its net cash position improving by 54.1% on a y-o-y basis to US$21,569m.
The only slight negative in its latest set of results is the 0.8 percentage point dip in its gross profit margin.
Facebook Inc.’s Dividend Payout to Shareholders
Over a 5-year period, Facebook Inc. did not declare a dividend payout to its shareholders.
Is Facebook Inc’s Current Share Price Considered Cheap or Expensive?
One of the ways I use to determine whether or not a company’s share price is considered cheap or expensive is to take its current valuations (based on its current share price) and compare against its average valuations over the years.
The following is Facebook Inc.’s P/E and P/B ratios over a 5-year period (between FY2015 and FY2019) which I have computed – Do note that I have omitted dividend yield here as the conglomerate does not declare any dividend payout for its shareholders:
| FY2015 | FY2016 | FY2017 | FY2018 | FY2019 | Average | |
| P/E Ratio | 81.1 | 33.0 | 32.7 | 17.3 | 31.9 | 39.2 |
| P/B Ratio | 6.7 | 5.6 | 6.9 | 4.4 | 5.8 | 5.9 |
At the time of writing, the share price of Facebook Inc. is trading at US$303.91, and as such, its current P/E and P/B ratios are as follows:
P/E ratio: 36.8
P/B ratio: 7.8
Comparing its current P/E and P/B ratios against its 5-year average, while its current P/B ratio is slightly higher than its average, its current P/E ratio is slightly lower than its average; hence, you can say that the current share price of Facebook Inc. is neither cheap nor expensive.
In Conclusion
After looking at the social media conglomerate’s historical financial performance, as well as its current year results (so far), I conclude that it has been an impressive one.
However, as investors, we need to bear in mind that past performance is not indicative of future results. There are events which may negatively impact the conglomerate’s performances down the road – some of them include negative press reports regarding user data protection, or competition from other companies which may compress its ad revenue.
Finally, do take note that this post is by no means a recommendation for you to buy or sell shares of Facebook Inc. I am sharing my analysis of the conglomerate for educational purposes only. Please do your own due diligence before you make any investment decisions.
Disclaimer: At the time of writing, I am not a shareholder of Facebook Inc.
Are You Worried about Not Having Enough Money for Retirement?
You're not alone. According to the OCBC Financial Wellness Index, only 62% of people in their 20s and 56% of people in their 30s are confident that they will have enough money to retire.
But there is still time to take action. One way to ensure that you have a comfortable retirement is to invest in real estate investment trusts (REITs).
In 'Building Your REIT-irement Portfolio' which I've authored, you will learn everything you need to know to build a successful REIT investment portfolio, including a list of 9 things to look at to determine whether a REIT is worthy of your investment, 1 simple method to help you maximise your returns from your REIT investment, 4 signs of 'red flags' to look out for and what you can do as a shareholder, and more!

You can find out more about the book, and grab your copy (ebook or physical book) here...


Comments (0)