Yesterday, I did a writeup on Koufu, where I focused on its historical financial results and dividend payouts, as well as shared some of the catalysts and threats which may impact the business ahead, and whether or not its current share price is considered cheap (or not) based on its current vs. its historical valuations. In case you’ve missed the writeup, you can check it out here.
Today, I’d like to focus on the share price movements of Koufu from a technical analysis perspective. For ease of viewing, all my charts are based on a weekly timeframe.
First, let us take a look at the share price movements of Koufu since its IPO on 18 July 2018:
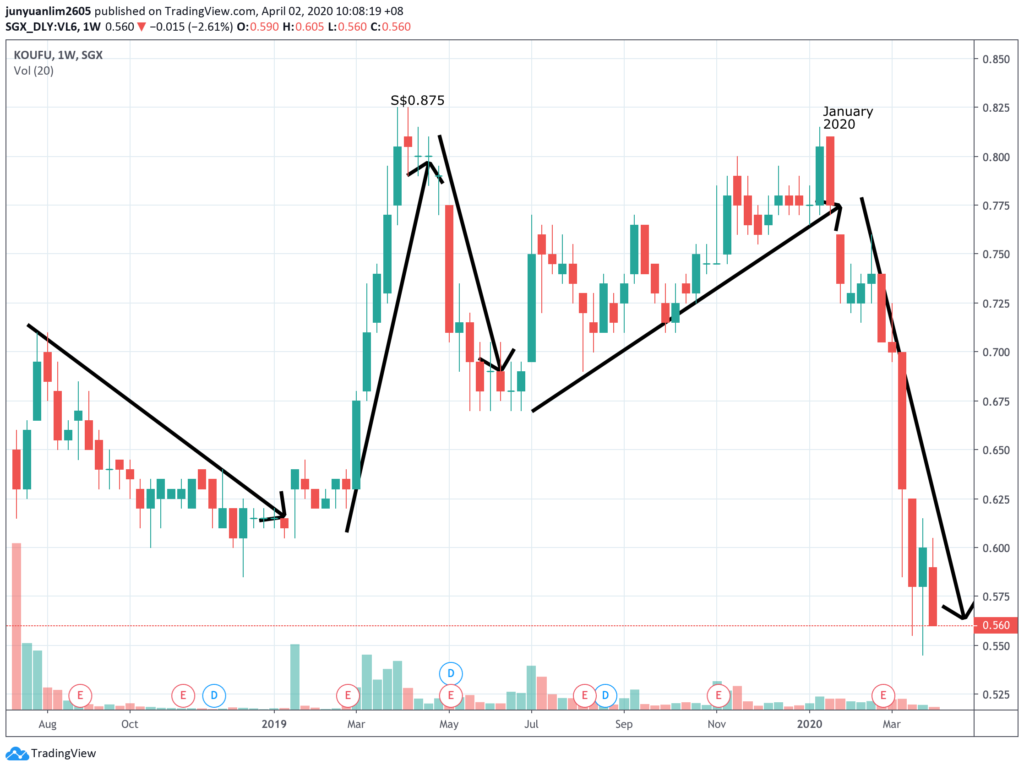
Koufu’s share price saw a series of up and down movements since its listing – where the highest the share price went was S$0.825 in April 2019. The share price climb to around this range in January 2020 before plunging down to its current share price at S$0.560.
Now, let me identify some of the support and resistance lines, along with uptrend/downtrend lines which I’ve spotted, which you can find in the image below:
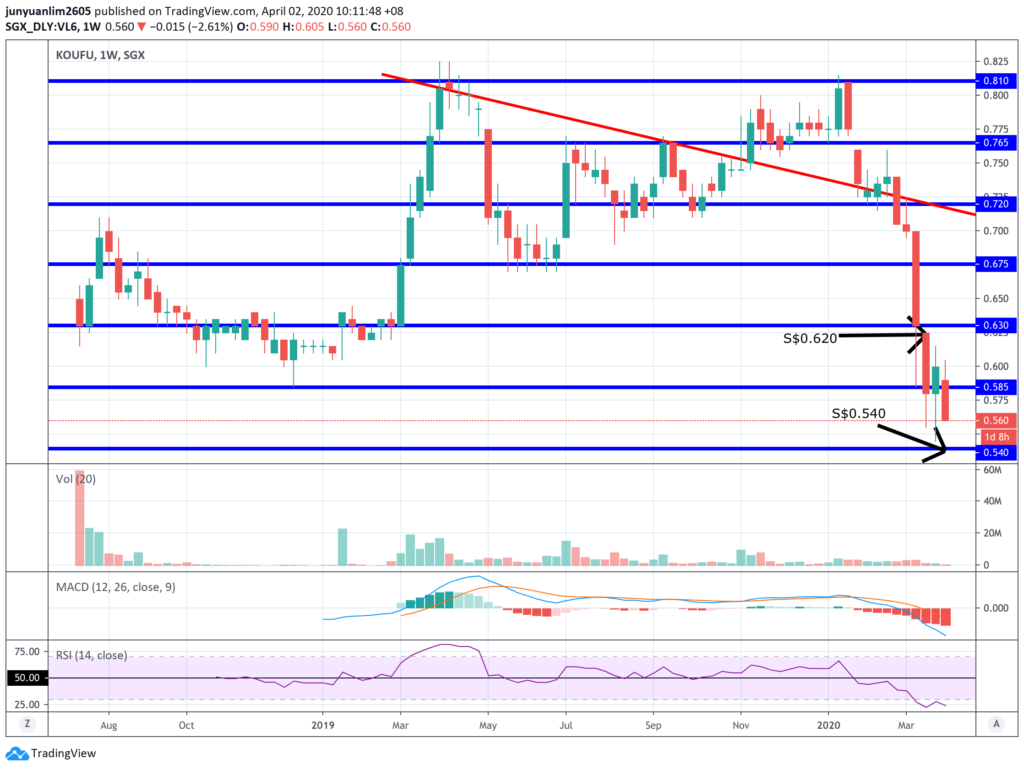
As you can see from the image above, the most recent weekly candlestick, along with MACD and RSI suggests that the share price may be heading to the support line at S$0.540.
If you’re looking to invest in the company for the long-term, my personal opinion is that, you can consider investing in the company when the share price comes down to the support line at S$0.540.
However, if you’re looking to short-term trade in this one, or you’re looking to buy only when the trend reverses, you may want to wait for the weekly candlestick to break above the red bearish candlestick at S$0.620, and above the resistance line at S$0.630.
That said, the above is my personal opinion. Please do your own due diligence before you make any investment or trading decisions.
Disclaimer: At the time of writing, I am not a shareholder of Koufu Limited.
Join Me for a FREE Live Online Chit-Chat on Thursday, 12 November, from 8–9pm (SGT)!

It's been quite some time since I last had a live chit-chat with the investing community, and I’m excited to be back for another session! A big thank you to my friend, Dinah Poehlmann from Your Finance Mind, for inviting me once again!
This time, we’re taking a little break from REITs and exploring some interesting topics surrounding investing, including my go-to investing resources, when is a stock considered 'investable', my thoughts about using AI for stock analysis and trading, and much more.
Whether you're just starting your investing journey or have been investing for years, I hope this session will offer some useful perspectives and practical takeaways that you can apply to your own investing journey.
Best of all, the session is completely FREE to attend! All you need to do is register in advance to receive the Zoom link:
👉 Click here to reserve your spot!
Are You Worried about Not Having Enough Money for Retirement?
You're not alone. According to the OCBC Financial Wellness Index, only 62% of people in their 20s and 56% of people in their 30s are confident that they will have enough money to retire.
But there is still time to take action. One way to ensure that you have a comfortable retirement is to invest in real estate investment trusts (REITs).
In 'Building Your REIT-irement Portfolio' which I've authored, you will learn everything you need to know to build a successful REIT investment portfolio, including a list of 9 things to look at to determine whether a REIT is worthy of your investment, 1 simple method to help you maximise your returns from your REIT investment, 4 signs of 'red flags' to look out for and what you can do as a shareholder, and more!

You can find out more about the book, and grab your copy (ebook or physical book) here...



Comments (0)