In case you are wondering, this company has nothing to do with balls.
Ball Corporation (NYSE:BALL) is one of the world’s leading suppliers of aluminium packaging for beverage, personal care, and household products. Its product line comprises aluminium beverage containers [which happens to be the company’s largest product line, and from my researches, one of its customers is The Coca-Cola Company], extruded aluminium aerosol containers, re-closable aluminium bottles, etc.
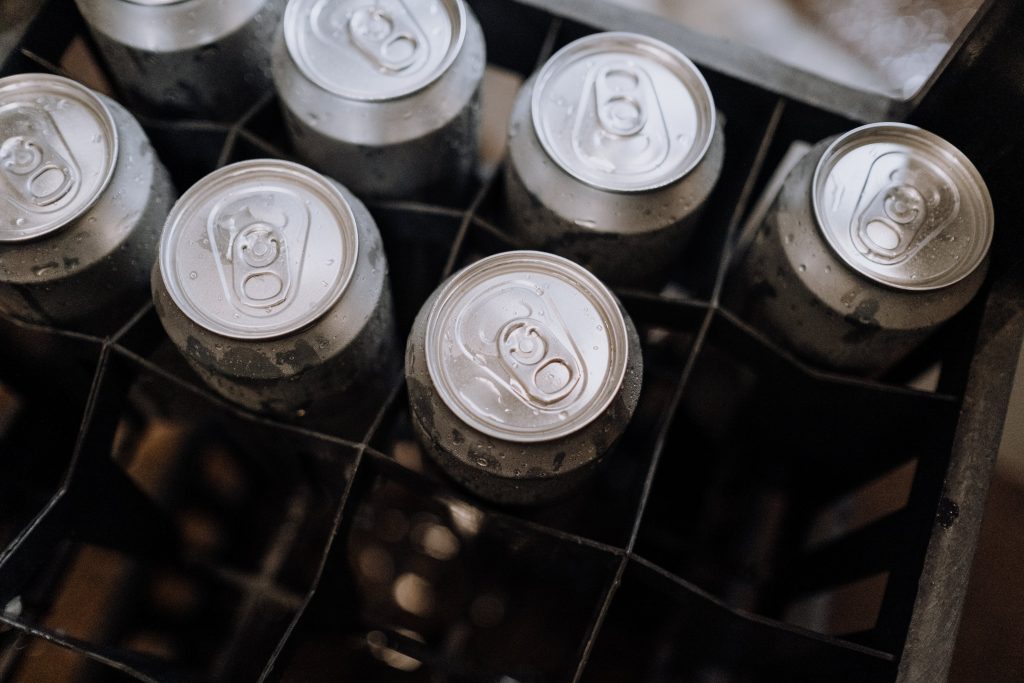
Ball Corporation’s Largest Product Line is Aluminium Beverage Containers
On top of that, it is also in the aerospace business, where the company produces spacecraft, instruments and sensors, radio frequency systems and components, data exploitation solutions, and a variety of advanced technologies and products that enable weather prediction and climate change monitoring, as well as deep space missions. One of its customers from my understanding is the US government.
In terms of revenue contribution from the 2 business segments, Ball Corporation’s packaging business was responsible for 87% of its total revenue in FY2022 (ended 31 December 2022), while its aerospace business contributed the remaining 13%.
Now that you have some understanding of the company’s businesses, in the rest of this article, you will find my review of its historical financial performance, debt profile, as well as dividend payout (the period I will be looking at is between FY2015 and FY2022 – 8 financial years in total), whether the current traded price is considered to be ‘cheap’ or ‘expensive’, and also the company’s ‘fair value’ price (based on my computation from the company’s 8-year valuations).
Let’s begin:
Financial Performance
In this section, you will find Ball Corporation’s total revenue and net profit, gross and net profit margin, as well as its return on equity over the last 8 years:
Total Revenue & Net Profit:
| FY2015 | FY2016 | FY2017 | FY2018 | |
| Total Revenue (US$’mil) | $7,997m | $9,061m | $10,983m | $11,635m |
| Net Profit (US$’mil) | $281m | $263m | $374m | $454m |
| FY2019 | FY2020 | FY2021 | FY2022 | |
| Total Revenue (US$’mil) | $11,474m | $11,781m | $13,811m | $15,349m |
| Net Profit (US$’mil) | $566m | $585m | $878m | $719m |
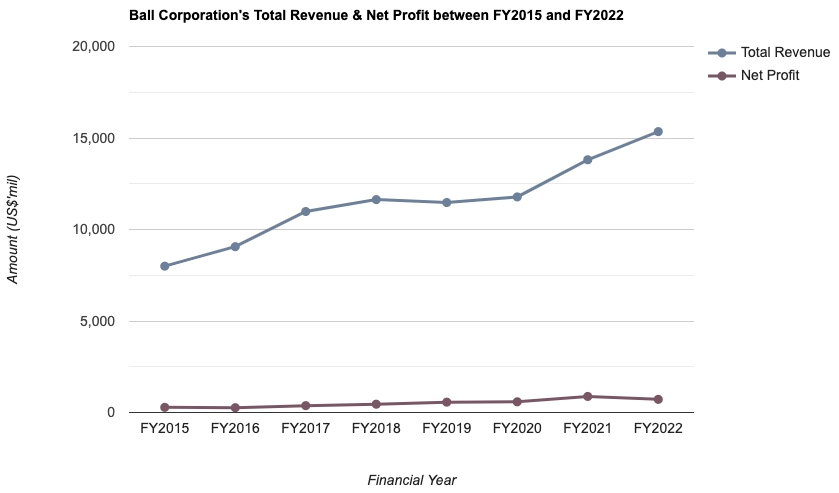
My Observations: I would like to think that the growth of its total revenue and net profit over the last 8 years have been pretty stable – where they grew at a compound annual growth rate (CAGR) of 8.5% and 12.5% respectively.
Total revenue saw year-on-year (y-o-y) improvements in 8 out of 9 years – the only year which saw the company’s total revenue declined was in FY2019, by a mere 1.4%.
Net profit recorded y-o-y declines in 2 out of 9 years – in FY2016 and in FY2022, by -6.1% and -18.1% respectively, due to charges for business consolidation, and other non-comparable items.
Gross & Net Profit Margins:
| FY2015 | FY2016 | FY2017 | FY2018 | |
| Gross Profit Margin (%) | 19.2% | 19.5% | 20.6% | 19.8% |
| Net Profit Margin (%) | 3.5% | 2.9% | 3.4% | 3.9% |
| FY2019 | FY2020 | FY2021 | FY2022 | |
| Gross Profit Margin (%) | 19.8% | 20.9% | 19.7% | 16.8% |
| Net Profit Margin (%) | 4.9% | 5.0% | 6.4% | 4.7% |
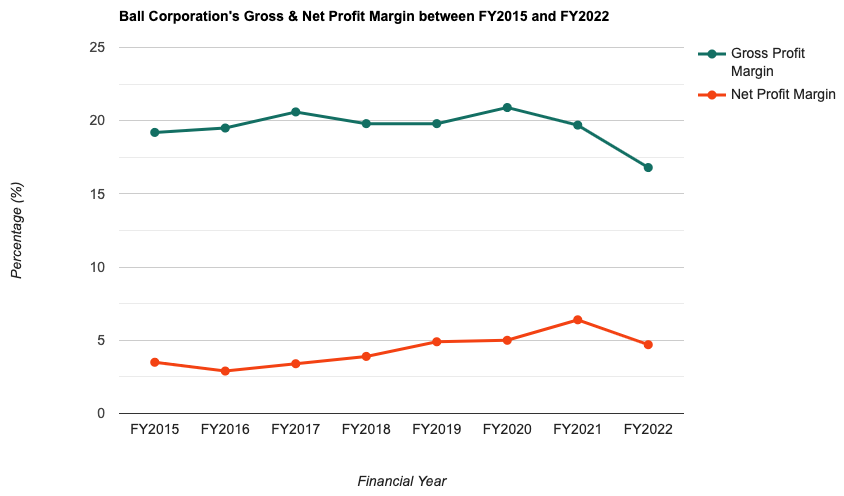
My Observations: While the company’s gross profit margin have been maintained at around the 19-20% range, but I noticed successive years of decline recorded between FY2020 and FY2022 – where its gross profit margin fell from 20.9% (the highest throughout the entire 8-year period I have looked at) to 16.8% (which happens to be the lowest recorded in the same time period).
Net profit margin is a bit on the low side at just low- to mid-single digit percentages. I also note the fluctuations in terms of its growth over the last 8 years.
Return on Equity:
In layman terms, Return on Equity, or RoE for short, is a computation of profits which a company is able to generate for every dollar of shareholders’ money it uses in its businesses. Personally, I would prefer companies that are able to maintain a RoE at above 15% over the years.
So, did Ball Corporation’s RoE fulfil this requirement of mine? Let us find out in the table below:
| FY2015 | FY2016 | FY2017 | FY2018 | |
| Return on Equity (%) | 22.5% | 7.7% | 9.5% | 13.1% |
| FY2019 | FY2020 | FY2021 | FY2022 | |
| Return on Equity (%) | 19.2% | 17.9% | 24.2% | 20.8% |
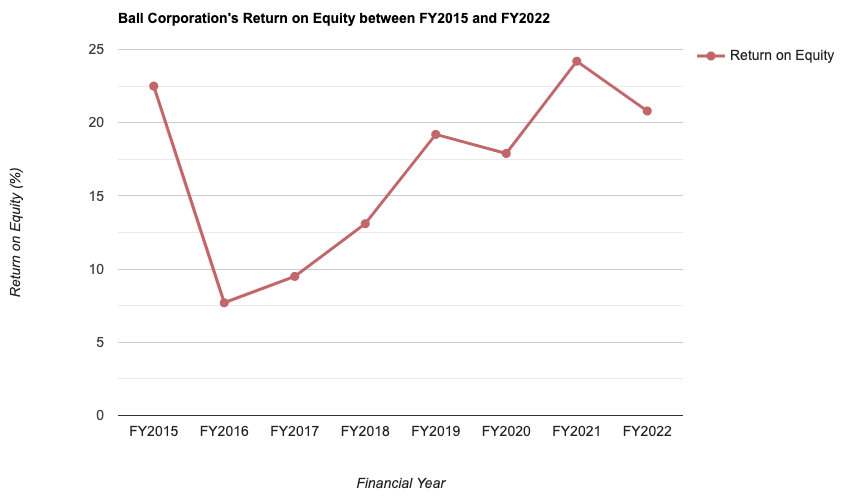
My Observations: Just like its net profit margin growth over the last 8 years, the US-listed company’s RoE growth has also been inconsistent. However, it has managed to keep this financial statistic at above 15% in 5 out of the 8 years I have looked at. Hence, it passes my selection criteria.
Debt Profile
Whenever I review a company, apart from its financial performances, another area I will focus my attention on is its debt profile – especially in the current high interest rate environment we are in, I will place more emphasis on this area, to make sure that companies are not overly leveraged.
In the table below, you will find Ball Corporation’s debt profile recorded over the last 8 financial years:
| FY2015 | FY2016 | FY2017 | FY2018 | |
| Cash & Cash Equivalent (US$’mil) | $224m | $607m | $459m | $728m |
| Total Borrowings (US$’mil) | $5,051m | $7,532m | $6,971m | $6,729m |
| Net Cash/ Debt (US$’mil) | -$4,827m | -$6,925m | -$6,512m | -$6,001m |
| FY2019 | FY2020 | FY2021 | FY2022 | |
| Cash & Cash Equivalent (US$’mil) | $1,806m | $1,381m | $579m | $558m |
| Total Borrowings (US$’mil) | $7,817m | $7,800m | $7,737m | $8,948m |
| Net Cash/ Debt (US$’mil) | -$6,011m | -$6,419m | -$7,158m | -$8,390m |
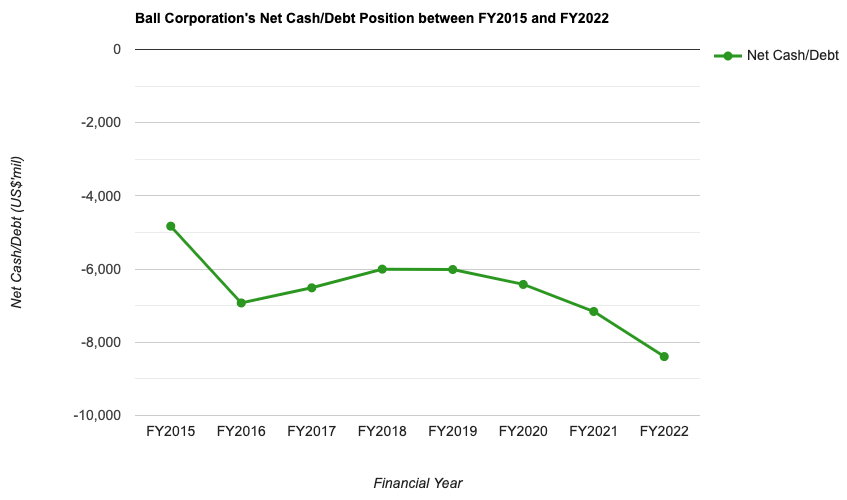
My Observations: The company is in a net debt position throughout the entire 8-year period I have looked at.
Another thing to note is that its current ratio has slipped in recent years – from 1.1 in FY2020 to just 0.8 in FY2022, suggesting that the company may not be able to fulfil its short-term debt obligations if required.
Free cash flow per share have also declined from a positive US$2.93 in FY2019 to a negative -US$4.30 in FY2022.
Dividend Payout to Shareholders
The management of Ball Corporation declares a dividend payout to its shareholders on a quarterly basis. However, if you are a Singaporean investing in a US-listed company, do take note that all dividend payouts are subject to a 30% withholding tax. Hence, dividends you eventually receive are 30% lesser than the amount declared.
In the following table, you will find Ball Corporation’s dividend payout to its shareholders over the last 8 years:
| FY2015 | FY2016 | FY2017 | FY2018 | |
| Dividend Per Share (US$) | $0.52 | $0.52 | $0.40 | $0.40 |
| FY2019 | FY2020 | FY2021 | FY2022 | |
| Dividend Per Share (US$) | $0.60 | $0.60 | $0.75 | $0.80 |
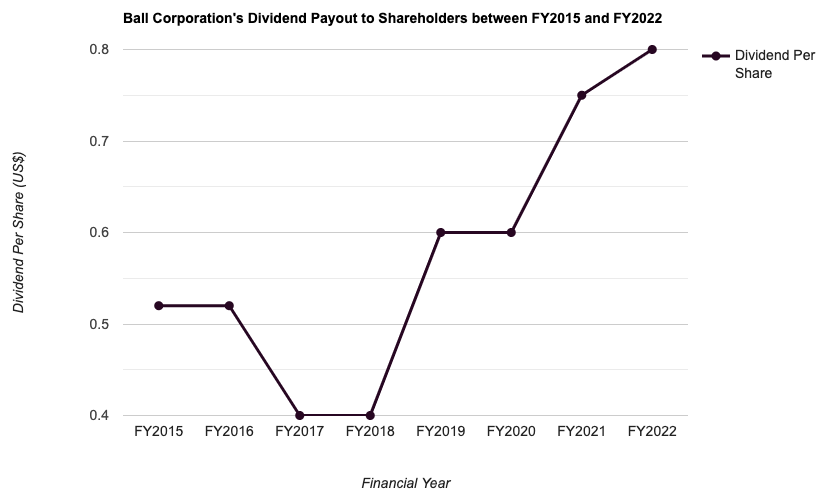
My Observations: Apart from a decline in its dividend payout in FY2017 (from $0.52 in FY2016 to $0.40 in FY2017), the other years saw its payout maintained at the same level as in the previous year, or an increase.
Over a 8-year period, the company’s dividend grew at a CAGR of 5.5%.
Is the Current Traded Price of Ball Corporation Considered ‘Cheap’ or ‘Expensive’?
At the time of writing, Ball Corporation is trading at US$57.91 (based on its share price at close on 27 December 2023).
The table below is a comparison of the company’s current valuations (based on its current traded price) against its 8-year average:
| Current | 8-Year Average | |
| P/S Ratio | 1.3 | 1.5 |
| P/B Ratio | 4.6 | 5.7 |
| Dividend Yield | 1.4%^^ | 1.6% |
My Observations: Comparing its current valuations against its 8-year average, the current traded price of Ball Corporation is considered to be ‘cheap’, due to its current P/S and P/B ratios being lower than its 8-year average.
Finally, based on its 8-year valuation, my ‘fair value’ price for the company is US$73.92 – hence, at its current traded price, it is at a 21.7% discount.
Closing Thoughts
The company has an ‘easy to understand’ business, in that a lion’s share of its total revenue was contributed by sales of its aluminium packaging business (one of the things to note when it comes to investing in a company is to never invest in one which you are clueless about its business operations.)
Other aspects about the company that I like include its stable total revenue and net profit growth, its return on equity maintaining at above 15% in 5 out of 8 years I have looked at, along with its stably rising dividend payout.
On the flip side, its gross and net profit margin growth over the years have been inconsistent. Also, the company is in a net debt position throughout the entire 8-year period I have looked at, with its current ratio fell from 1.1 in FY2020 to just 0.8 in FY2022, suggesting the company may have difficulties in meeting its short-term debt obligations. Additionally, the company have sunk into a negative free cash flow position at -US$4.30 in FY2022, which could be a sign of it having a poor financial health. Hence, for those who are interested to invest in the company, the above is something to be mindful about.
Finally, Ball Corporation’s current traded price of US$57.91 is at a 21.7% discount to the ‘fair value’ price of US$72.92 I’ve computed based on its valuations over the last 8 years.
With that, I have come to the end of my review of US-listed Ball Corporation. I hope the contents presented in this post have given you a good understanding of the company (whether is it in terms of its business operations, or its historical financial performances, debt profile, and dividend payouts). As always, do note that this post does not imply any buy or sell calls for the company’s shares. You are strongly encouraged to do your own due diligence before you make any investment decisions.
Disclaimer: At the time of writing, I am not a shareholder of Ball Corporation.
Are You Worried about Not Having Enough Money for Retirement?
You're not alone. According to the OCBC Financial Wellness Index, only 62% of people in their 20s and 56% of people in their 30s are confident that they will have enough money to retire.
But there is still time to take action. One way to ensure that you have a comfortable retirement is to invest in real estate investment trusts (REITs).
In 'Building Your REIT-irement Portfolio' which I've authored, you will learn everything you need to know to build a successful REIT investment portfolio, including a list of 9 things to look at to determine whether a REIT is worthy of your investment, 1 simple method to help you maximise your returns from your REIT investment, 4 signs of 'red flags' to look out for and what you can do as a shareholder, and more!

You can find out more about the book, and grab your copy (ebook or physical book) here...


Comments (0)