For those of you who do not know what the term ‘FAANG’ means, it basically is an acronym that describes the 5 big technology companies listed on the NASDAQ stock exchange. These 5 companies are:
- Facebook Inc. (NASDAQ:FB)
- Amazon.com Inc. (NASDAQ:AMZN)
- Apple Inc. (NASDAQ: AAPL)
- Netflix Inc. (NASDAQ:NFLX)
- Alphabet Inc. (NASDAQ:GOOGL)
Basically, the term ‘FAANG’ refers to the first letter of the ticker symbol of the 5 companies.
In my post today, you will learn about my technical analysis of these 5 companies (based on their recent share price movements, as well as their closing prices yesterday, 11 March 2021) – particularly how their share prices might possibly move in the near-term, both on a bull as well as on a bear case scenario, along with some of the important price points (based on my analysis) to take note of.
Before I begin, here are the technical indicators that I have based my analysis on:
- 20-day (dark green), 50-day (light green), 100-day (orange), 150-day (yellow), and 200-day (red) Moving Averages (MA) on a weekly timeframe
- Bollinger band on a weekly timeframe (with the upper and lower bands in light blue)
- Moving Average Convergence Divergence (MACD) on a daily timeframe
- Stochastic on a daily timeframe
Let’s begin…
1. Facebook Inc. (NASDAQ:FB)

After the share prices of the social networking company hit a 52-week high of $304.67 on 26 August 2020 (where the candlestick protruded out of the upper band of the Bollinger Band), it declined in the following months thereafter (notice the black downward sloping arrow which I’ve drawn in the chart above.)
The share price of Facebook closed at $273.88 yesterday (11 March 2021), where it broke above the MA20 resistance line at $270.00. Looking at the technical indicators MACD and stochastic, both of them are in an uptrend position, as well as pointing upwards, suggesting that in the near-term, the social networking giant’s share price may continue to see an upward climb up towards $288.15, where the upper band of the Bollinger Band is (and also a resistance.)
However, should the share price were to break down the resistance-turned-support line at $270.00 (where MA20 is), then it could be headed to where the lower band of the Bollinger Band, as well as where MA50 is, at around the $250.50 price point.
2. Amazon.com Inc. (NASDAQ:AMZN)
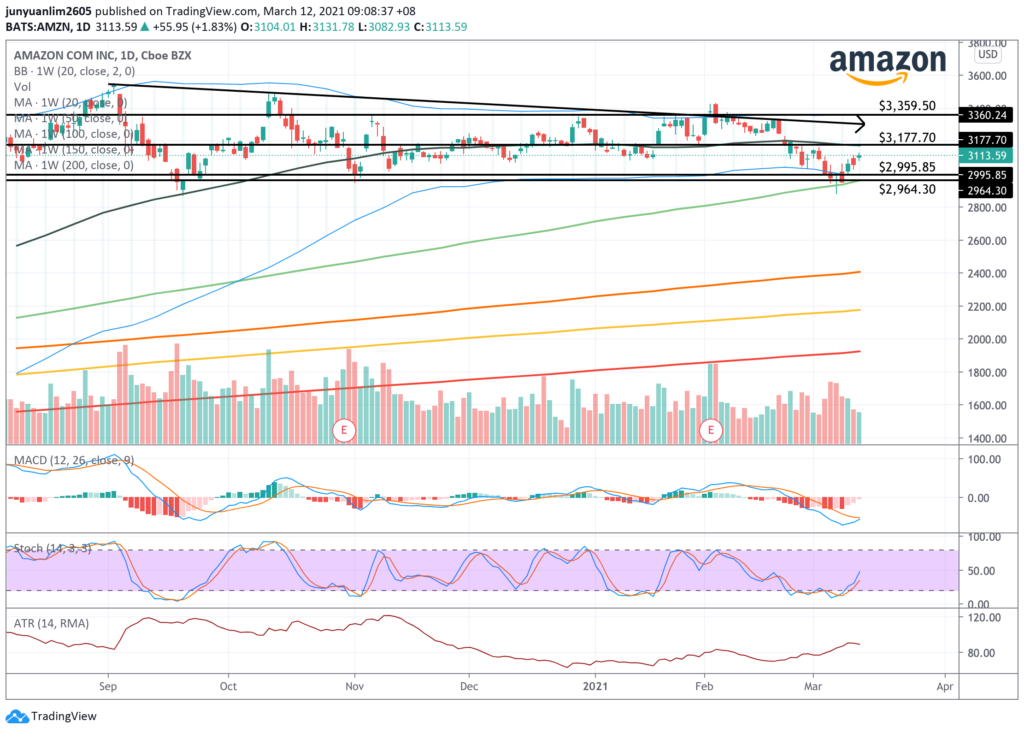
Similar to the share price movements of Facebook, the share price of Amazon.com Inc. hit a 52-week high of $3,552.25 on 02 September 2020 before moving downwards (notice how the share price broke down immediately after breaking above the upper band of the Bollinger Band,), The share price of the company was trading at $3,113.59 when the market closed on 11 March 2021.
In terms of the technical indicators MACD and stochastic, the former is about to turn into an uptrend position (as the blue line is about to cross above the red line), while the latter is in an uptrend (and point upwards.)
This suggests that it is highly likely that the share price of the tech giant is likely to continue its upward ascend to around $3,177.70, where MA20 is (and a resistance line.) If the share price be able to break above this resistance line on a high volume, then we could possibly see its share price going up to around $3,359.50, where the upper band of the Bollinger Band is.
On the other hand, if the share price of the company were to reverse downwards, it could possibly go down to a range where MA50 and the lower band of the Bollinger Band is – between $2,964.30 and $2,995.85.
3. Apple Inc. (NASDAQ:AAPL)

After hitting a 52-week high of $145.09 on 25 January 2021 (where the candlestick broke above the upper band of the Bollinger Band), Apple’s share price retreated shortly after (notice the downward descending black arrow in the chart above.) At the time of writing, the tech company’s share price closed at $121.96 (on 11 March 2021.)
While MACD is still in a downtrend position (where the blue line is still below the red line), but it seems that it is about to reverse into an uptrend position. Stochastic, on the other hand, is in an uptrend position, with both the blue and red lines pointing upwards.
Looking ahead in the near-term, should the share price of Apple were to continue its upward moving momentum, it could head up to where MA20 is, at $125.70 (where this is the most immediate resistance line.) Should the share price were to break above this resistance line on a high volume, then it could possibly head up to $141.10, where the upper band of the Bollinger Band is.
However, if the share price of Apple were to retreat, then it could possibly head down to a range where MA50 and the lower band of the Bollinger Band is – between $107.70 and $110.30.
4. Netflix Inc. (NASDAQ:NFLX)
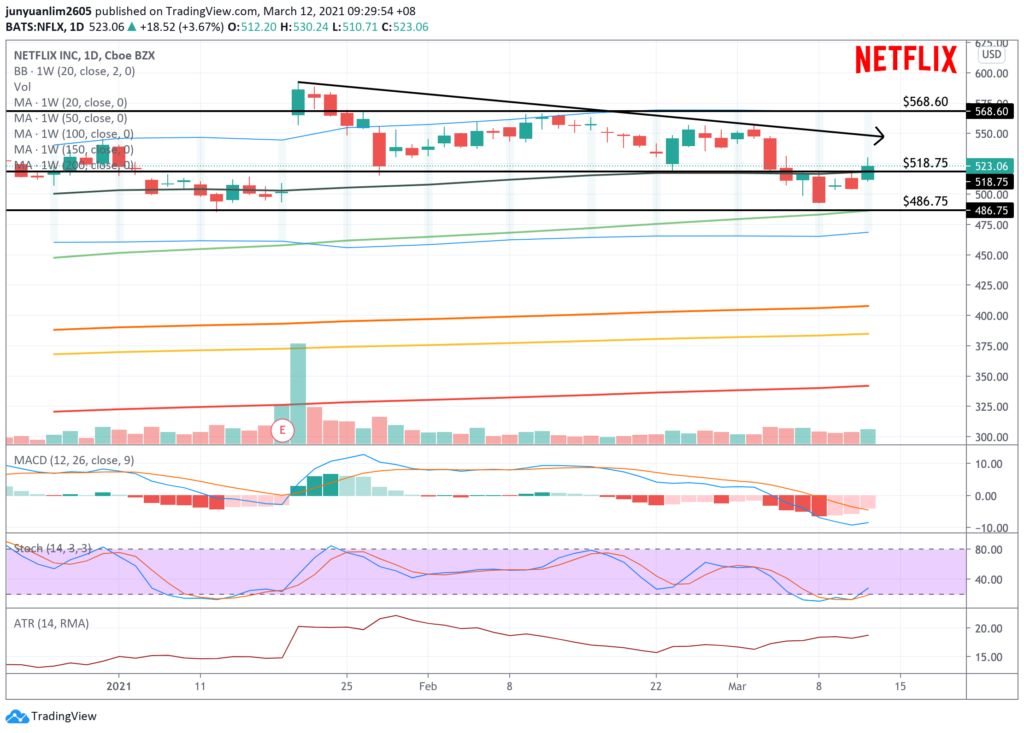
The share price of Netflix broke out of the upper band of the Bollinger Band and hit a 52-week high of $593.29 on 20 January 2021 before retreating shortly after. At the time of writing, the share price of the company closed at $523.06 (on 11 March 2021) – which is down by 11.8% from its high.
Notice the last candlestick in the chart above (for 11 March 2021), it broke above the MA20 resistance line at $518.75. From this point, two scenarios could play out – it could either continue its upward ascend, or once again break down this resistance-turned-support line at the same price point (at $518.75.) However, looking at the technical indicators MACD and stochastic, I am of the opinion that the former is more likely to happen – as stochastic is already in an uptrend (with both the blue and red line pointing upwards), while MACD looks like it is about to turn into an uptrend.
If the share price were to continue its climb up, then it could possibly head up to where the upper band of the Bollinger Band is, at $568.60. On the other hand, if the share price were to break below the resistance-turned-support line, then it could go down to where MA50 is at $486.75.
5. Alphabet Inc. (NASDAQ:GOOGL)

Finally, let us look at the share price movements of Alphabet Inc. The share price of the company closed at $2,100.54 yesterday (11 March 2021) – which is very close to where its current 52-week high is, at $2,145.14.
In terms of the two technical indicators MACD and stochastic, the latter is in an uptrend position, with both the blue and red lines pointing up, while MACD seems like it is about to turn into an uptrend position – suggesting that the share price of the tech giant is very likely to re-visit its 52-week high price. If it is able to break above this price point, then it could be headed up to where the upper band of the Bollinger Band is, at $2,169.40.
On the other hand, if the share price were to retreat, then it could possibly be headed to where MA20 is at $1,861.00.
Closing Thoughts
Looking at the share price movements of ‘FAANG’ companies, it does seems like in the near-term, chances are high that their share prices could continue their upward movement (and I have pointed out some of the key price points to take note of.) At the same time, I have also pointed out where some of the key support areas are, should their share prices were to reverse downwards.
With that, I have come to my technical analysis share on the 5 big technology companies listed on the NASDAQ stock exchange. As always, do take note that everything that you have just read above is purely for educational purposes only, and they do not represent any buy or sell recommendations for any of the companies I’ve mentioned above. Please do your own due diligence before you make any trading or investing decisions.
Disclaimer: At the time of writing, I have shares of Facebook Inc., Amazon.com Inc., Apple. Inc., as well as Netflix Inc.
Stop Spending Hours Reading REIT Reports Every Quarter!
What if you could assess a REIT's portfolio occupancy, debt profile, valuation, and overall health in less than 30 seconds - without having to comb through a single quarterly report?
That's the problem the REIT Screener was built to solve.
Developed through a collaboration between ShareInvestor and The Singaporean Investor, the REIT Screener consolidates many of the key metrics and indicators I personally use when analysing REITs into one easy-to-use platform. Instead of spending hours extracting data manually every earnings season, you can now monitor the REITs you own and research new opportunities in just a few clicks.
If you're serious about REIT investing but don't have the time to manually track quarterly developments, the REIT Screener could be the shortcut you've been looking for:

Take a closer look at the REIT Screener here...


Comments (0)