When I started to build a long-term investment portfolio back in August 2019, financial institution Hong Leong Finance (SGX:S41) was my very first investment – I invested in the company at $2.58, where, based on its full-year dividend payout of 15.0 cents/share in FY2018, it represented a yield of 5.8% (which fulfilled my criteria of investing in companies that can provide me with a dividend yield of more than 4.0%.)
For those of you who are unfamiliar with the company, it was listed on the Singapore Stock Exchange since 1974 (I wasn’t even born then!), and today, the it has a total of 28 branches spread out across different locations in Singapore (with 27 of them located in residential estates.) In case you’re not aware, Hong Leong Finance was also ranked among the Top 1,000 World Banks, as well as among the Top 100 ASEAN Banks by The Banker (in my opinion, not bad for a company that has a physical business presence in Singapore alone.)
Hong Leong Finance’s primary business involves taking deposits and savings from the public (people like you and I), and providing financing solutions and services including corporate and consumer loans, government assistance for SMEs (Small and Medium Enterprises), corporate finance and advisory services.
In the rest of today’s post about Hong Leong Finance, I’d be sharing with you some of the financial institution’s key financial performances over the past 9 years (between FY2012 and FY2020 – the company has a financial year end every 31 December), along with its dividend payout to its shareholders in the same time period. On top of that, I’d also be sharing with you why I did not buy more shares to average down my current invested price (despite its share price is currently 6% below my initial invested price at the time of writing), along with my outlook for the financial institution ahead.
Let’s begin…
Financial Performance
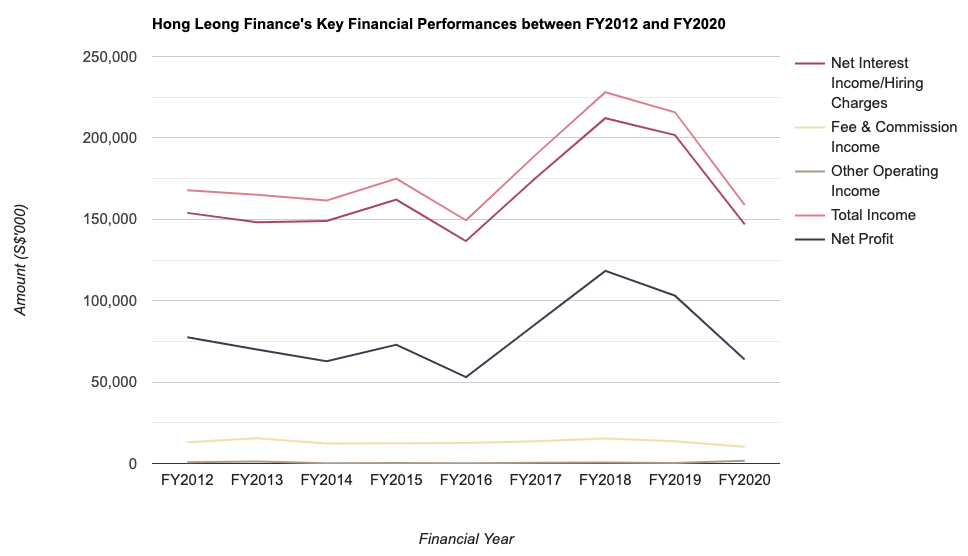
Hong Leong Finance’s Total Income is made up of 3 components – (i) Net Interest Income/Hiring Charges, (ii) Fee & Commission Income, and (iii) Other Operating Income, and in the table below, you’ll find how the financial institution fared in each of the 3 business segments over the past 9 years:
| FY2012 | FY2013 | FY2014 | FY2015 | FY2016 | |
| – Net Interest Income/Hiring Charges (S$’000) | $153,952k | $148,216k | $148,991k | $162,104k | $136,669k |
| – Fee & Commission Income (S$’000) | $13,118k | $15,545k | $12,293k | $12,490k | $12,538k |
| – Other Operating Income (S$’000) | $740k | $1,252k | $199k | $377k | $214k |
| Total Income (S$’000) | $167,810k | $165,013k | $161,483k | $174,971k | $149,421k |
| Net Profit Attributable to Shareholders (S$’000) | $77,555k | $70,078k | $62,797k | $72,856k | $53,066k |
| FY2017 | FY2018 | FY2019 | FY2020 | ||
| – Net Interest Income/Hiring Charges (S$’000) | $175,402k | $212,119k | $201,704k | $146,848k | |
| – Fee & Commission Income (S$’000) | $13,681k | $15,337k | $13,714k | $10,229k | |
| – Other Operating Income (S$’000) | $490k | $614k | $324k | $1,714k | |
| Total Income (S$’000) | $189,573k | $228,070k | $215,742k | $158,791k | |
| Net Profit Attributable to Shareholders (S$’000) | $85,685k | $118,343k | $103,085k | $63,909k |

Hong Leong Finance’s net interest income/hiring charges saw year-on-year (y-o-y) declines in 4 out of 9 years – in FY2013 (due to a reduction in lending spread achieve), FY2016 (due to an increase in interest expense), FY2019 (due to a 17 basis point decline in its net interest margin as higher cost of fund outweighed the improved loan spend), and in FY2020 (due to a compressed net interest margin as the dip in interest yields outweighed the savings in lower cost of fund amid falling interest rate from the Covid-19 pandemic.)
Personally, for the latest financial year 2020, even the 3 Singapore-listed banks (in DBS, UOB, and OCBC) also saw their net interest income significantly impacted due to a compressed net interest margin as a result of the Covid-19 pandemic; hence, if I were to strip out the year’s results, Hong Leong Finance’s net interest income/hiring charges over a 8-year period (between FY2012 and FY2019) had grown by a compound annual growth rate (or CAGR) of about 3.4% (still considered pretty decent if you ask me.)
Its fee and commission income saw a slightly better performance – where it recorded y-o-y declines in 3 out of 9 years – in FY2014 and in FY2019 (where for both years, they were due to lower income in some lending products), as well as in FY2020 (due to lower fee income earned from both its lending and non-lending activities.) However, in terms of its CAGR, even if I were to just consider the results over a 8-year period (between FY2012 and FY2019), it was just at 0.6% – a flattish growth.
The financial institution’s other operating income saw very inconsistent performance throughout the entire 9-year period that I’ve looked at.
Finally, in terms of its net profit attributable to shareholders, over a 9-year period, it saw y-o-y declines in 5 out of 9 years.
Looking at the financial year ahead, so far for the first half of the financial year 2021 (the financial institution only reported its financial results on a half-yearly basis, so the latest set of results that I have is that for the first half of the year ended 30 June 2021), its net interest income/hiring charges saw a 8.6% y-o-y improvement, while its other operating income jumped by 89.2% in the same time period; however, its fee and commission income saw a 3.0% decline. Finally, its net profit attributable to its shareholders also saw a 22.4% improvement – quite expected coming on the back of a low-base last year (as a result of business activities being disrupted the year before due to lockdowns by the Singapore government to slow down the transmission of Covid-19 in the country.) For the second half of the financial year 2021, I would expect its top- and bottom-line results to record a y-o-y improvement, as Singapore has more or less resumed normal business activities as the Government start to open up after having a majority of the population fully vaccinated.
Return on Equity
Return on Equity (or RoE for short), in layman terms, is a computation of the amount of profits (in percentage terms) a company is able to generate for every dollar of shareholders’ money it uses in its business.
The following is Hong Leong Finance’s RoE over a 9-year period which I’ve computed:
| FY2012 | FY2013 | FY2014 | FY2015 | FY2016 | |
| Return on Equity (%) | 4.8% | 4.3% | 3.8% | 4.3% | 3.1% |
| FY2017 | FY2018 | FY2019 | FY2020 | ||
| Return on Equity (%) | 4.9% | 6.3% | 5.4% | 3.3% |

The growth of the financial institution’s RoE over the years, as you can see from the table and chart above, is also a bit on the inconsistent side.
Dividend Payout to Shareholders
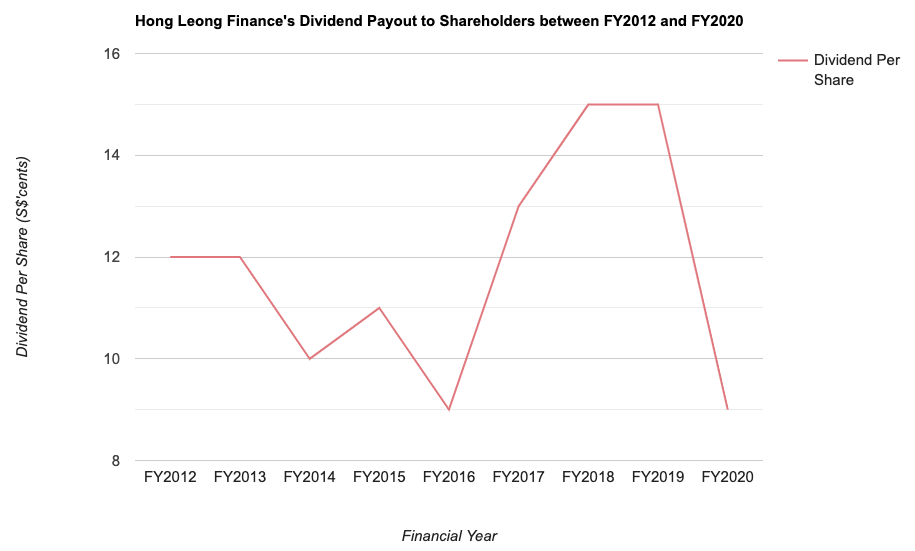
The management of Hong Leong Finance declares a dividend payout to its shareholders on a half-yearly basis, and in the following table and chart, you’ll find the financial institution’s dividend payout to its shareholders over the past 9 years, along with its payout ratio:
| FY2012 | FY2013 | FY2014 | FY2015 | FY2016 | |
| Dividend Per Share (S$’cents) | 12.0 cents | 12.0 cents | 10.0 cents | 11.0 cents | 9.0 cents |
| Dividend Payout Ratio (%) | 68.2% | 75.8% | 70.7% | 67.0% | 75.3% |
| FY2017 | FY2018 | FY2019 | FY2020 | ||
| Dividend Per Share (S$’cents) | 13.0 cents | 15.0 cents | 15.0 cents | 9.0 cents | |
| Dividend Payout Ratio (%) | 67.6% | 56.6% | 65.1% | 63.0% |

Looking at Hong Leong Finance’s dividend payout to its shareholders over the years, it has been inconsistent in the earlier years (between FY2012 and FY2016), before it started to improve and became more consistent in the latter years (for FY2020, the drop was due to advisory by the Monetary Authority of Singapore for financial institutions and banks to cap their dividend payout to 60.0% of what was paid out in the previous financial year for prudence in light of the ongoing Covid-19 pandemic) – if you were to disregard its dividend payout for FY2020, and focus on its dividend payout made over the last 8 years, then the CAGR will be at 2.8% (still pretty much acceptable in my opinion.)
Closing Thoughts
As you can see from the earlier paragraphs, a fluctuating set of performance by the financial institution is one of the reason I choose not to buy more shares at its current traded price to bring down my average invested price.
But at the same time, I find its dividend yield pretty decent (at 5.8% based on its full-year payout in FY2019, which was before the pandemic), and I expect the financial institution to be able to at least maintain its 15.0 cents/share of dividend payout to its shareholders – which is why I still remain invested in the company for now.
Looking ahead, with the gradual resumption of economic activities in Singapore, and the imminent interest rate hikes by the Federal Reserve sometime this year, financial institutions like Hong Leong Finance should benefit and I expect to see an even better set of results reported by the financial institution for the coming financial year 2022.
On the other hand, geopolitical tensions – such as that between Russia and Ukraine, and especially if it turns out into a war, could very likely derail economic recovery, and in turn, the affecting the performance of the financial institution (personally, its the last thing I want to see happening right now, considering the fact that many countries are still battling with yet another wave of Covid variant, and at the same time, their economic growth no where near pre-pandemic levels.)
With that, I have come to the end of my review on Hong Leong Finance’s past years’ performances. As always, I do hope you’ve found the contents presented above useful, and finally, please note that everything you’ve just read is purely for educational purposes only. You should always do your own due diligence before making any investment decisions.
P.S. A big thank you for those of you who have casted their votes for me for the category of the “Most Popular Member” in InvestingNote. If you are a member of the investing platform, and think that I deserve the award, you can vote for me (@ljunyuan) here (the voting period is between 20th January and 06 February 2022.) Many thanks once again for your support in advance!
Disclaimer: At the time of writing, I am a shareholder of Hong Leong Finance Limited.
Join Me 'Live' at REITs Symposium 2025 – 24 May | 3:15PM – 3:45PM @ Engagement Stage

Amid escalating trade tensions and renewed market volatility triggered by the latest wave of tariff announcements, how should investors navigate the REITs space?
I'll be sharing my insights and strategies for staying resilient with REIT investments in these uncertain times during my presentation at the Engagement Stage — located right at the entrance of the event.
🎟️ Find out more about the event, and grab your tickets for just S$5 here...
Are You Worried about Not Having Enough Money for Retirement?
You're not alone. According to the OCBC Financial Wellness Index, only 62% of people in their 20s and 56% of people in their 30s are confident that they will have enough money to retire.
But there is still time to take action. One way to ensure that you have a comfortable retirement is to invest in real estate investment trusts (REITs).
In 'Building Your REIT-irement Portfolio' which I've authored, you will learn everything you need to know to build a successful REIT investment portfolio, including a list of 9 things to look at to determine whether a REIT is worthy of your investment, 1 simple method to help you maximise your returns from your REIT investment, 4 signs of 'red flags' to look out for and what you can do as a shareholder, and more!

You can find out more about the book, and grab your copy (ebook or physical book) here...


Comments (0)