Oversea-Chinese Banking Corporation, or OCBC (SGX:O39) was one of my first additions (I invested in the bank at $10.50 back in late-August 2019) when I embarked on my plan to build a long-term investment portfolio then (and how quickly time flies – in a blink of an eye, more than 2 years have passed.)
As a long-term investor of the Singapore bank, I continued to stay invested even when its share price hit its low of $7.81 in mid-March last year (when the Covid-19 pandemic was at its worst, with many countries around the world implemented lockdowns to curb the further community spread of the virus, and this impacted economic growth) as I was confident that the bank’s share price would recover once the pandemic was brought under control – my faith and patience were rewarded in that, based on its current share price at the time of writing, I’m sitting on a capital gain of about 17% (excluding dividend payouts received) – not too bad in terms of returns for about 2 years and 3 months huh?
In this post, I thought I’d to do a review of some of the key performances recorded by Singapore’s longest established bank over the years (between FY2012 and FY2020) – particularly, its financial results (such as the growth of its total income and net profit), financial statistics (such as how its net interest margin, return on equity, and non-performing loans rate have moved), and also dividend payouts which the bank had declared to its shareholders.
Let’s begin:
Key Financial Performances
As mentioned in the introduction, in this section, I will be taking a look at the bank’s results recorded between FY2012 and FY2020:
| FY2012 | FY2013 | FY2014 | FY2015 | FY2016 | |
| – Net Interest Income (S$’mil) | $3,748m | $3,883m | $4,736m | $5,189m | $5,052m |
| – Net Fee & Commission Income (S$’mil) | $1,198m | $1,355m | $1,495m | $1,693m | $1,638m |
| – Other Non-Interest Income (S$’mil) | $3,015m | $1,383m | $2,109m | $1,840m | $1,799m |
| Total Income (S$’mil) | $7,961m | $6,621m | $8,340m | $8,722m | $8,489m |
| Net Profit Attributable to Shareholders (S$’mil) | $3,993m | $2,768m | $3,842m | $3,903m | $3,473m |
| FY2017 | FY2018 | FY2019 | FY2020 | ||
| – Net Interest Income (S$’mil) | $5,423m | $5,890m | $6,331m | $5,966m | |
| – Net Fee & Commission Income (S$’mil) | $1,953m | $2,031m | $2,123m | $2,003m | |
| – Other Non- Interest Income (S$’mil) | $2,260m | $1,780m | $2,417m | $2,170m | |
| Total Income (S$’mil) | $9,636m | $9,701m | $10,871m | $10,139m | |
| Net Profit Attributable to Shareholders (S$’mil) | $4,146m | $4,492m | $4,869m | $3,586m |

Typically, a bank’s total income comprises of 3 components – its net-interest income, its net fee and commissions income, as well as its other non-interest income – in the 9 financial years I have looked at, it has recorded year-on-year (y-o-y) declines in 3 years, due to:
FY2013: The 16.8% fall in its total income compared to the previous year can be attributed to a drop in its other non-interest income – due to a lack of divestment gain of $1,316m recorded in the previous financial year.
FY2016: The slight 2.7% dip is due to a drop in its net interest income (due to a decline in its average asset volumes), net fee & commissions income (due to lower brokerage and investment banking income), as well as in its other non-interest income (due to a fall in net trading income and also profits from its life insurance.)
FY2020: The 6.7% decline in its total income can be attributed to headwinds posed by the Covid-19 pandemic – where the bank’s results were negatively impacted starting from the second quarter of the financial year; the decline in its net interest income was due to a 16 basis points drop in its net interest margin in a significantly low interest rate environment, the drop in its net fee and commissions income was due to a drop in loan-related and credit card fees on the back of a lower transaction volume, and the fall in its other non-interest income was due to lower mark-to-market gains in Great Eastern Holdings’ investment portfolio and lower profits from life insurance.
Over the past 9 years, OCBC’s net interest income managed to record a compound annual growth rate (CAGR) of 3% – in my opinion it’s considered stable.
However, for its net profit attributable to shareholders, coming on the back of a record $4,869m recorded in FY2019, and in the following year, suffered significantly as a result of the Covid-19 pandemic. As such, its CAGR over the 9 year period was a negative one. But if you were to disregard FY2020’s net profit attributable to shareholders, and consider the figures recorded between FY2012 and FY2019 (a period of 8 years), its CAGR would have been 2% – again I would say that it’s also a stable growth.
Key Financial Ratios
In this section, I will be looking at some of the key financial ratios recorded by the bank over the years – and these are the exact financial ratios I look at whenever I evaluate a bank – they are its net interest margin, return on equity, and also its non-performing loans ratio:
| FY2012 | FY2013 | FY2014 | FY2015 | FY2016 | |
| Net Interest Margin (%) | 1.77% | 1.64% | 1.68% | 1.67% | 1.67% |
| Return on Equity (%) | 12.5% | 11.6% | 13.2% | 12.3% | 10.0% |
| Non-Performing Loans Ratio (%) | 0.8% | 0.7% | 0.6% | 0.9% | 1.3% |
| FY2017 | FY2018 | FY2019 | FY2020 | ||
| Net Interest Margin (%) | 1.65% | 1.70% | 1.77% | 1.61% | |
| Return on Equity (%) | 11.2% | 11.5% | 11.4% | 7.6% | |
| Non-Performing Loans Ratio (%) | 1.5% | 1.5% | 1.5% | 1.5% |

My Observations: Despite its net interest margin have fluctuated over the past 7 years, but in the same time period, its net interest income (you can find the figures in the section above) have grown consistently – where it went up from $3,748m in FY2012 to $5,966m in FY2020, with y-o-y declines noted in just 2 of the 9 years.
It’s non-performing loans ratio, despite having slowly creeped up from 0.8% in FY2012 to 1.5% in FY2017, but it has remained consistent since – one thing I find impressive is that, despite all the headwinds posed by the Covid-19 pandemic in FY2020, its non-performing loans ratio did not record an increase.
The only thing I may be a little bit disappointed with would be in its return on equity – where over the past 9 years, you can notice it going on a downward moving trend, with its return on equity recorded in FY2020, at 7.6%, being the lowest in 9 years. On the bright side though, with the economy slowly recovering as countries around the world start to resume normal business activities, I’m confident that this particular ratio will record an improvement in the coming full-year results ahead.
Dividend Payout to Shareholders
The management of OCBC declares a dividend payout to its shareholders on a half-yearly basis – once when it releases its second quarter results (with payout in August), and once when it releases its fourth quarter results (with payout in May.)
Over the past 9 years (between FY2012 and FY2020), its dividend payout to shareholders, along with its payout ratios, are as follows:
| FY2012 | FY2013 | FY2014 | FY2015 | FY2016 | |
| Dividend Per Share (S$’cents) | 33.0 cents | 34.0 cents | 36.0 cents | 36.0 cents | 36.0 cents |
| Dividend Payout Ratio (%) | 29% | 45% | 35% | 38% | 44% |
| FY2017 | FY2018 | FY2019 | FY2020 | ||
| Dividend Per Share (S$’cents) | 37.0 cents | 43.0 cents | 53.0 cents | 31.8 cents | |
| Dividend Payout Ratio (%) | 39% | 40% | 47% | 40% |
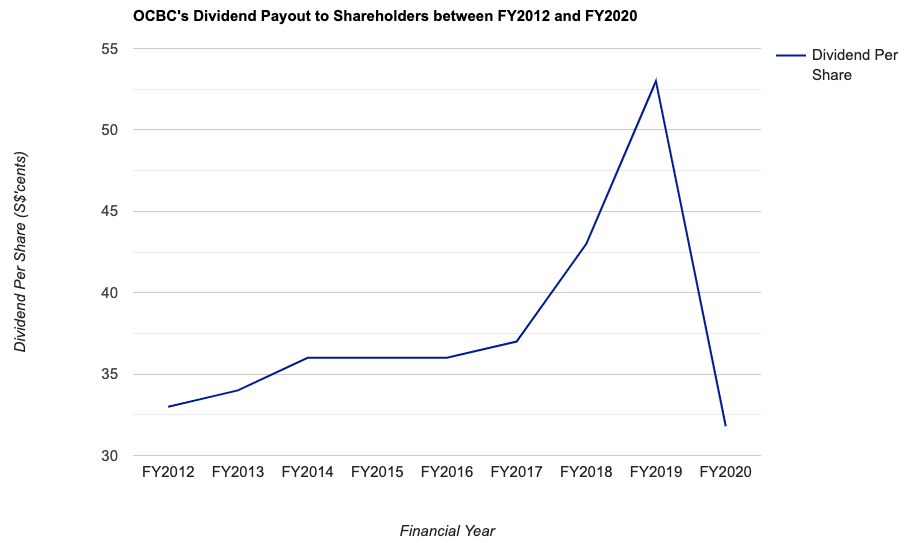
OCBC’s dividend payouts have been slowly increasing over the years, before a drop in FY2020 – as banks and financial institutions were advised by the Monetary Authority of Singapore (MAS) to cap their payouts to 60.0% of what was paid in the previous financial year for prudence amid the headwinds posed by the Covid-19 pandemic.
If you were to disregard the dividend payouts in FY2020, the bank’s dividend payouts over the past 8 years (between FY2012 and FY2018) grew at a CAGR of 6% – again I must say that the growth was a pretty decent one.
Closing Thoughts
A stable financial performance over the years, and also in terms of its dividend payouts to shareholders, are reasons why OCBC caught my investment eye and my decision to add the Singapore bank to my long-term investment portfolio back in August 2019.
Of course, there’s no one company that is all good and no bad – if there’s one thing I do not quite like about the bank, it would be its declining return on equity over the years.
However, despite having said that, this post is by no means a buy or sell recommendation for the bank’s shares. Everything you have just read above is purely for information purposes only. As always, please do your own due diligence before you make any investment decisions.
P.S. In case you’re wondering if I’m intending to do something similar for DBS and UOB – both of them I have in my long-term investment portfolio as well, the answer is yes – I’ll be working on them and publish once done.
Disclaimer: At the time of writing, I am a shareholder of Oversea-Chinese Banking Corporation Limited.
Are You Worried about Not Having Enough Money for Retirement?
You're not alone. According to the OCBC Financial Wellness Index, only 62% of people in their 20s and 56% of people in their 30s are confident that they will have enough money to retire.
But there is still time to take action. One way to ensure that you have a comfortable retirement is to invest in real estate investment trusts (REITs).
In 'Building Your REIT-irement Portfolio' which I've authored, you will learn everything you need to know to build a successful REIT investment portfolio, including a list of 9 things to look at to determine whether a REIT is worthy of your investment, 1 simple method to help you maximise your returns from your REIT investment, 4 signs of 'red flags' to look out for and what you can do as a shareholder, and more!

You can find out more about the book, and grab your copy (ebook or physical book) here...


Comments (2)