Brief Introduction:
Oversea-Chinese Banking Corporation Limited (SGX: O39), better known as OCBC, is Singapore’s longest-established bank, having been formed in 1932 through the merger of 3 local banks.
Headquartered in Singapore, OCBC is currently the second-largest financial services group in Southeast Asia by assets. The bank provides a comprehensive range of financial services, including consumer, corporate, investment, private, and transaction banking, alongside treasury, insurance, asset management, and stockbroking services.
OCBC is recognised as one of the world’s highest-rated banks, with credit ratings of Aa1 from Moody’s and AA- from both Fitch Ratings and S&P Global Ratings. The bank has also received numerous industry accolades, including being named among Global Finance’s World’s Top 50 Safest Banks and recognised as Singapore’s Best Managed Bank by The Asian Banker.
With a network of nearly 390 branches and representative offices across 19 countries and regions, OCBC’s operations are primarily focused on its core markets of Singapore, Malaysia, Indonesia, and Greater China.
Financial Figures (9M FY2025 vs. 9M FY2026):
| 9M FY2025 | 9M FY2026 | % Variance | |
| – Net Interest Income (S$’mil) | $6,854m | $6,798m | -0.8% |
| – Net Fee & Commission Income (S$’mil) | $1,809m | $2,150m | +18.8% |
| – Other Non-Interest Income (S$’mil) | $2,335m | $2,783m | +19.2% |
| Total Income (S$’mil) | $10,998m | $11,731m | +6.7% |
| Total Expenses (S$’mil) | $4,322m | $4,602m | +6.5% |
| Net Profit (S$’mil) | $5,677m | $6,237m | +9.9% |
OCBC delivered a strong financial performance in the first 9 months of FY2026. While net interest income edged down by 0.8% year on year to S$6.80 billion, as a 22-basis-point contraction in net interest margin was partly offset by 12% growth in average assets, its other 2 income segments (net fee and commission income and other non-interest income) both recorded growth. Consequently, total income and net profit rose to new record highs of S$11.73 billion and S$6.24 billion respectively.
Net fee and commission income increased by 18.8% year on year to S$2.15 billion, supported by stronger contributions from wealth management, loan and trade-related activities, and investment banking fees.
Other non-interest income also grew significantly, climbing 19.2% year on year to S$2.78 billion. This was driven by a 24% increase in trading income, as customer flow income surged 40% to a record S$1.35 billion, reflecting strong momentum in wealth-related and corporate hedging activities. Insurance income also improved by 17% year on year, underpinned by the strength of its underlying insurance business.
On the expenses front, total expenses rose by 6.5% year on year to S$4.60 billion, primarily due to higher variable compensation in line with income growth, as well as increased IT-related and promotional spending to support business expansion.
Financial Figures (3Q FY2025 vs. 3Q FY2026):
| 3Q FY2025 | 3Q FY2026 | % Variance | |
| – Net Interest Income (S$’mil) | $2,226m | $2,313m | +3.9% |
| – Net Fee & Commission Income (S$’mil) | $683m | $735m | +7.6% |
| – Other Non-Interest Income (S$’mil) | $887m | $685m | -22.8% |
| Total Income (S$’mil) | $3,796m | $3,733m | -1.7% |
| Total Expenses (S$’mil) | $1,519m | $1,522m | +0.2% |
| Net Profit (S$’mil) | $1,978m | $2,042m | +3.2% |
OCBC’s total income for the 3rd quarter declined by 1.7% year on year to S$3.73 billion, primarily due to a 22.8% drop in other non-interest income to S$685 million. This was largely attributable to lower trading and insurance income, which fell by 10% and 37% respectively, mainly reflecting weaker investment performance at Great Eastern Holdings.
Nevertheless, the bank’s other income segments delivered positive growth. Net interest income increased by 3.9% year on year to S$2.31 billion, supported by a 15% expansion in average assets, which more than offset the impact of an 18-basis-point contraction in net interest margin amid a lower interest rate environment. Meanwhile, net fee and commission income grew by 7.6% year on year to S$735 million, driven by broad-based improvements in fees, particularly from wealth management, loan and trade-related activities, and investment banking.
Despite the decline in total income, OCBC’s net profit rose by 3.2% year on year to S$2.04 billion, supported by a sharp 63% reduction in allowances, mainly due to lower allowances for impaired assets, as well as a 26% decline in the amortisation of intangible assets. This marked only the second time in the bank’s history that its quarterly net profit had exceeded the S$2 billion milestone.
Key Financial Ratios (2Q FY0226 vs. 3Q FY2026):
| 2Q FY2026 | 3Q FY2026 | Difference (in Percentage Points – pp) | |
| Net Interest Margin (%) | 1.70% | 1.66% | -0.04pp |
| Return on Equity (%) | 14.4% | 13.1% | -1.3pp |
| Non-Performing Loans Ratio (%) | 0.9% | 0.8% | -0.1pp |
Net interest margin declined by 0.04 percentage points quarter on quarter to 1.66%, mainly due to higher funding costs. However, OCBC expects the benefits of higher US benchmark interest rates to gradually materialise in the coming quarters as its assets reprice.
Non-performing assets decreased by 2.8% quarter on quarter to S$3,044 million, from S$3,132 million in the preceding quarter, with non-performing loans ratio dipping by 0.1 percentage point to 0.8%.
CEO Mr Tan Teck Long’s Comments & Outlook (from the Bank’s Press Release):
“Our strong third quarter 2026 results reflected our franchise strength and resiliency, with Group net profit rising 3% year-on-year to S$2.04 billion. This beat 3Q25, the strongest quarter last year. Banking operations total income and net profit rose 7% and 16% year-on-year to record highs. This was underpinned by strong performance across our Wealth Management and Wholesale Banking businesses as we continued to execute our Next Frontier strategy. Great Eastern’s underlying insurance business remained resilient. New business embedded value grew 14% year-on-year, driven by more than 20% growth in its agency and bancassurance channels in Singapore, even though profit contribution was lower from weaker investment performance in its insurance and shareholders’ funds.
Net interest income grew 4% year-on-year to S$2.31 billion, the highest over six quarters. We achieved 13% growth in non-interest income from Banking operations, anchored by strong growth in wholesale banking and wealth management fees. Customer flow trading income rose 29% to an all-time high.
Even as customer loans grew 14% year-on-year, asset quality remained sound, with our NPL ratio improving to 0.8%.
Great Eastern’s profit was weighed down by mark-to-market losses on its bond portfolios amid rising interest rates in 3Q26, and the absence of significant gains on its equity portfolio in 2Q26 that were not repeated this quarter. For the nine-month period, Great Eastern’s profit contribution rose 5% year-on-year to S$941 million.
Looking ahead, global conditions remain uncertain amid geopolitical tensions and elevated inflation risks. Much of the near-term outlook will depend on the easing of energy prices brought about by the war in the Middle East, while the market conditions in Indonesia are also being closely monitored. Meanwhile, AI and related technology sectors continue to register strong growth.
With our strong capital, funding and liquidity position, diversified income streams and disciplined risk management, we are well positioned to navigate uncertainties and tap the growth sectors to deliver sustainable long-term value.”
Closing Thoughts:
Overall, in my personal opinion, OCBC delivered a reasonably strong set of results, achieving several new highs in its financial performance for the first 9 months of FY2026. These included record customer flow income of S$1.35 billion, wealth management fees of S$1.33 billion, total income of S$11.73 billion, and net profit of S$6.24 billion.
For the 3rd quarter of FY2026, its net profit of S$2.04 billion marked only the second time in the bank’s history that quarterly earnings had surpassed the S$2 billion threshold.
OCBC’s non-performing loan ratio edged down by 0.1 percentage point quarter on quarter to 0.8%, making it the lowest among Singapore’s 3 local banks, compared with 0.9% at DBS and 1.5% at UOB.
The only notable weakness was the 22.8% year-on-year decline in other non-interest income, mainly due to lower contributions from trading and insurance activities.
Finally, given that OCBC distributes dividends on a half-yearly basis, no dividend was declared for this quarter.
Related Documents:
Press Release
CEO’s Presentation Slides
3rd Quarter 2026 Results Highlights
Reviews of Business Updates Posted by the Other Singapore-Listed Banks:
DBS Group Holdings Limited (SGX: D05): 3Q & 9M FY2026 Business Update Review
United Overseas Bank Limited (SGX: U11): 3Q & 9M FY2026 Business Update Review
Disclaimer: At the time of writing, I am a shareholder of Oversea-Chinese Banking Corporation Limited.
Join Me for a FREE Live Online Chit-Chat on Thursday, 12 November, from 8–9pm (SGT)!

It's been quite some time since I last had a live chit-chat with the investing community, and I’m excited to be back for another session! A big thank you to my friend, Dinah Poehlmann from Your Finance Mind, for inviting me once again!
This time, we’re taking a little break from REITs and exploring some interesting topics surrounding investing, including my go-to investing resources, when is a stock considered 'investable', my thoughts about using AI for stock analysis and trading, and much more.
Whether you're just starting your investing journey or have been investing for years, I hope this session will offer some useful perspectives and practical takeaways that you can apply to your own investing journey.
Best of all, the session is completely FREE to attend! All you need to do is register in advance to receive the Zoom link:
👉 Click here to reserve your spot!
Stop Spending Hours Reading REIT Reports Every Quarter!
What if you could assess a REIT's portfolio occupancy, debt profile, valuation, and overall health in less than 30 seconds - without having to comb through a single quarterly report?
That's the problem the REIT Screener was built to solve.
Developed through a collaboration between ShareInvestor and The Singaporean Investor, the REIT Screener consolidates many of the key metrics and indicators I personally use when analysing REITs into one easy-to-use platform. Instead of spending hours extracting data manually every earnings season, you can now monitor the REITs you own and research new opportunities in just a few clicks.
If you're serious about REIT investing but don't have the time to manually track quarterly developments, the REIT Screener could be the shortcut you've been looking for:
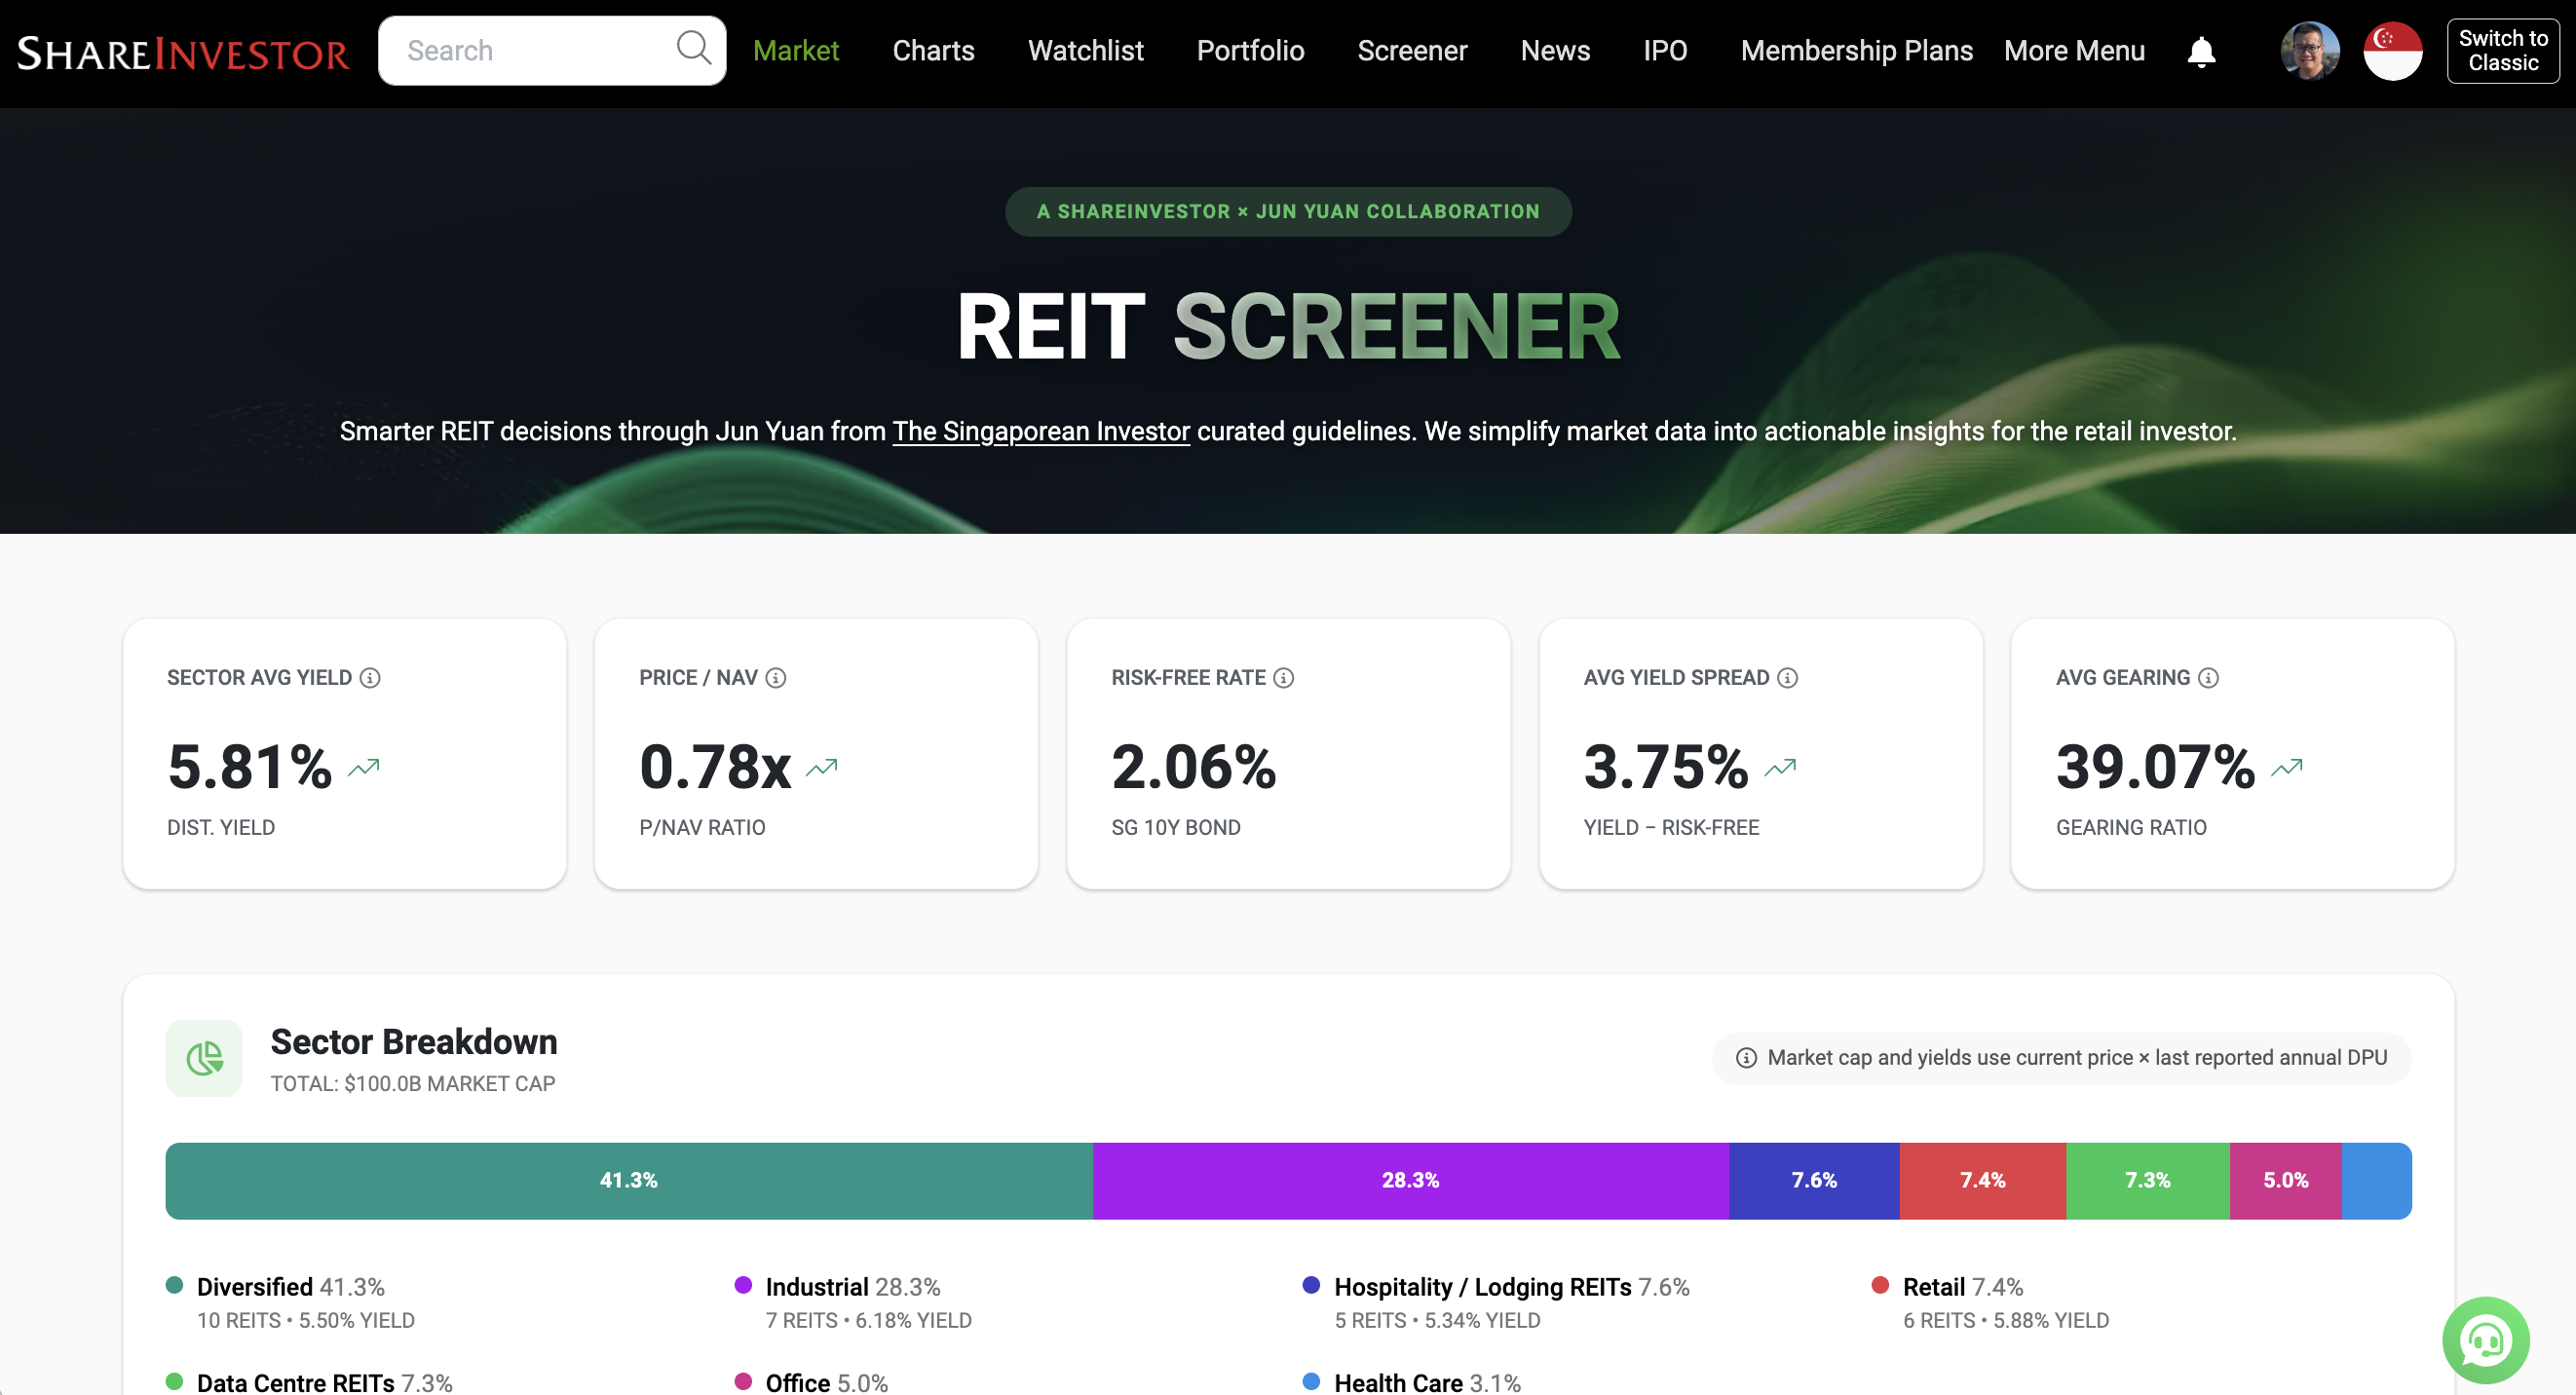
Take a closer look at the REIT Screener here...



Comments (0)