Brief Introduction:
DBS Group Holdings Limited (SGX: D05), commonly known as DBS, is not only Singapore’s largest bank but also the largest bank in Southeast Asia by assets.
Headquartered in Singapore, DBS has earned strong recognition for its financial strength and global standing, holding among the highest credit ratings in the world with ratings of ‘AA-’ and ‘Aa1’. The bank has also received numerous international accolades, including being named the ‘World’s Best Bank’ and ‘World’s Best AI Bank’ by Global Finance, ‘World’s Best Bank’ and ‘World’s Best Digital Bank’ by Euromoney, as well as ‘Global Bank of the Year’ by The Banker. In addition, Global Finance has recognised DBS as the ‘Safest Bank in Asia’ for 17 consecutive years from 2009 to 2025.
While DBS has established a presence across 19 markets globally, its key strategic focus remains on Asia, particularly Greater China, Southeast Asia, and South Asia, where the bank continues to deepen its regional footprint and growth opportunities.
Financial Figures (9M FY2025 vs. 9M FY2026):
| 9M FY2025 | 9M FY2026 | % Variance | |
| – Net Interest Income (S$’mil) | $10,907m | $10,786m | -1.1% |
| – Net Fee & Commission Income (S$’mil) | $3,799m | $4,374m | +15.1% |
| – Other Non-Interest Income (S$’mil) | $2,863m | $2,726m | -4.8% |
| Total Income (S$’mil) | $17,569m | $17,886m | +1.8% |
| Total Expenses (S$’mil) | $6,877m | $7,022m | +2.1% |
| Net Profit Attributable to Shareholders (S$’mil) | $8,675m | $8,822m | +1.7% |
DBS reported a mixed set of financial results for the first 9 months of FY2026. A double-digit increase in net fee and commission income helped offset declines in net interest income and other non-interest income, allowing the bank to achieve modest year-on-year growth of 1.8% in total income to S$17.89 billion and 1.7% in net profit to S$8.82 billion. Notably, both figures represented new highs for the bank.
Net interest income declined by 1.1% year on year to S$10.79 billion, as the moderation in net interest margin was partially offset by the benefits of hedging and balance sheet growth. Meanwhile, other non-interest income fell by 4.8% to S$2.73 billion, as a softer performance in the 3rd quarter moderated the stronger results achieved in the first half of FY2026.
The standout performer was net fee and commission income, which climbed 15.1% year on year to a record S$4.37 billion. This was largely driven by a 24% increase in wealth management fees to a new high of S$2.69 billion. Transaction services and card fees also reached record levels during the period.
Financial Figures (3Q FY2025 vs. 3Q FY2026):
| 3Q FY2025 | 3Q FY2026 | % Variance | |
| – Net Interest Income (S$’mil) | $3,578m | $3,711m | +3.7% |
| – Net Fee & Commission Income (S$’mil) | $1,357m | $1,432m | +5.5% |
| – Other Non-Interest Income (S$’mil) | $997m | $702m | -29.6% |
| Total Income (S$’mil) | $5,932m | $5,845m | -1.5% |
| Total Expenses (S$’mil) | $2,393m | $2,373m | -0.8% |
| Net Profit Attributable to Shareholders (S$’mil) | $2,954m | $2,813m | -4.8% |
DBS’ 3rd quarter results painted a somewhat different picture, with both total income and net profit registering single-digit year-on-year declines. This was largely attributable to a sharp 29.6% drop in other non-interest income, reflecting unfavourable market conditions during the quarter.
Net interest income, on the other hand, grew by 3.7% year on year to S$3.71 billion, as proactive hedging strategies and strong balance sheet growth more than offset the impact of lower SORA rates.
Net fee and commission income also continued to grow, rising by 5.5% year on year to S$1.43 billion. This was primarily driven by a 9% increase in wealth management fees against a high base in the same period last year, supported by growth in assets under management. Transaction services fees also reached a new high, while loan-related and card fees recorded further increases.
Key Financial Ratios (2Q FY2026 vs. 3Q FY2026):
| 2Q FY2026 | 3Q FY2026 | Difference (in Percentage Points – pp) | |
| Net Interest Margin (%) | 1.87% | 1.87% | – |
| Return on Equity (%) | 17.9% | 16.0% | -1.9pp |
| Non-Performing Loans Ratio (%) | 1.0% | 0.9% | -0.1pp |
Net interest margin remained stable at 1.87%, unchanged from the previous quarter.
Asset quality improved slightly, with the non-performing loans ratio declining by 0.1 percentage point to 0.9%. This was supported by a 2.7% quarter-on-quarter reduction in non-performing assets, which fell to S$4.63 billion from S$4.76 billion in the preceding quarter.
Dividend Payout to Shareholders:
3Q FY2025 vs. 3Q FY2026:
Unlike its local peers, DBS is the only Singapore bank that distributes dividends on a quarterly basis, while both UOB and OCBC maintain a half-yearly dividend payout schedule.
Similar to the previous two quarters, DBS declared a total dividend of 81.0 cents per share, comprising an ordinary dividend of 66.0 cents and a capital return dividend of 15.0 cents:
| 3Q FY2025 | 3Q FY2026 | % Variance | |
| Dividend Per Share (S$’cents) | 75.0 cents | 81.0 cents | +8.0% |
Shareholders of DBS should take note of the following important dates for the upcoming dividend payment:
Ex-Date: 13 November 2026
Record Date: 16 November 2026
Payout Date: 24 November 2026
9M FY2025 vs. 9M FY2026:
| 9M FY2025 | 9M FY2026 | % Variance | |
| Dividend Per Share (S$’cents) | 225.0 cents | 243.0 cents | +8.0% |
For the first three quarters of FY2026, DBS maintained its dividend payout at 81.0 cents per share each quarter, representing an 8.0% increase compared to the 75.0 cents per share paid during the corresponding period a year ago.
CEO Ms Tan Su Shan’s Comments & Outlook (from the Bank’s Press Release):
“We turned in another quarter of strong franchise growth, with robust increases in loans, deposits and wealth assets. Nine-month net profit reached a record and return on equity was 17% despite average Sora having halved from a year ago and heightened geopolitical uncertainty. The performance reflected our ability to capture structural opportunities across wealth management and institutional banking.
While the global economy has remained resilient, the outlook has become more uncertain amid elevated energy prices, tighter financial conditions and geopolitical risks. As we enter 2027, we will stay nimble to capture opportunities while prudently managing risks. A more supportive interest rate environment and continued structural growth opportunities would benefit earnings, while our strong capital and liquidity positions and healthy general allowance buffers provide resilience against macroeconomic uncertainty.”
Closing Thoughts:
DBS’ financial performance for the 3rd quarter and the first 9 months of FY2026 was admittedly not the strongest. However, I have always maintained that a single quarter of weaker results does not necessarily undermine the longer-term fundamentals of a company.
One of the key bright spots was its net fee and commission income, which continued to reach new highs across several areas. In the 3rd quarter, transaction services fees hit a new record, while assets under management in its wealth management business also reached a new high. For the first 9 months of FY2026, net fee and commission income climbed to a record S$4.37 billion, supported by new highs in transaction services and card fees. Notably, the bank also achieved record levels of total income and net profit over the same nine-month period.
Another positive development was the improvement in asset quality, with the non-performing assets ratio declining by 0.1 percentage point quarter on quarter to 0.9%, alongside a 2.7% reduction in non-performing assets compared to the preceding quarter.
Finally, DBS maintained its quarterly dividend payout at 81.0 cents per share, comprising an ordinary dividend of 66.0 cents and a capital return dividend of 15.0 cents.
Related Documents:
3Q2026 Trading Update
3Q2026 CEO Presentation
3Q2026 CFO Presentation
Reviews of Business Updates Posted by the Other Singapore-Listed Banks:
United Overseas Bank Limited (SGX: U11): 3Q & 9M FY2026 Business Update Review
Disclaimer: At the time of writing, I am a shareholder of DBS Group Holdings Limited.
Join Me for a FREE Live Online Chit-Chat on Thursday, 12 November, from 8–9pm (SGT)!

It's been quite some time since I last had a live chit-chat with the investing community, and I’m excited to be back for another session! A big thank you to my friend, Dinah Poehlmann from Your Finance Mind, for inviting me once again!
This time, we’re taking a little break from REITs and exploring some interesting topics surrounding investing, including my go-to investing resources, when is a stock considered 'investable', my thoughts about using AI for stock analysis and trading, and much more.
Whether you're just starting your investing journey or have been investing for years, I hope this session will offer some useful perspectives and practical takeaways that you can apply to your own investing journey.
Best of all, the session is completely FREE to attend! All you need to do is register in advance to receive the Zoom link:
👉 Click here to reserve your spot!
Stop Spending Hours Reading REIT Reports Every Quarter!
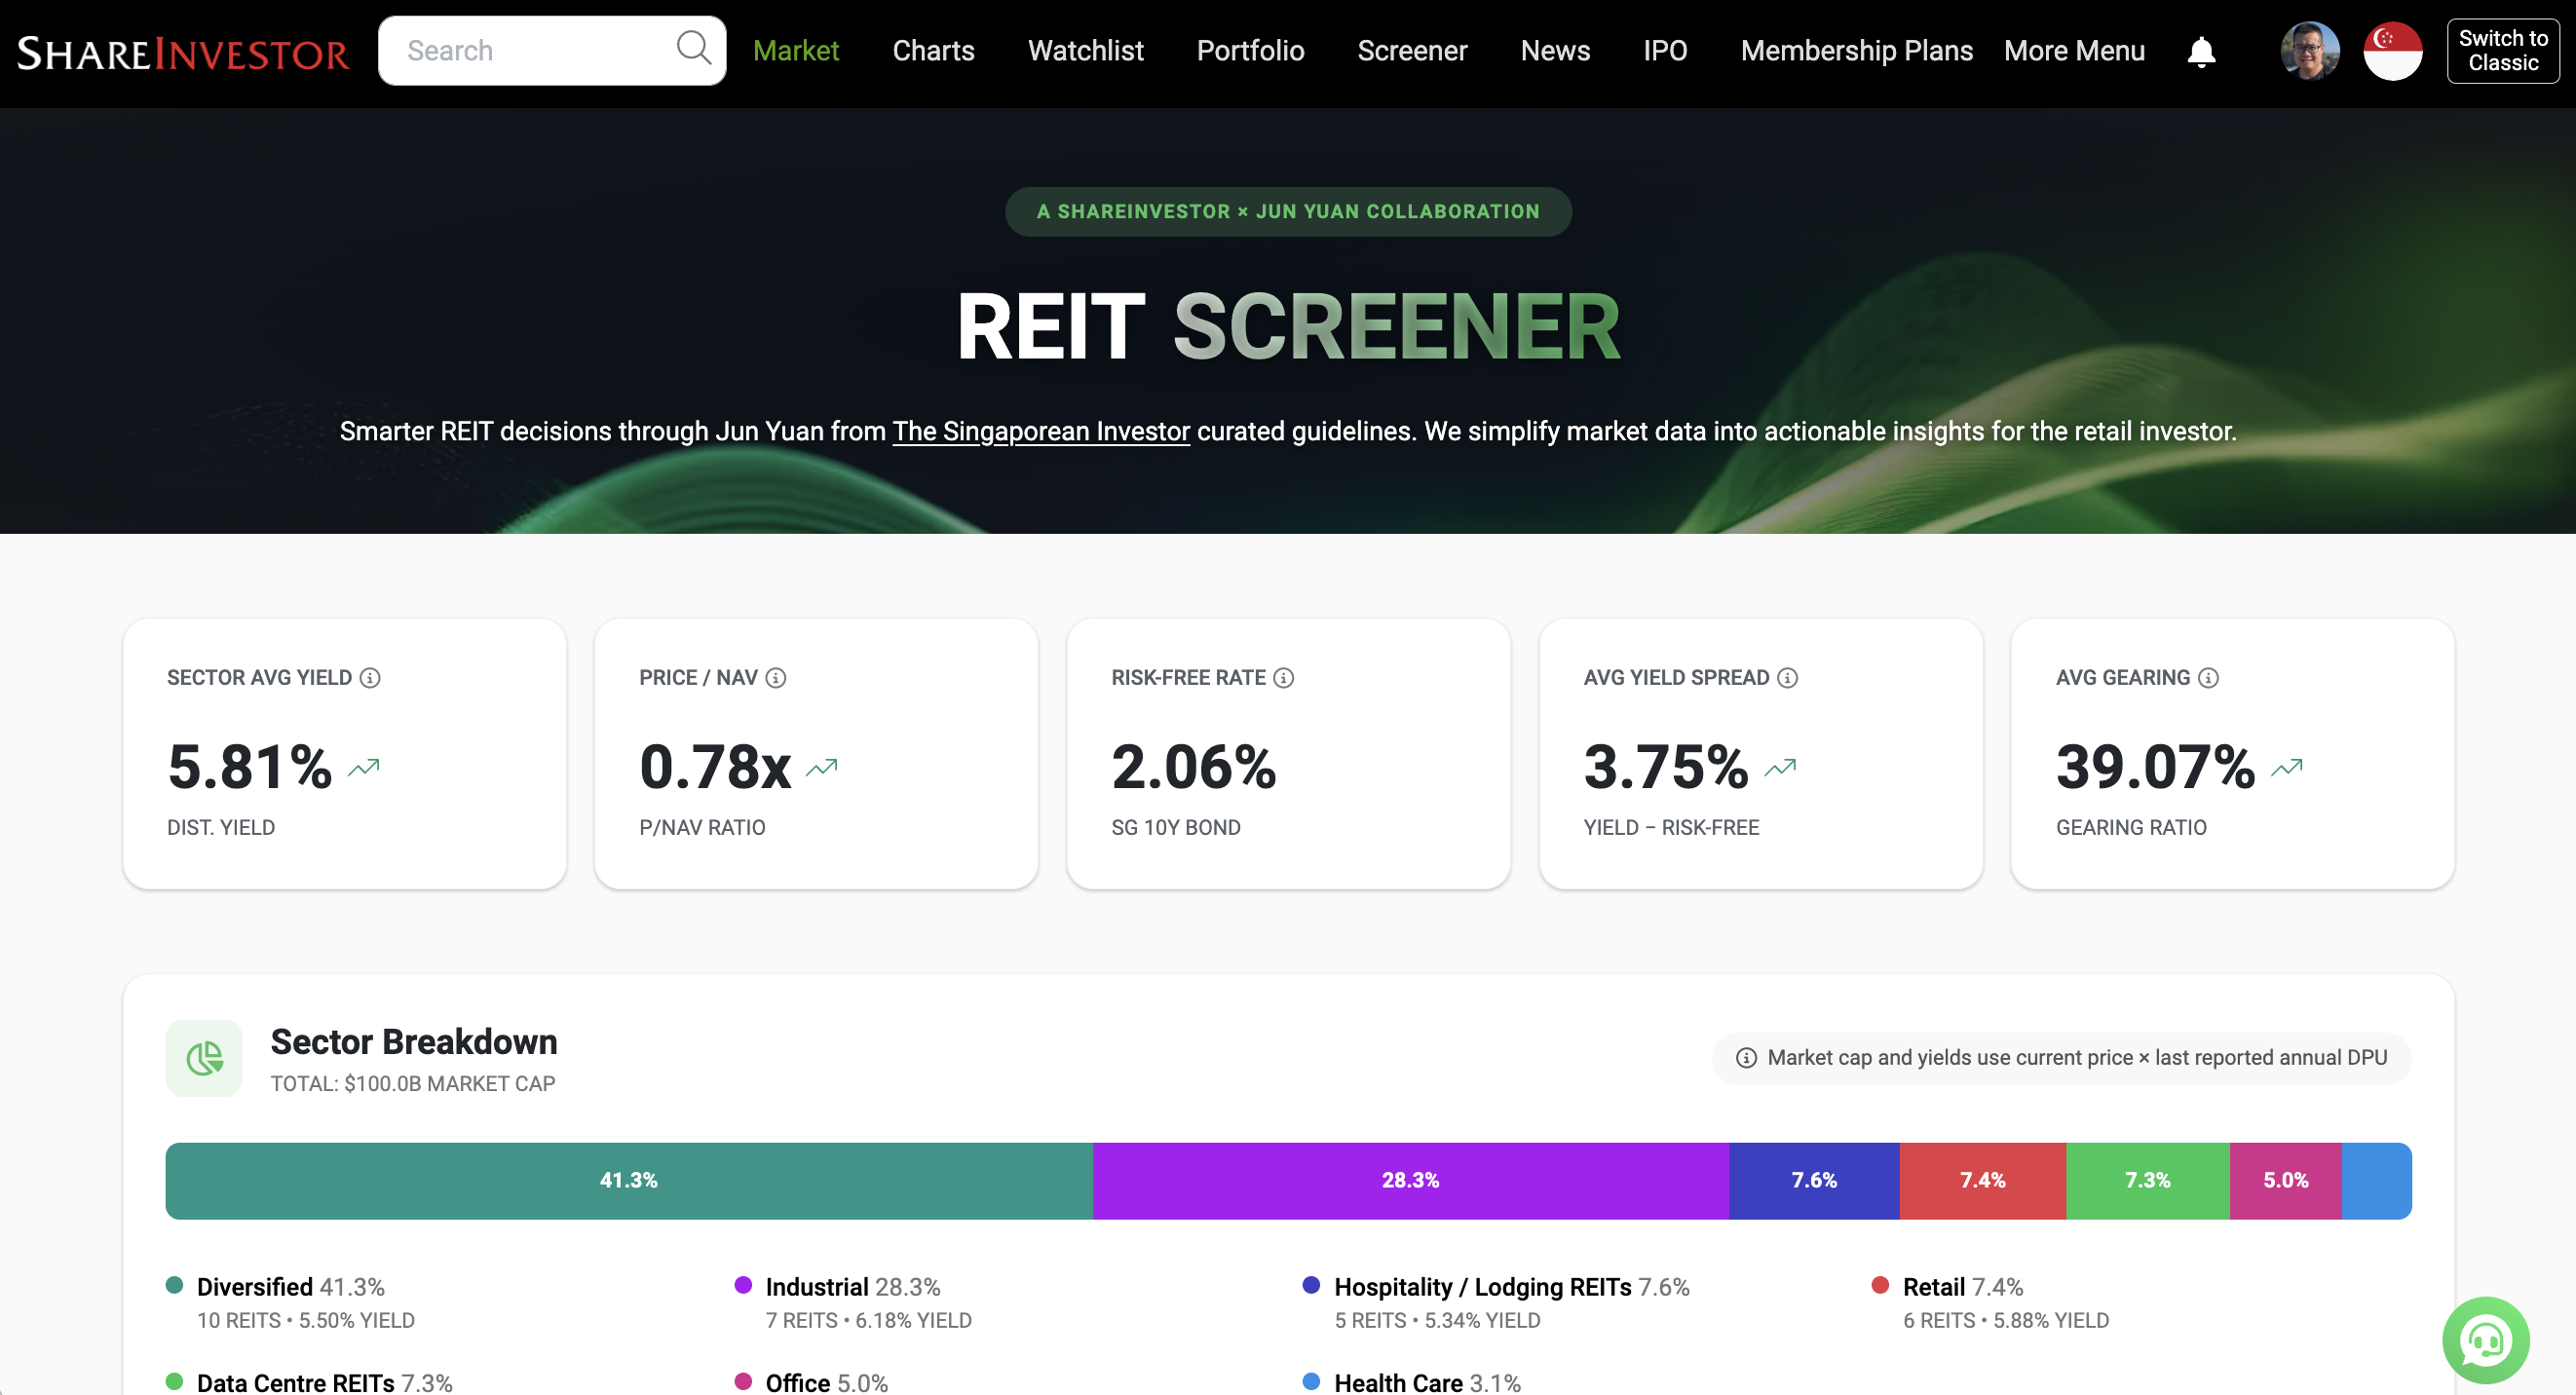
What if you could assess a REIT's portfolio occupancy, debt profile, valuation, and overall health in less than 30 seconds - without having to comb through a single quarterly report?
That's the problem the REIT Screener was built to solve.
Developed through a collaboration between ShareInvestor and The Singaporean Investor, the REIT Screener consolidates many of the key metrics and indicators I personally use when analysing REITs into one easy-to-use platform. Instead of spending hours extracting data manually every earnings season, you can now monitor the REITs you own and research new opportunities in just a few clicks.
If you're serious about REIT investing but don't have the time to manually track quarterly developments, the REIT Screener could be the shortcut you've been looking for:
Take a closer look at the REIT Screener here...



Comments (0)