I’m sure you would have come across the ETF by the name of ‘iShares Russell 2000 ETF’ (NYSE ARCA:IWM) but wondering what is it.
This is the reason why I’m writing this post. Just as the title suggests, you will read about the basics you need to know about the US-listed ETF:
What Does the ETF Comprise?
The iShares Russell 2000 ETF, as the name suggests, tracks the performance of the Russell 2000 index – where it comprises 2,000 of the smallest US-listed companies by market capitalisation (which can be calculated by multiplying the company’s stock price by the number of outstanding shares).
What is the Criteria for Companies to be Included in the Index?
To my understanding, the company has to be a US company, a market capitalisation of at least US$50 million, and have a minimum trading volume of 250,000 shares a day (this ensures the index is not overly impacted by illiquid stocks).
What is the Biggest Benefit of Investing in the ETF?
I know of some growth investors who like to invest in these small cap companies (typically those with a market capitalisation of between $300m and $2bn), as their potential capital appreciation opportunities are the greatest should they continue to record a performance that exceeds expectations. On the contrary, the company’s share price will also take a huge hit if it fails to perform up to expectations, and investors will risk suffering from a huge monetary loss from their investment in the company.
That said, I’m not saying that you will not suffer from monetary losses by investing in the ETF, as just like all investments, there’s a certain level of risk. However, the risk is much lower, because when you invest in this one single ETF, you get instant diversification to 2,000 companies. To dive in further, apart from Super Micro Computer Inc (NASDAQ:SMCI) which have a 0.60% weightage, all the other 1,999 companies have a weightage of no more than 0.35%. Hence the risk of a poor performance from a single company ‘pulling down’ the ETF is extremely low.
Are There Any Risks in Investing in the ETF?
I would say volatility risk, for these small cap companies are naturally more volatile (in terms of its share price movements, and especially so if the broad market sentiments is weak) than the larger cap ones. As a result, the ETF could see larger price swings.
What is the Expense Ratio of the ETF?
It is at a low of just 0.19%.
In Which Sectors are the Companies in the ETF in?
The following are the sectors, along with their weightage in the construct of the ETF (in percentage terms):
- Industrials (17.43%)
- Financials (16.66%)
- Healthcare (14.38%)
- Information Technology (13.50%)
- Consumer Discretionary (10.79%)
- Energy (7.55%)
- Real Estate (6.12%)
- Materials (4.58%)
- Consumer Staples (3.45%)
- Utilities (2.88%)
- Communication (2.42%)
What are the Top 10 Constituents of the ETF?
The following are the top 10 companies (where 4 of them are in the information technology sector, 3 in the Industrials sector, 1 in the consumer discretionary sector, 1 in the consumer staples sector, and 1 in the Energy sector) with the heaviest weightage in the ETF, along with a brief description of their businesses:
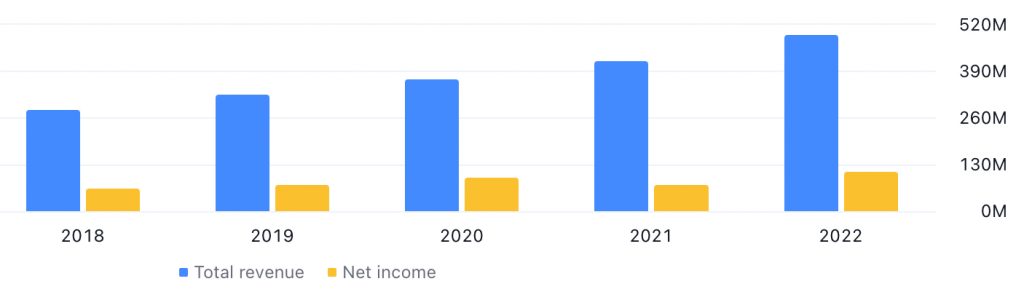
1. Super Micro Computer Inc (NASDAQ:SMCI, 0.60% weightage)
Super Micro Computer Inc is a rack-scale total IT solutions provider that designs and builds an environmentally-friendly and energy saving portfolio of servers, storage systems, switches, software, along with providing global support services.
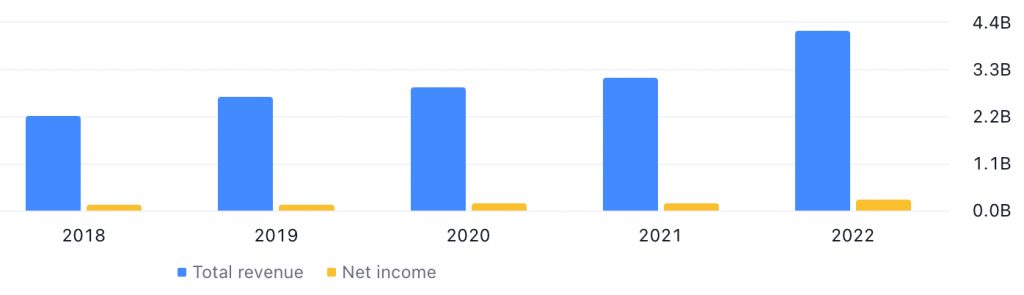
The following is the company’s total revenue and net income (also known as net profit) performance over the last 5 years:
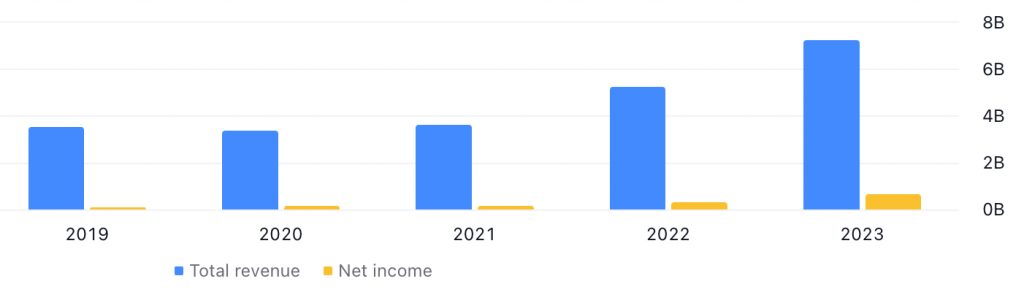
For its total revenue, apart from in FY2020 (where it fell by 4.6%), it saw improvements every single year, and growing at a compound annual growth rate (CAGR) of 15.3%. Its net profit saw growth throughout the entire 5-year period I have looked at, and growing at a CAGR of 54.8% – which is very impressive in my opinion.
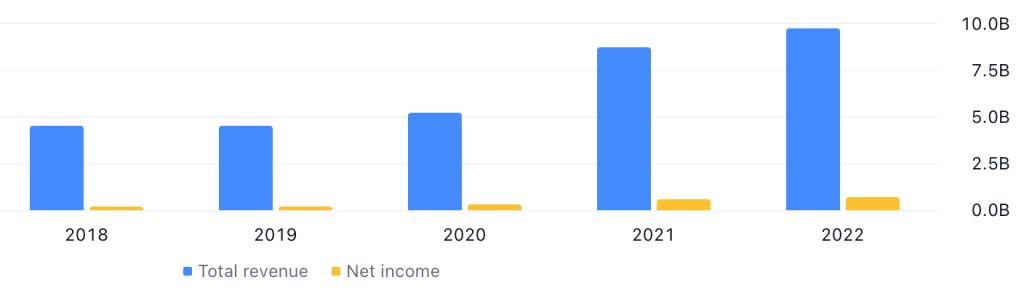
2. Light & Wonder Inc (NASDAQ:LNW, 0.35% weightage)
Previously known as Scientific Games Corporation (a name now taken by the divested lottery business), the company is a leading developer of technology-based products and services and associated content for the worldwide gaming (where they provide products such as slot machines, table games, shuffling machines, and casino management systems), social, and digital gaming industries.
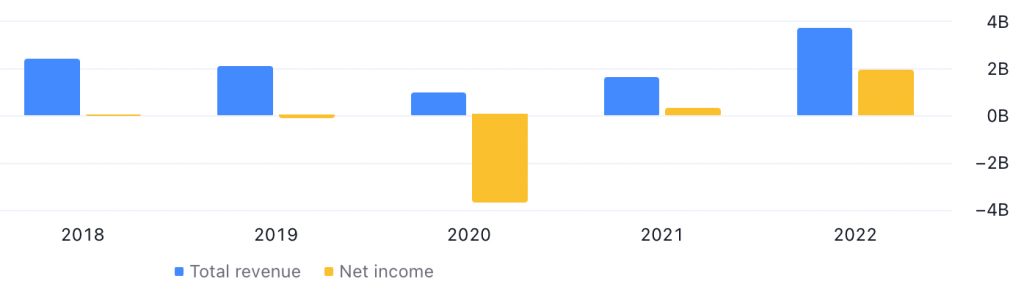
The following is the company’s total revenue and net income performance over the last 5 years (it has a financial year ending every December):
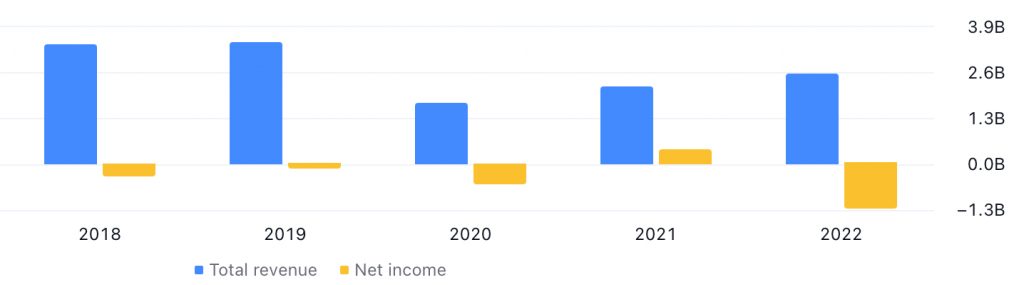
After climbing to a high of $3.4bn in FY2019, the company’s total revenue fell to a low of $1.7bn in the following year before recovering in the subsequent years. However, its net income performance has ben inconsistent, where it was in a net loss position in 2 out of 5 years (in FY2020 and FY2022).
3. Rambus Inc (NASDAQ:RMBS, 0.33% weightage)
Rambus Inc is an industry-leading provider of chips, silicon IP and innovations that address the fundamental challenges of accelerating data and enable critical performance improvements for data centres and other growing markets.
With a financial year ending every December, the following is the company’s total revenue and net income performance:
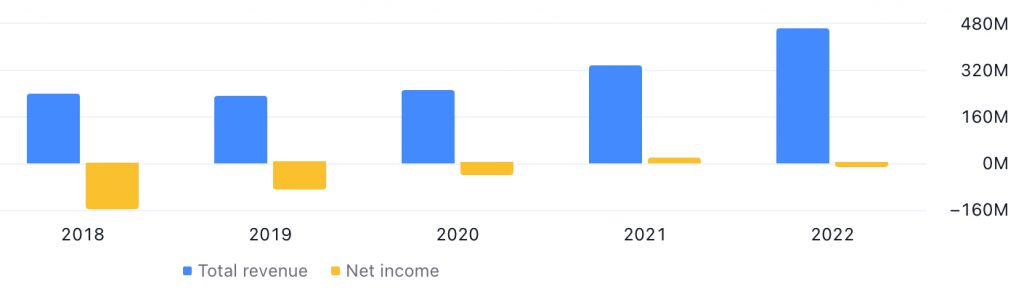
For its total revenue, apart from in FY2019 (where it declined by 3%), it saw year-on-year (y-o-y) improvements in 4 out of 5 years, and recording a CAGR of a decent 14.5%. However the company is in a net loss position in 4 out of 5 years (with the only year the company in a net profit position in FY2021).
4. Simpson Manufacturing Inc (NYSE:SSD, 0.31% weightage)
Headquartered in Pleasanton, California, through its subsidiary, Simpson Strong-Tie Company Inc, Simpson Manufacturing Inc designs, engineers, and is a leading manufacturer of wood construction projects, including connectors, truss plates, fastening systems, fasteners and shear walls, anchored concrete construction projects, including adhesives, specialty chemicals, mechanical anchors, powder actuated tools, and reinforcing fibre materials.
The following is the company’s total revenue and net income over the last 5 years (it has a financial year ending every December):
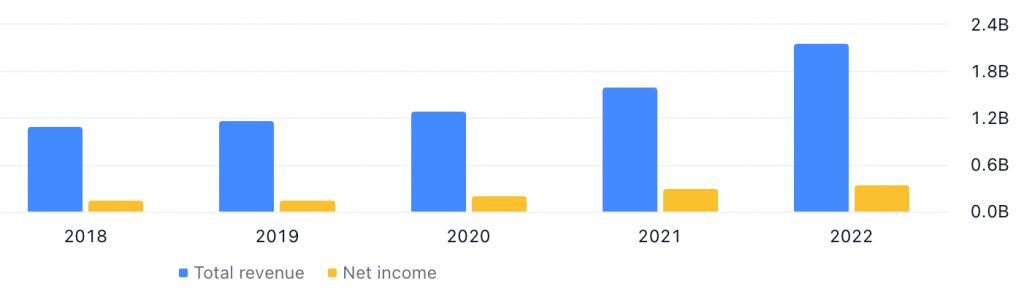
Both its gross revenue and net profit saw stable growth over the years, where it recorded year-on-year growth every single year. In terms of their CAGR, the former was at 14.4%, and the latter was at 21.4%.
5. Comfort Systems USA Inc (NYSE:FIX, 0.31% weightage)
With more than 43 operating companies in approximately 173 locations across the United States, Comfort Systems USA Inc is a leading building and service provider for mechanical, electrical, modular, and plumbing building systems.
The following is the company’s total revenue and net income growth over the last 5 years (it has a financial year ending every December):
In my opinion, the company has recorded a stable performance over the last 5 years, with its total revenue recording improvements every single year, and growing at a CAGR of 13.7%. Its net income improved in 4 out of 5 years (with the only exception in FY2021, where it fell by 4.5%), and recording a CAGR of 16.9%.
6. Chord Energy Corp (NASDAQ:CHRD, 0.30% weightage)
Chord Energy Corp is in the business of acquiring, exploiting, developing, and exploring crude oil, natural gas, and natural gas liquids, helping to supply the energy that powers and improves daily life around the world.
With a financial year ending every December, the following is the company’s total revenue and net income over the last 5 years:
Even though its total revenue fell in 2 out of the 5 years (in FY2019 and FY2020) we have looked at, it still managed to grow at a CAGR of 9.5%. Looking at its net income, it has reversed into a net profit position in FY2021, and further improved in FY2022 – which is good to note.
7. Bellring Brands Inc (NYSE:BRBR, 0.30% weightage)
Bellright Brands Inc is a wholly-owned subsidiary of Post Holdings Inc. The company ids a leader in the global convenient nutrition category, aiming to enhance the lives of its consumers by providing them with nutritious, great tasting products they can enjoy throughout the day. Products (under the primary brands ‘Premier Protein’ and ‘Dymatize’) include ready to drink protein shake, as well as other ready to drink beverage and powders.
The company has a financial year ending every September, and the following is its total revenue and net income recorded over the last 5 years:
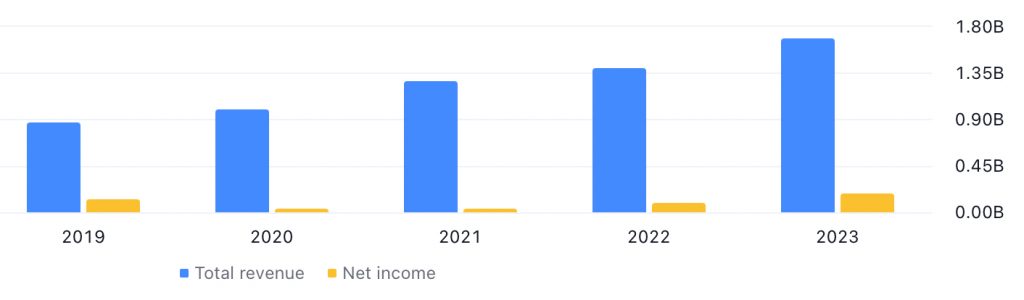
As you can see from the above, the company have recorded a rising total revenue, where it has improved every single year over the last 5 years, and growing at a CAGR of 14.3%. For its net income, apart from FY2020, it has recorded an improving performance in the other 4 years, and growing at a CAGR of 6.10% over a 5-year period.
8. Onto Innovation Inc (NYSE:ONTO, 0.30% weightage)
Onto Innovation Inc is a worldwide leader in the design, development, manufacture, and support of metrology and inspection tools for the semiconductor industry, including process control tools that perform optical metrology on patterned and unpatterned wafers, wafer macro-defect inspection, including the macro-inspection of both 2D and 3D wafer features, wafer substrate and panel substrate lithography systems, and process control analytical software.
Its products are primarily used by silicon wafer manufacturers, semiconductor device fabricators, and advanced packaging manufacturers operating in the semiconductor market.
The following is the company’s total revenue and net income recorded over the last 5 years (it has a financial year ending every December):
Its total revenue grew every single year over the last 5 years, and recording a CAGR of a very impressive 29.8%. Its net income saw growths in 4 out of 5 years (the only year its net income declined was in FY2019), and a CAGR of 37.7%
9. Qualys Inc (NASDAQ:QLYS, 0.30% weightage)
Qualys Inc is a pioneer and leading provider of a cloud-based platform delivering information technology, security, and compliance solutions – all of which enabling its customers to protect their systems and applications from the ever-evolving cyber-attacks, and helps achieve compliance with internal policies and external regulations.
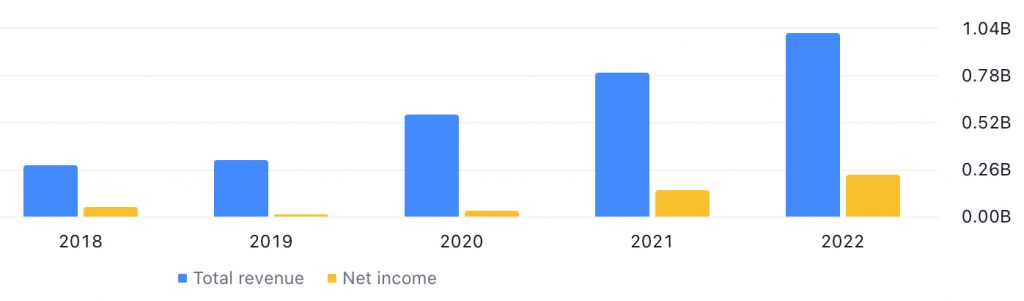
The company has a financial year end every December, and the following is its total revenue and net income growth over the last 5 years:
In terms of its total revenue growth, it has been on a stable upward moving trend over the last 5 years, and growing at a CAGR of 11.8%. For its net income, apart from a dip in FY2021, the remaining years saw this financial figure recording growth. Over a 5-year period, the company’s net income saw a CAGR of 13.5%.
10. UFP Industries Inc (NASDAQ:UFPI, 0.30% weightage)
Headquartered in Grand Rapids, Michigan, UFP Industries, Inc. is a holding company with subsidiaries throughout North America, Europe, Asia, and Australia that design, manufacture, and supply products made from wood, wood and non-wood composites, and other materials to three markets: retail, packaging, and construction.
The company has a financial year end every December, and the following is its total revenue and net income growth over the last 5 years:
For its total revenue, apart from a slight 1.6% dip in FY2019, the remaining 4 years saw its total revenue recording improvements compared to the previous year – throughout the 5-year period, this financial figure grew at a CAGR of 16.5%. Looking at its net income, it saw improvements every single year over the last 5 years, and recording a CAGR of an impressive 35.6%.
What is the Performance of the ETF over the Years Like?
The following is how the price of the ETF have moved over the years (on a yearly timeframe):
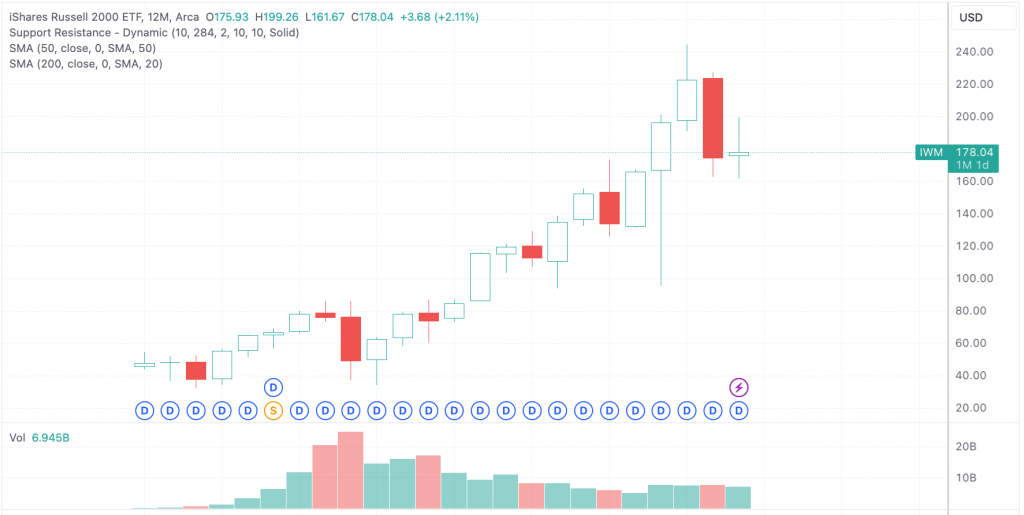
Movement of the iShares Russell 2000 ETF on a Yearly Timeframe
If you had invested in the ETF back when it was listed in the year 2000 at US$45.53 and stay invested, at the time of writing, based on its current traded price of US$178.04 (as at market close on 28 November 2023), you would be sitting on a capital gain of slightly more than 290%.
Do I Receive Dividends as an Investor of the ETF?
Yes, if you are invested in the ETF, you’ll receive dividends on a quarterly basis – however, do take note that if you are a Singaporean investing in the ETF, all payouts are subjected to a 30.0% withholding tax (meaning to say the dividends you eventually receive will be 30.0% lesser than the amount declared.)
The following is the ETF’s dividend payout over the last 5 years (between the year 2018 and 2022), taken from StockAnalysis.com:
| 2018 | 2019 | 2020 | 2021 | 2022 | |
| Dividend Per Share (US$) | $1.88 | $2.09 | $2.05 | $2.09 | $2.58 |
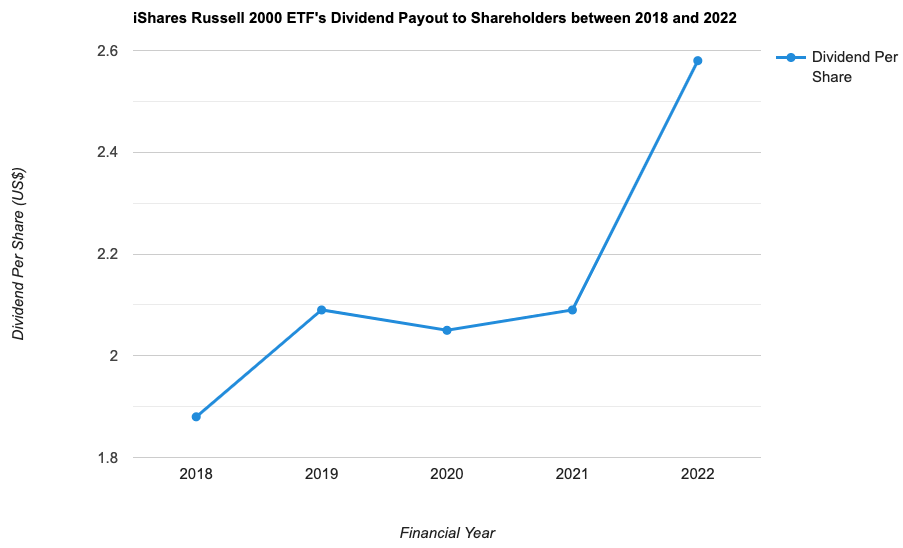
Apart from in 2020, the ETF’s dividend payouts saw improvements every single year, and growing at a CAGR of 6.5% over a period of 5 years – pretty decent in my opinion.
How Do I Invest in the ETF?
You can buy and sell the iShares Russell 2000 ETF (NYSE ARCA:IWM) just like you buy and sell shares of any companies listed on the stock market.
Closing Thoughts
I hope I have covered the basics you need to know about the iShares Russell 2000 ETF – to summarise, this ETF tracks the Russell 2000 Index, which comprises of 2,000 of the smallest US-listed companies by market capitalisation (hence by investing in this index, you can get instant diversification to 2,000 companies.)
In terms of weightage, in my opinion the index is very well diversified, with no concentration risk, because apart from Super Micro Computer Inc (which have a weightage of about 0.60%), no one single company have a weightage of more than 0.35%.
Finally, in terms of expense ratio, it is at a low of just 0.19%.
With that, I have come to my share of the iShares Russell 2000 ETF. As always, I hope you have found the contents presented in this post useful, and that you now have a much better understanding of the US-listed ETF. Do take note that everything you have just read is for educational purposes only, and they do not represent any buy or sell calls for the ETF. You’re strongly encouraged to do your own due diligence before you make any investment decisions.
Disclaimer: At the time of writing, I am not invested in the iShares Russell 2000 ETF.
Stop Spending Hours Reading REIT Reports Every Quarter!
What if you could assess a REIT's portfolio occupancy, debt profile, valuation, and overall health in less than 30 seconds - without having to comb through a single quarterly report?
That's the problem the REIT Screener was built to solve.
Developed through a collaboration between ShareInvestor and The Singaporean Investor, the REIT Screener consolidates many of the key metrics and indicators I personally use when analysing REITs into one easy-to-use platform. Instead of spending hours extracting data manually every earnings season, you can now monitor the REITs you own and research new opportunities in just a few clicks.
If you're serious about REIT investing but don't have the time to manually track quarterly developments, the REIT Screener could be the shortcut you've been looking for:

Take a closer look at the REIT Screener here...


Comments (0)