India is currently the 2nd highest populated country in the world – at 1,399,179,585, compared to China’s 1,413,142,846 (according to statistics by census.gov as at 1st July 2023), the country is poised to be the world’s most populated country by 2027.
Not only that, according to an article published on Forbes India, the country is also the 5th largest economy in the world in 2024 (behind the United States, China, Germany, and Japan).
Personally, I am bullish in the country’s growth in the years ahead due to 2 main reasons: its affluent young population, and also the country being one of the beneficiaries of the trade war between US and China (where there is an increasing number of companies moving their manufacturing plants out of China and into India). On the flip side, I understand that some may be concerned by the country’s weak currency (in the Indian Rupee).
However, for those of you who would like to invest in the country, one of the ways to do so is to invest in the iShares MSCI India ETF (NYSE ARCA:INDA).
In today’s post, I will be sharing with you the essentials about the ETF you need to know, so you will have a better understanding about it.
Let’s begin:
What does the iShares MSCI India ETF Track?
Incepted since 02 February 2012, and just like the name of the ETF suggests, it tracks the performance of the MSCI India Index – where it comprises 131 of the most liquid large and mid cap companies listed on the Indian market. You can read the factsheet of the Index here.
What are the Sectors that Make Up this ETF?
The following is a breakdown of the sectors that make up the iShares MSCI India ETF, and their weightage in brackets:
- Financials (26.09% Weightage)
- Information Technology (12.59% Weightage)
- Consumer Discretionary (11.61% Weightage)
- Energy (10.46% Weightage)
- Consumer Staples (8.78% Weightage)
- Materials (8.55% Weightage)
- Industrials (8.26% Weightage)
- Healthcare (5.09% Weightage)
- Utilities (4.46% Weightage)
- Communication (2.95% Weightage)
- Real Estate (0.96% Weightage)
Cash and/or derivatives make up the remaining 0.21% of the ETF.
Top 10 Companies with the Heaviest Weightage on the iShares MSCI India ETF
At the time of writing of this post, the top 10 Indian-listed companies with the heaviest weightage on the ETF have a combined weightage of 38.09% – with no one company comprising a weightage of more than 8.03%.
In terms of the sectors which the top 10 companies are in, 4 are in the financial sector (with a combined weightage of 14.64%), 2 are in the information technology sector (with a combined weightage of 8.5%), 1 in the energy sector (with a weightage of 8.03%), 1 in the communication sector (with a weightage of 2.37%), 1 in the industrial sector (with a weightage of 2.36%), and 1 in the consumer staples sector (with a weightage of 2.19%) – in my personal opinion, it is very well-diversified.
The following are more information about each of the companies – including an overview of its business, along with its 5-year financial performance (revenue and net income):
1. Reliance Industries Ltd (NSE:RELIANCE) (8.03% Weightage, Energy Sector)
Reliance Industries Ltd has the heaviest weightage in the iShares MSCI India ETF, at 8.03%.
The company is a Fortune 500 company and the largest private sector corporation in India. The conglomerate operates in a number of business segments:
(i) Retail – they are the largest retailer by revenue, scale and profitability, operating through an integrated network of stores, digital platforms, and merchant partners;
(ii) Digital Services – the company has the largest all IP telecom network where it connects well over 99% of India’s population, with cloud-native and 5G-ready capabilities;
(iii) Media and Entertainment – one of India’s largest media houses with omni-channel presence;
(iv) Oil to Chemicals – one of the world’s most deeply integrated oil to chemicals operations;
(v) Oil and Gas E&P (Exploration & Production) – upstream portfolio comprising deep and ultra deep water and gas fields and coal bed methane blocks in India;
(vi) New Energy – building technologies, scaling capacities and creating a new energy ecosystem for India and Reliance Industries Ltd to achieve the ambition of net carbon zero;
(vii) JioGenNext – a startup accelerator backed by Reliance Industries Ltd, to encourage support and enable ventures that solves new age challenges.
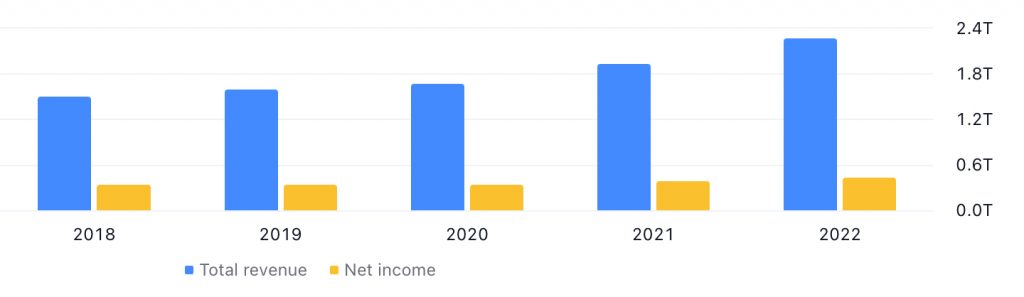
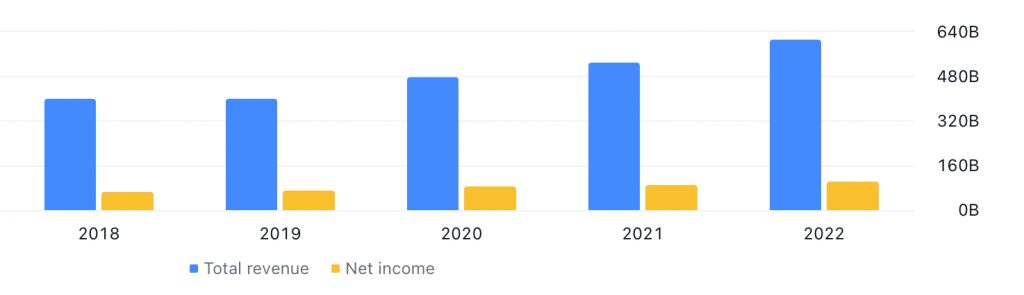
The following is Reliance Industries Ltd’s financial performances between 2018 (ended March 2019) and 2022 (ended March 2023). The company have a financial year end every March:
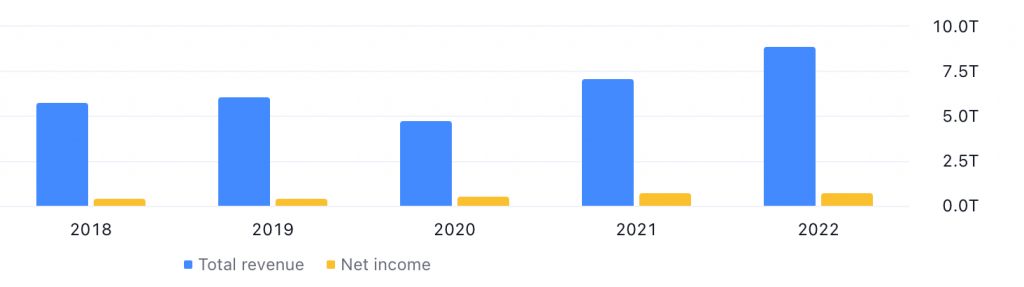
Reliance Industries Ltd’s Revenue & Net Income between 2018 (Ended March 2019) and 2022 (Ended March 2023) – Source: TradingView.com
Over the last 5 financial years, its total revenue grew from INR5.68 trillion in 2018 to INR8.76 trillion in 2022 – it recorded year-on-year (y-o-y) improvements every single year except in 2020 (where it fell by about 22%); in terms of its compound annual growth rate (CAGR) over a 5-year period, it is at 9.1%.
The growth of its net income in the same time period was also on the rise (except for 2019, where it edged down by 0.6%), and recording a CAGR of 11.0%.
2. ICICI Bank Ltd (NSE:ICICIBC) (5.21% Weightage, Financials Sector)
Coming in 2nd place in terms of weightage is ICICI Bank Limited, at 5.21% at the time of writing (the other company with a 5+% weightage is Infosys Ltd, which we will be looking at in a moment).
ICICI Bank Ltd is a leading Indian multinational bank and financial services company, where it has a presence in 17 countries, providing services to Indian businesses and individuals both in its home country as well as abroad. The bank offers a vast array of services, including retail banking, corporate banking, along with other services such as insurance, asset management, and investment banking through various channels and subsidiaries.
The Indian bank has a financial year end every March, and the following is its financial performance over the last 5 years – between 2018 (ended March 2019) and 2022 (ended March 2023):
ICICI Bank Ltd’s Revenue & Net Income between 2018 (Ended March 2019) and 2022 (Ended March 2023) – Source: TradingView.com
In terms of its total revenue growth, apart from in 2022 (where its total revenue slid by 2.5%), the remaining years saw its total revenue growing on a y-o-y basis. Over a 5-year period, ICICI Bank’s total revenue grew at a CAGR of 7.3%.
However, its net income saw improvements every single year, growing from INR42.54 billion in 2018 to INR340.37 billion in 2022 – recording a CAGR of a very impressive 51.6%.
3. Infosys Ltd (NSE:INFY) (5.05% Weightage, Information Technology Sector)
Infosys Ltd is the other Indian-listed company with a weightage of slightly above 5% in the iShares MSCI India ETF.
Established in 1981 from a capital of just US$250, the company is currently a global leader in next-generation digital services and consulting, where they now have a market capitalisation of approximately US$72.35 billion.
Some of the company’s main business areas include:
(i) Digital transformation – where they help businesses adopt and embrace digital technologies like cloud computing, artificial intelligence, and automation to improve their operations, experience for their customers, and competitiveness;
(ii) Consulting services – including strategy consulting, business process optimisation, technology consulting, and human capital management services to help businesses streamline their operations, make informed decisions, and achieve their goals;
(iii) Application development and maintenance – where the company develops and maintains custom software, web, and mobile applications for businesses;
(iv) Cloud services – services provided by the company include cloud migration, cloud infrastructure management, and cloud-native applications development to help businesses leverage on the scalability, agility, and cost-effectiveness of cloud computing;
(v) Data and analytics – Some of the services provided include data warehousing, data visualisation, business intelligence, and machine learning to help businesses gain insights from their data and make data-driven decisions.
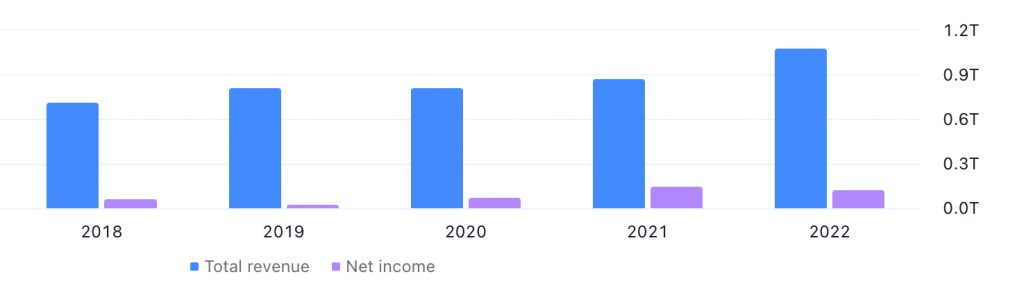
The following is Infosys Ltd’s financial performance recorded over the last 5 years – between FY2018 (ended March 2019) and FY2022 (ended March 2023). The company has a financial year end every March:
Infosys Ltd’s Revenue & Net Income between 2018 (Ended March 2019) and 2022 (Ended March 2023) – Source: TradingView.com
Both its total revenue and net income saw y-o-y gains every single year over the last 5 years – with the former growing from INR826.75 billion in 2018 to INR1.47 trillion in 2022, a CAGR of 12.2%, and the latter growing from INR154.04 billion in 2018 to 240.95 billion in 2022, a CAGR of 9.4%.
4. HDFC Bank Ltd (NSE:HDFCB) (4.79% Weightage, Financials Sector)
HDFC Bank Ltd has a comprehensive distribution network that spans rural, semi-urban, and urban areas, with more than 7,800 branches scattered across India. The bank also has a global presence through its representative offices in Bahrain, Hong Kong, UAE, and Kenya.
The following are some of the bank’s business segments:
(i) Retail Banking – which is targeted at individuals, salaries professionals, micro and small businesses, where some of the products and services provided include auto, personal, home loans, current and savings, as well as corporate salary accounts, fixed and recurring deposits, retail business banking, etc.;
(ii) Home Loan/Mortgages Business – where it offers a wide range of housing loans to cater to the varied needs of customers across income brackets – including individual borrowers, salaries persons, working professionals, and self-employed;
(iii) Wholesale/Corporate Banking – where the bank provides a wide range of commercial and transactional banking services (including working capital finance, trade services, transactional services, and cash management) for large corporates, PSUs, governments, and multinational corporations.
(iv) Commercial and Rural Banking – it was set up in FY2020/21 with the aim of providing working capital and term loans, project, export, tractor, and infrastructure finance, CASA, fixed, salary accounts to micro, small, and medium enterprises, emerging corporates, commercial agriculture, small and marginal farmers, healthcare finance, equipment finance, and commercial transport companies.
With a financial year end every March, the following is the HDFC Bank Ltd’s financial performance over the last 5 years – between 2018 (ended March 2019) and 2022 (ended March 2023):
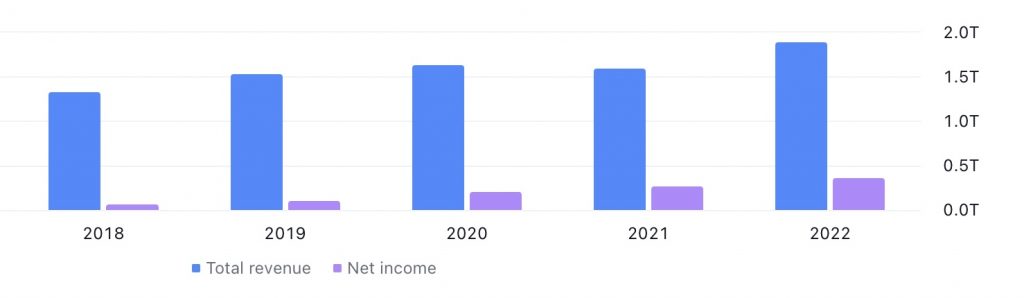
HDFC Bank Ltd’s Revenue & Net Income between 2018 (Ended March 2019) and 2022 (Ended March 2023) – Source: TradingView.com
The Indian bank’s total revenue and net income recorded y-o-y improvements every single year over the last 5 years – with the former growing from INR1.24 trillion in 2018 to INR2.05 trillion in 2022, a CAGR of 10.6%, and the latter climbing from INR223.32 billion in 2018 to 459.97 billion in 2022, a CAGR of 15.5%.
5. Tata Consultancy Services Ltd (NSE:TCS) (3.45% Weightage, Information Technology Sector)
Headquartered in Mumbai, Tata Consultancy Services Ltd is an Indian multinational information technology services and consulting company with operations in 150 locations across 46 countries. The company is part of the Tata Group.
Some of the services the company provides include consulting (where they help clients with strategy, transformation, and digital initiatives), cloud (including cloud migration, management, and security services, as well as the development of cloud native applications and platforms), enterprise solutions (such as ERP [Enterprise Resource Planning], CRM [Customer Relationship Management], and SCM [Supply Chain Management] solutions), Internet of Things (IoT) solutions (connecting of devices and sensors to collect and analyse data for operational improvement).
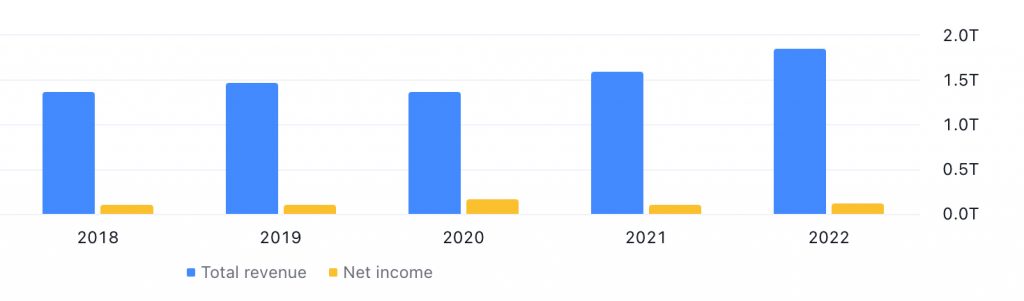
The following is Tata Consultancy Services Ltd’s financial performances recorded over the last 5 years – between 2018 (ended March 2019) and 2022 (ended March 2023). The company has a financial year end every March:
Tata Consultancy Services Ltd’s Revenue & Net Income between 2018 (Ended March 2019) and 2022 (Ended March 2023) – Source: TradingView.com
Total revenue grew every single year between 2018 (INR1.46 trillion) and 2022 (INR2.25 trillion), and recording a CAGR of 9.0%. The same can also be said for its net income in the same time period, where it grew from INR314.72 billion to INR421.47 billion, and recording a CAGR of 6.0%.
6. Axis Bank Ltd (NSE:AXISBANK) (2.56% Weightage, Financials Sector)
Formerly known as UTI Bank, Axis Bank Ltd is the 3rd largest private sector bank in India, where it provides an entire spectrum of financial services to customer segments covering large- and mid-corporates, micro small and medium enterprises (also known as MSME), as well as agriculture and retail businesses through its network of 5,100+ domestic branches (including extension counters), and 15,000+ ATMs and cash recyclers spread across the country.
From my understanding in an article published on Forbes India, Axis Bank Ltd is the 5th largest bank in the country (behind HDFC Bank, ICICI Bank, State Bank of India [SBI], and Kotak Mahindra).
The following is Axis Bank’s financial performance between 2018 (ended March 2019) and 2022 (ended March 2023) – the bank has a financial year ending every March:
Axis Bank Ltd’s Revenue & Net Income between 2018 (Ended March 2019) and 2022 (Ended March 2023) – Source: TradingView.com
Total revenue saw growths in 4 out of 5 years I have looked at (with the only year where its total revenue saw a y-o-y decline in 2020), where it grew from INR702.57 billion to INR1.06 trillion, and recording a CAGR of 8.6%.
Net income fell in 2 out of 5 years (in 2019 and 2022). However, it still managed to grow from INR50.39 billion in 2018 to INR108.18 billion in 2022, and recording a pretty good CAGR of 16.5%.
7. Bharti Airtel Ltd (NSE:BHARTIARTL) (2.37% Weightage, Communication Sector)
Headquartered in New Delhi, Bharti Airtel Ltd is a leading telecommunications companies globally. The company has a large spectrum of product offerings, including:
(i) Mobile Services – 2G, 3G, 4G services, with 5G services ready network across India;
(ii) Home Services – wireless service, mobile commerce, fixed line services, high-speed home broadband;
(iii) Digital TV Service – where the company is a key player in the industry offering both high and standard resolution TV services with 635 channels including 80 HD channels, 5 international channels, and 3 interactive services;
(iv) Airtel Business – where the company serves over 1,200 global enterprises, 2,000 large and 1 million medium/small businesses across India, offering a diverse portfolio of products and services such as data connectivity, voice and messaging, conferencing, cloud, data centre, security, internet of things, etc.
The following chart is Bharti Airtel Ltd’s financial performances over the last 5 years – between 2018 (ended March 2019) and 2022 (ended March 2022), the company has a financial year end every March:
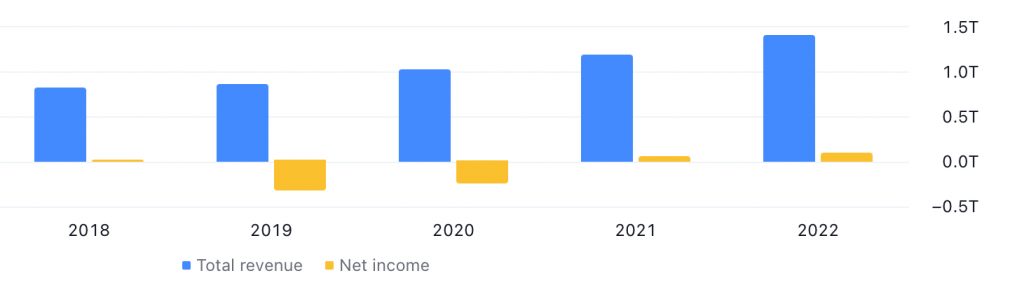
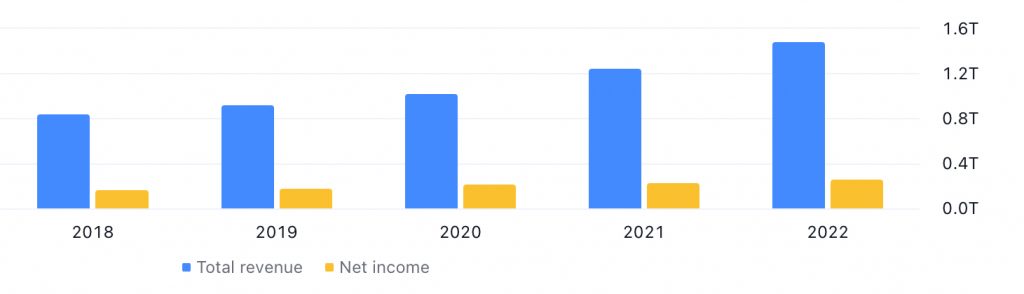
Bharti Airtel Ltd’s Revenue & Net Income between 2018 (Ended March 2019) and 2022 (Ended March 2023) – Source: TradingView.com
Total revenue growth over the last 5 years has been on a rise – from INR807.80 billion in 2018 to INR1.39 trillion in 2022, a CAGR of 11.5%.
However, its net income sank into a net loss in 2019 and 2020. Despite of that, over a 5-year period, it still managed to record a CAGR of 82.8%, as it has improved significantly since returning to a net income position once again in 2021.
8. Larsen and Tourbro Ltd (NSE:LT) (2.36% Weightage, Industrials Sector)
Oftentimes referred to as L&T, Larsen and Tourbro Ltd is an Indian multinational conglomerate engaged in EPC (Engineering, Procurement, and Construction) projects, hi-tech manufacturing and services, with operations in over 50 countries around the world.
The company operates across 4 core business segments:
(i) Construction – where they are one of the world’s top contractors undertaking large-scale infrastructure projects in the various domains such as buildings and factories, transportation infrastructure, renewable energy, power transmission and distribution, as well as water infrastructure;
(ii) Engineering & Construction – this segment encompasses a broad range of services, including design, procurement, construction, and commissioning of complex projects across diverse industries like hydrocarbons, metals & minerals, chemicals & petrochemicals, and nuclear power;
(iii) Manufacturing – the company manufactures a wide array of equipment and machinery, including hydraulic cylinders, valves, construction & mining equipment, rubber processing machinery, and shipbuilding;
(iv) Services – where the company offers a diverse portfolio of services through its subsidiaries, including information technology solutions, infrastructure development & investment management, real estate development, and financial services.
Over the last 5 years (between 2018 [ended March 2019] and 2022 [ended March 2023] – the company has a financial year ending every March), Larsen & Toubro Ltd’s financial performance is as follows:
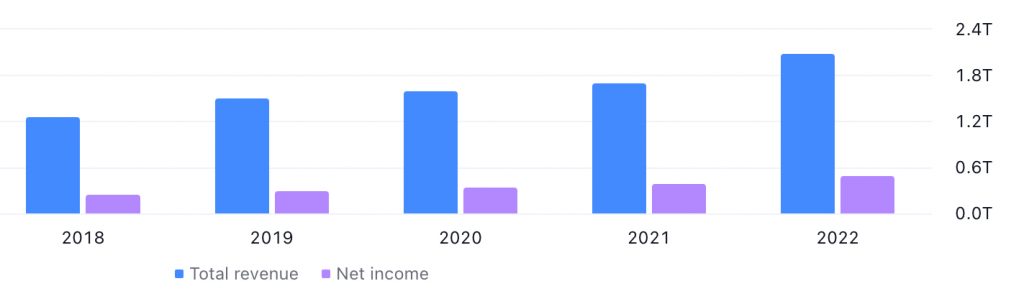
Larsen and Tourbro Ltd’s Revenue & Net Income between 2018 (Ended March 2019) and 2022 (Ended March 2023) – Source: TradingView.com
Total revenue saw y-o-y gains in 4 out of 5 years (where the only year which it saw a y-o-y decline was in 2022, by 6.8%), and recording a CAGR of 6.4%.
Its net income also saw a decline in just 1 year (by about 43% in 2021), while recording y-o-y growth in the remaining years (where it climbed from INR89.05 billion in 2018 to INR104.71 billion in 2022) – recording a CAGR of 3.3%.
9. Hindustan Unilever Ltd (NSE:HINDUNILVR) (2.19% Weightage, Consumer Staples Sector)
As the name suggests, Hindustan Unilever Ltd is a subsidiary of British company Unilever.
Hindustan Unilever Ltd is India’s largest Fast Moving Consumer Goods (FMCG) company, where 9 out of 10 Indian households use one or more of the company’s products – where it has a wide and resilient portfolio of 50+ brands, spanning 16 FMCG categories (from food to home and personal care).
With a financial year end every March, the following is Hindustan Unilever Ltd’s financial performance over the last 5 years – between 2018 (ended March 2019) and 2022 (ended March 2022):
Hindustan Unilever Ltd’s Revenue & Net Income between 2018 (Ended March 2019) and 2022 (Ended March 2023) – Source: TradingView.com
Both its total revenue and net income saw y-o-y gains every single year over the last 5 years – with the former growing from INR391.37 billion in 2018 to INR604.01 billion in 2022, and recording a CAGR of 9.1%, and the latter climbing from INR60.54 billion in 2018 to INR101.20 billion in 2022, and recording a CAGR of 10.8%.
10. Kotak Mahindra Bank Ltd (NSE:KOTAKBANK) (2.08% Weightage, Financials Sector)
Finally we have Kotak Mahindra Bank Ltd – as mentioned earlier, the Indian bank is the 4th largest in the country (according to an article by Forbes India).
Established in 1985, and headquartered in Mumbai, it provides a wide range of financial solutions, covering banking (consumer, commercial, and corporate), credit and financing, asset management, alternate assets, life and general insurance, stock broking, investment banking, private banking, Microfinance and asset reconstruction across customer and geographic segments within India – where it has a network of over 4,400 branches across the countries.
On top of that, it also have international offices in New York, London, Mauritius, Dubai, Singapore, and Abu Dhabi.
The following is Kotak Mahindra Bank Ltd’s financial performances recorded between 2018 (ended March 2019) and 2022 (ended March 2023) – it has a financial year end every March:

Kotak Mahindra Bank Ltd’s Revenue & Net Income between 2018 (Ended March 2019) and 2022 (Ended March 2023) – Source: TradingView.com
Both the bank’s total revenue and net income saw y-o-y growth every single year throughout the entire 5-year period I have looked at – its total revenue grew from INR456.21 billion in 2018 to INR695.39 billion in 2022, a CAGR of 8.8%; its net income climbed from INR72.04 billion in 2018 to INR149.25 billion in 2022, a CAGR of 15.7%
What is the Expense Ratio of the iShares MSCI India ETF?
It is currently at 0.65% – which is the management fee – it is slightly higher than the average of between 0.50-0.60%.
Will I Receive Any Dividend as an Investor of the ETF?
As an investor of the iShares MSCI India ETF, you will receive a dividend twice every year (once in June and once in December).
The following table is the ETF’s dividend payouts over the last 5 years:
| 2019 | 2020 | 2021 | 2022 | 2023 | |
| Dividend Per Share (US$) | $0.23 | $0.03 | $3.37 | $1.59 | $0.19 |
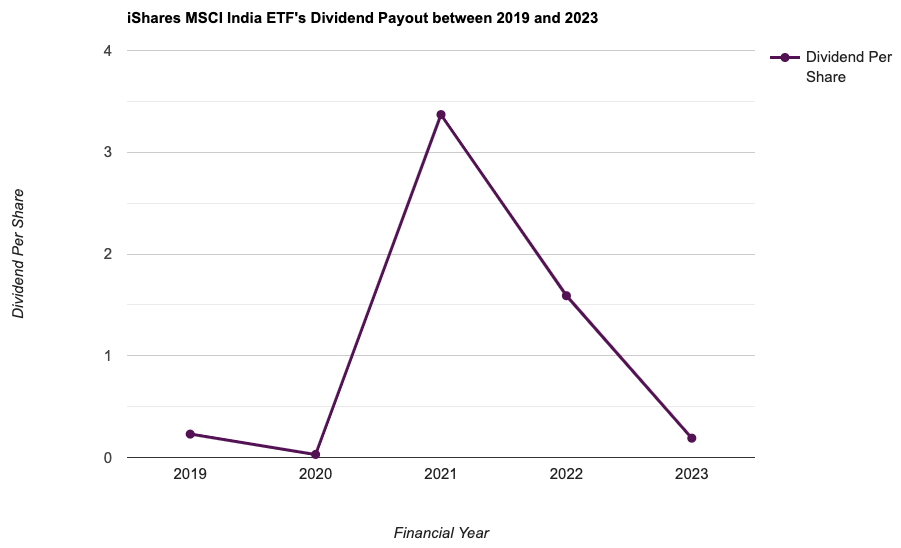
Looking at the dividend payout of the ETF over the last 5 years, it is quite inconsistent – so its something for those of you who are intending to invest in the ETF for dividends to take note of.
Another thing to note if you are a Singaporean investing in the ETF is that, all dividends declared are subjected to a 30% withholding tax – as such, the payout you receive will be 30% lesser than the amount declared.
How has the Unit Price of the ETF Moved over the Years?
The following is the iShares MSCI India ETF’s unit price movement on a weekly timeframe:

As you can see from the above, between December 2020 till date, it has been moving in a range of between US$39 and US$51 (approximately).
Looking at the current price of the ETF, it is at the high-end of the range. Personally, I will wait till the price comes down to around the US$40 region prior to investing in it.
How Can I Invest in the iShares MSCI India ETF?
You can invest in the iShares MSCI India ETF (ticker symbol NYSE ARCA:INDA) the same way you invest in any companies listed on the US exchange.
Closing Thoughts
For those who like to tap into the growth of the Indian economy in the years ahead, in my personal opinion, the iShares MSCI India ETF (NYSE ARCA:INDA) is one you can consider – for with this one single investment, you can get invested into over 130 of the most liquid large and mid-cap companies listed on the Indian stock market (which we are not able to invest in, unless you are an Indian citizen).
The ETF, in my opinion, is quite well diversified into the various sectors. In terms of weightage, no company has a weightage of more than 8.03%. Company performance-wise, as you can see from the section above, the 10 companies with the heaviest weightage in the ETF have a stable performance, where both total revenue and net income have recorded a good CAGR over the last 5 years I have looked at.
On the other hand, its dividend payout has fluctuated over the years. Personally, I am not too bothered, because my focus is on potential capital gains (and speaking of which, I will not want to invest in the ETF now, where its unit price is at a high; I will wait for it to come down to around the US$40 price point prior to investing in it). Another thing to note is that the management fee, currently at 0.65%, is slightly higher than the average management fee of ETFs (which is between the 0.50% and 0.60% range).
With that, I have come to the end of my share on the iShares MSCI India ETF. I sincerely hope you have found the contents presented in this post useful, and that after going through this long post, you now have a good understanding about the ETF. Finally, do take note that the contents above are purely for educational purposes only, and not any recommendations to buy or sell the ETF. You are strongly encouraged to do your own due diligence before you make any investment decisions.
Disclaimer: At the time of writing, I am not invested in the iShares MSCI India ETF.
REITs vs Banks: Which Investment Delivers More for Income Seekers?

If you thought 2025 was a wild ride for the stock market, wait until you see 2026! With not only the uncertainty of interest rate changes and geopolitical tensions but also a military operation by Israel and the United States against Iran, it's set to be even more turbulent.
So, with all this in mind, which is the better choice for income investors: REITs or banks?
I'm honoured to be re-invited by Dinah Poehlmann from Your Finance Mind for a fireside chat on Zoom this year, where I'll be sharing my insights on this topic.
Join me on Thursday, 19 March 2026, from 8pm to 9pm, as I offer my thoughts and answer any questions you may have.
Best part? Registration is completely free! Secure your spot now through the link below:
👉 Sign Up Now and Mark Your Calendars
Are You Worried about Not Having Enough Money for Retirement?
You're not alone. According to the OCBC Financial Wellness Index, only 62% of people in their 20s and 56% of people in their 30s are confident that they will have enough money to retire.
But there is still time to take action. One way to ensure that you have a comfortable retirement is to invest in real estate investment trusts (REITs).
In 'Building Your REIT-irement Portfolio' which I've authored, you will learn everything you need to know to build a successful REIT investment portfolio, including a list of 9 things to look at to determine whether a REIT is worthy of your investment, 1 simple method to help you maximise your returns from your REIT investment, 4 signs of 'red flags' to look out for and what you can do as a shareholder, and more!

You can find out more about the book, and grab your copy (ebook or physical book) here...


Comments (0)