What immediately comes to mind when I talk about the US-listed company Abbott Laboratories (NYSE:ABT)?
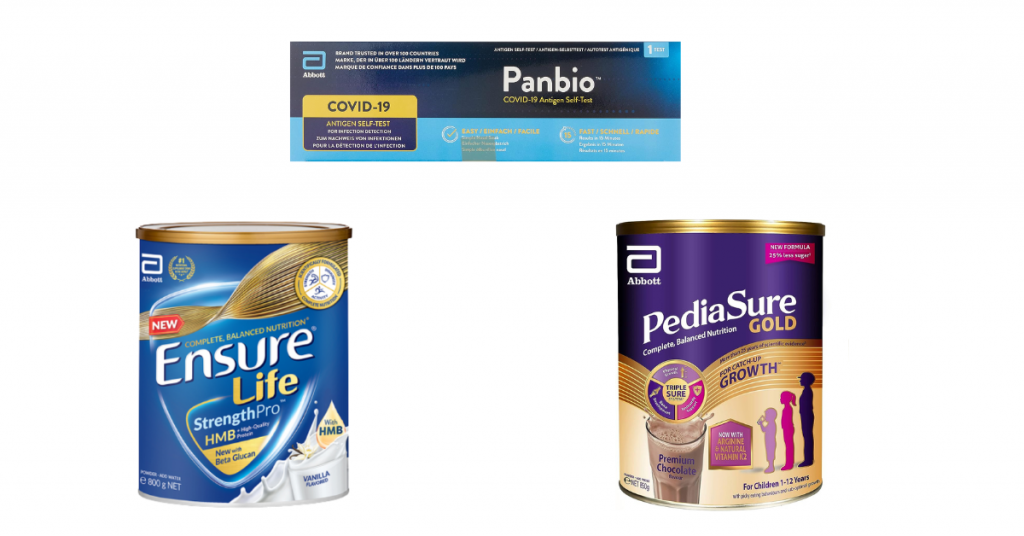
Some of the commonly found products by the company include the Panbio ART kit (still remember how these ART kits used to be selling like hot cakes back in 2020 and 2021 when the Covid-19 pandemic was at their peak?) Another one is the Ensure (for adults) and Pediasure (for kids) milk powders which you can easily find on the shelves of the major supermarkets here in Singapore:
However, the company retails more than the few consumer products listed above. Revenue of the NYSE-listed company is generated from the following 4 business segments:
(i) Nutritional Products
Principal products include (i) various forms of infant formula and follow-on formula, including Similac, Gain, and Grow; (ii) adult and other paediatric nutritional products, including Ensure, Glucerna, Pressure, PediaSure; (iii) nutritional products used in enteral feeding in health care institutions.
These products are generally marketed and sold directly to consumers and to institutions, wholesalers, retailers, health care facilities, government agencies, and third-party distributors from Abbott-owned distribution centres or third-party distributors.
This business segment contributed approximately 17% towards the company’s total revenue in the latest financial year ended 31 December 2022.
(ii) Diagnostic Products
Range of products that Abbott Laboratories have for sale in this business segment include: (i) core laboratory and transfusion medicine systems in the areas of immunoassay, clinical chemistry, nematology, and transfusion serology testing; (ii) molecular diagnostics PCR instrument systems; (iii) point of care systems for testing blood gas, chemistry, electrolytes, coagulation and immunoassay; (iv) rapid diagnostics lateral flow testing products in the area of infectious diseases such as SARS-CoV-2 (Panbio rapid testing platform), influenza, HIV, hepatitis, and tropical diseases such as malaria and dengue fever; (iv) informatics and automation solutions for use in laboratories.
These products are generally marketed and sold directly to blood banks, hospitals, commercial laboratories, clinics, physicians’ offices, retailers, government agencies, alternate care testing sites, and plasma protein therapeutic companies from Abbott owned distribution centres, public warehouses or third party distributors.
This business segment contributed approximately 38% towards the company’s total revenue in the latest financial year ended 31 December 2022.
(iii) Established Pharmaceutical Products
Some of the main products that the company has under this business segment include: (i) gastroenterology products; (ii) women’s health products; (iii) cardiovascular and metabolic products; (iv) pain and central nervous system products; (v) respiratory drug and vaccines.
These products are generally sold directly to wholesalers, distributors, government agencies, health care facilities, pharmacies, and independent retailers from Abbott-owned distribution centres or public warehouses, depending on the market served.
This business segment contributed approximately 11% towards the company’s total revenue in the latest financial year ended 31 December 2022.
(iv) Medical Devices
Finally, under ‘Medical Devices’, products include a broad line of rhythm management, electrophysiology, heart failure, vascular and structural heart devices for the treatment of cardiovascular diseases, and diabetes care products for people with diabetes, as well as neuromodulation devices for the management of chronic pain and movement disorders.
This business segment contributed approximately 34% towards the company’s total revenue in the latest financial year ended 31 December 2022.
In the rest of this article, you will find a review of Abbott Laboratories in terms of its financial performances, capital management, and dividend payout over the last 5 years (between FY2018 and FY2022), as well as whether or not its current traded price is at a ‘discount’ or at a ‘premium’ based on its current valuations compared against its 5-year average.
Let’s begin:
Financial Performance
In this section, I will be taking a look at some of the key financial figures, including revenue generated from each of the 4 business segments, total revenue and net profit, gross and net profit margin, as well as return on equity recorded over the last 5 years:
Individual Business Segment Performance:
| FY2018 | FY2019 | FY2020 | FY2021 | FY2022 | |
| Nutritional Products (US$’mil) | $7,230m | $7,410m | $7,650m | $8,290m | $7,460m |
| Diagnostic Products (US$’mil) | $7,500m | $7,710m | $10,800m | $15,640m | $16,580m |
| Established Pharmaceutical Products (US$’mil) | $4,420m | $4,490m | $4,300m | $4,720m | $4,910m |
| Medical Devices (US$’mil) | $11,370m | $12,240m | $11,790m | $14,370m | $14,690m |
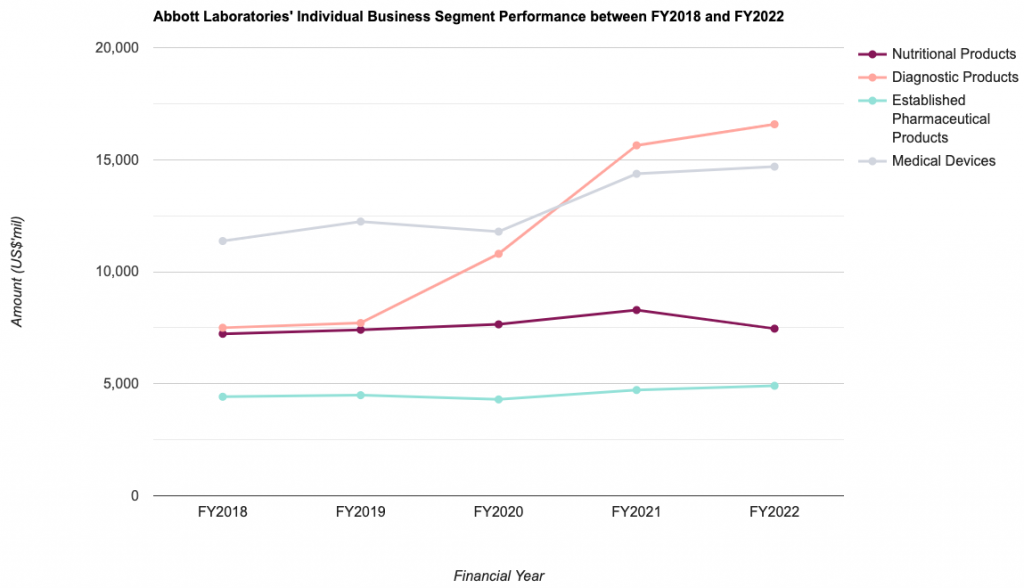
My Observations: Nutritional Products saw year-on-year (y-o-y) growth in 4 out of 5 years, with the latest financial year (in FY2022) the only year the business segment declined, due to a drop in Pediatric Nutrition sales as a result of manufacturing disruptions during 2022 of certain infant formula products at Abbott’s Sturgis, Michigan, facility. Howeever, production has since restarted. Over a 5-year period, this business segment saw a compound annual growth rate (CAGR) of 0.6%.
Diagnostic Products saw its revenue improve every single year over the past 5 years, and growing at a CAGR of 17.2%.
Established Pharmaceutical Products recorded y-o-y improvements in its revenue in the last 4 out of 5 years, with the only year which revenue declined was in FY2020. Over the last 5 years, this business segment grew at a CAGR of 2.1%.
Finally, for its Medical Devices business segment, revenue also fell in just 1 out of the 5 years (in FY2020, as a result of declines in Abbott’s cardiovascular and nueomodulation businesses due to the impact of Covid-19, along with lower vascular sales in China in Q4 2020 due to a new national tender program). The business segment saw a CAGR of 5.3%.
From the above, you can see that in terms of growth, Diagnostic Products recorded the strongest growth as far as CAGR is concerned, at 17.2%, followed by Medical Devices, at 5.3%, while the other business segments saw a stable upward climb in its revenue in the same time period.
Total Revenue & Net Profit:
| FY2018 | FY2019 | FY2020 | FY2021 | FY2022 | |
| Total Revenue (US$’mil) | $30,580m | $31,900m | $34,610m | $43,080m | $43,650m |
| Net Profit (US$’mil) | $2,350m | $3,670m | $4,470m | $7,040m | $6,910m |
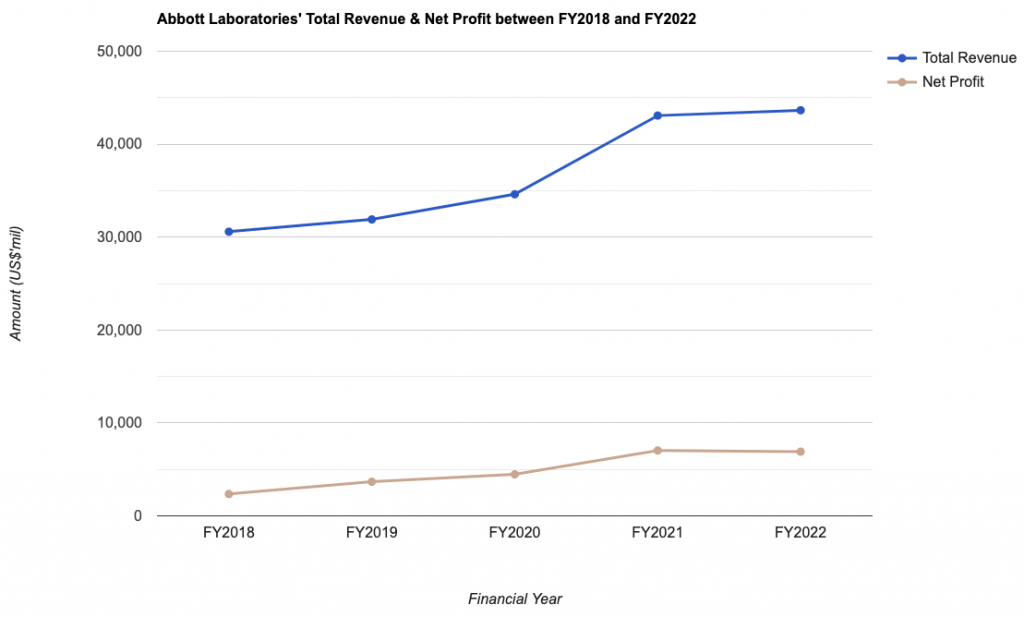
My Observations: Abbott Laboratories’ total revenue and net profit grew at a stable pace over the last 5 years – with the former recording a CAGR of 7.4%, and the latter recording a CAGR of 24.1% (this is despite a slight 9% dip in FY2022.)
Gross & Net Profit Margins:
| FY2018 | FY2019 | FY2020 | FY2021 | FY2022 | |
| Gross Profit Margin (%) | 51.73% | 52.32% | 50.22% | 53.88% | 51.13% |
| Net Profit Margin (%) | 7.68% | 11.50% | 12.92% | 16.34% | 15.83% |
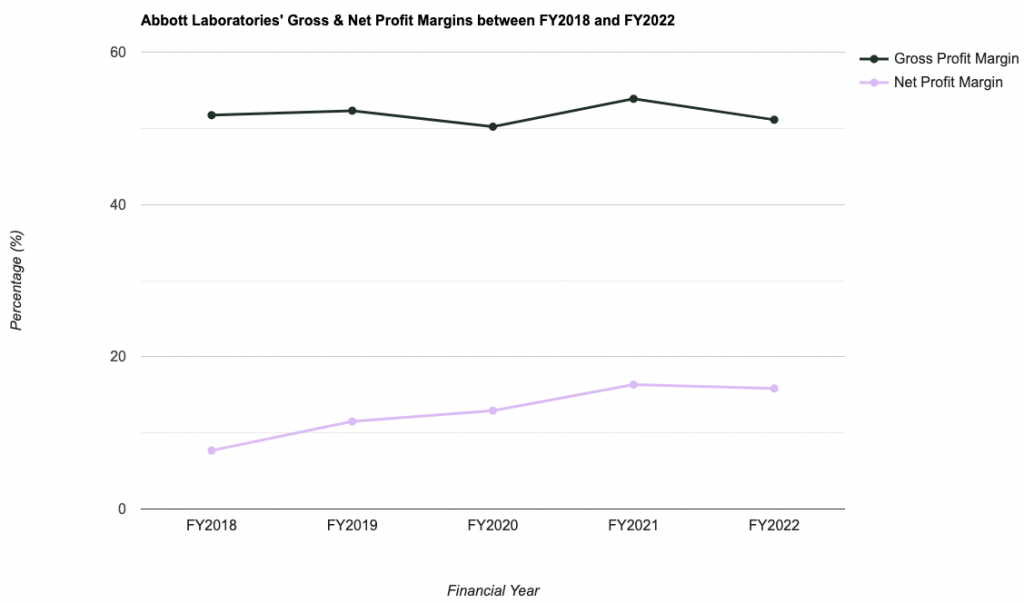
My Observations: Gross profit margin remained stable at around the 50% range over the last 5 years, while net profit margin saw a stable climb every single year between FY2018 and FY2021, before dipping by 0.51 percentage points to 15.83% in FY2022 (due to a 2% decline in its net profit).
Return on Equity:
In layman terms, Return on Equity (or RoE for short) is a computation of profits generated by the company (in percentage terms) for every single dollar it uses in its businesses. Personally, I prefer companies that are able to record an RoE of above 15.0% over the years.
Did Abbott Laboratories’ RoE fulfil this requirement of mine? Let us have a look at it in the table and chart below:
| FY2018 | FY2019 | FY2020 | FY2021 | FY2022 | |
| Return on Equity (%) | 7.55% | 11.90% | 13.93% | 20.53% | 19.05% |

My Observations: The NYSE-listed company’s RoE recorded a steady climb from 7.55% in FY2018 to a high of 20.53% in FY2021, before declining slightly to 19.05% in FY2022.
While its RoE was at 15.0% in the most recent 2 years, but it still passes my selection requirement as the company improved on this financial metric over the years.
Capital Management
Moving on, let us take a look at how the management of Abbott Laboratories manages the company’s capital – particularly, my focus is on whether or not the company is in a net cash or net debt position, and you can find them in the table and chart below:
| FY2018 | FY2019 | FY2020 | FY2021 | FY2022 | |
| Net Cash/ Debt (US$’mil) | -$15,480m | -$14,960m | -$12,740m | -$9,000m | -$7,780m |
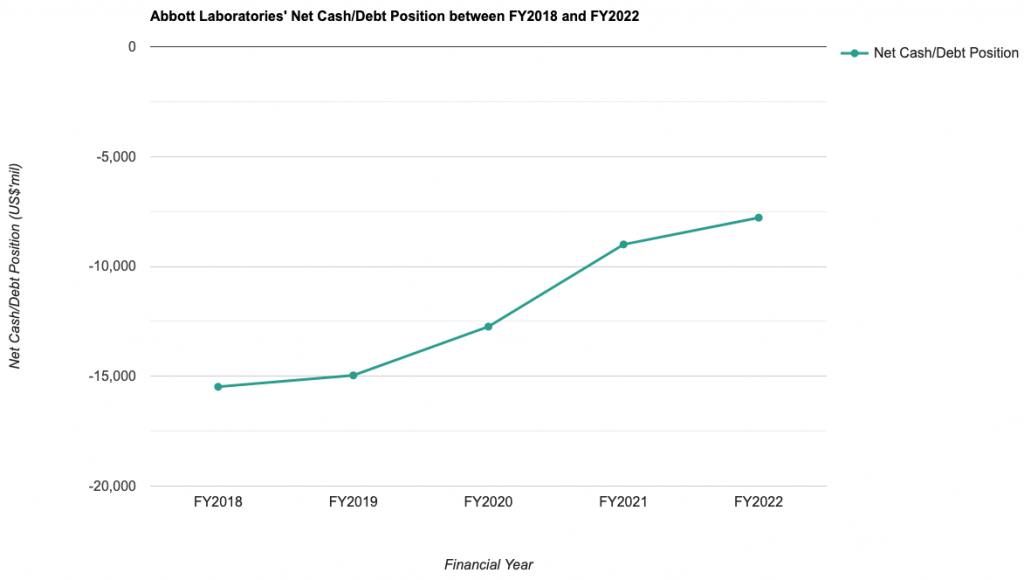
My Observations: While Abbott Laboratories is in a net debt position throughout the entire 5 year period I have looked at (a negative), but it has improved over the years (a positive).
Dividend Payout to Shareholders
The management of Abbott Laboratories declares a dividend payout to its shareholders on a quarterly basis. However, do take note if you are a Singaporean investor investing in the US market, as all dividend payouts are subjected to a 30.0% withholding tax (meaning to say the amount you eventually receive will be 30.0% less than what is declared.)
That said, let us take a look at the NYSE-listed company’s dividend payout over the last 5 years:
| FY2018 | FY2019 | FY2020 | FY2021 | FY2022 | |
| Dividend Per Share (US$) | $1.16 | $1.32 | $1.53 | $1.82 | $1.92 |
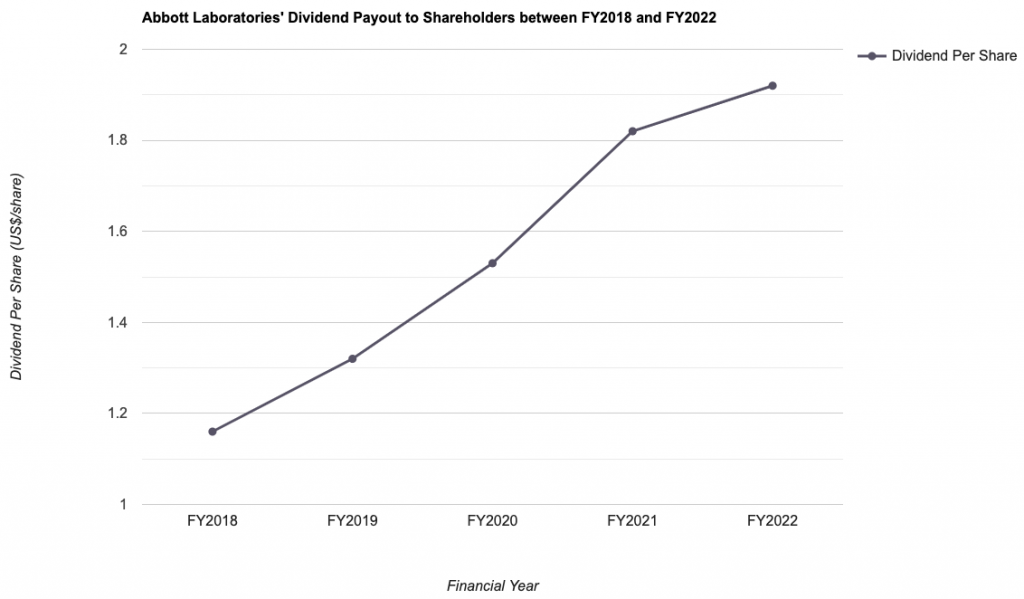
My Observations: Abbott Laboratories’ dividend payout over the last 5 years saw a CAGR of 10.6%, which is pretty decent in my opinion.
Another thing to note is that, apart from in FY2022, where its dividend payout improved by just 5% compared to last year, the remaining years saw its dividend payout improved at 10+% compared to the year before.
Is the Current Traded Price of Abbott Laboratories Trading at a ‘Discount’ or ‘Premium’?
Based on its share price of $100.73 at close last Friday (08 September 2023), its current valuations vs. its 5-year average (I looked at its price-to-sales ratio, price-to-book ratio, and dividend yield) is as follows:
| Current | 5-Year Average | |
| P/S Ratio | 4.02 | 5.00 |
| P/B Ratio | 4.77 | 5.43 |
| Dividend Yield | 1.91% | 1.51% |
My Observations: Looking at the above, Abbott Laboratories is trading at a ‘discount’ to its 5-year average. In fact, based on my computation of the company’s fair value based on its 5-year average valuation, it is at $125.33. Hence, Abbott Laboratories is currently trading at a 19.6% discount.
Closing Thoughts
There are a number of aspects about Abbott Laboratories’ performances over the last 5 years that I find desirable – including the stable growth of all 4 of its business segments, its total revenue and net profit, its return on equity as well as its dividend payout.
Gross profit margin have been maintained at a good level of 50+% over the years, and its net profit margin recording a steady climb in 4 out of 5 years (the only year which the company’s net profit margin suffered a decline was in FY2022).
On its capital management, while it is in a net debt position in the last 5 years, but it have improved every single year – which is a positive development in my opinion.
Finally, based on its current traded price (as at market close on 08 September 2023), Abbott Laboratories (at $100.73) is trading at a 19.6% discount to its fair value of $125.33.
With that, I have come to the end of my review of the NYSE-listed company’s performances over the last 5 years. I hope the contents presented above have given you a good understanding of the company. That said, do take note that this post is by no means a buy or sell recommendation for the company’s shares. You should always do your own due diligence before you make any investment decisions.
Disclaimer: At the time of writing, I am not a shareholder of Abbott Laboratories.
Are You Worried about Not Having Enough Money for Retirement?
You're not alone. According to the OCBC Financial Wellness Index, only 62% of people in their 20s and 56% of people in their 30s are confident that they will have enough money to retire.
But there is still time to take action. One way to ensure that you have a comfortable retirement is to invest in real estate investment trusts (REITs).
In 'Building Your REIT-irement Portfolio' which I've authored, you will learn everything you need to know to build a successful REIT investment portfolio, including a list of 9 things to look at to determine whether a REIT is worthy of your investment, 1 simple method to help you maximise your returns from your REIT investment, 4 signs of 'red flags' to look out for and what you can do as a shareholder, and more!

You can find out more about the book, and grab your copy (ebook or physical book) here...


Comments (0)