No surprises there that the first thing that comes to mind when I mention about the NYSE-listed company is their namesake beverage, Coca-Cola:
Another thing will be that the company is one of Warren Buffett’s biggest holdings, where, as at the end of September 2022, Berkshire Hathaway owned a 9.2% stake worth more than US$22 billion in the company (source here.)
That said, is The Coca Company Company (NYSE:KO) a ‘straight buy’? Personally, I will not jump into investing in any company just because someone is invested in it. Rather, I will first seek to learn more about it (in terms of its business operations, along with its financial performances, debt profile, and dividend payout over the years) before making any investment decisions – all of which you’ll be reading about in this post.
Let’s begin:
The Coca-Cola Company’s Business Operations
Starting off with the United States in 1886, The Coca-Cola Company’s beverages are now sold in more than 200 countries and territories.
It owns and markets numerous beverage brands (many of them you probably have heard before), including:
(i) Sparkling Soft Drinks – Coca-Cola, Diet Coke/Coca-Cola Light, Coca-Cola Zero Sugar, Fanta, Fresca, Schweppes, Sprite and Thums Up;
(ii) Water, Sports, Coffee & Tea: Aquarius, Ayataka, BODYARMOR, Ciel, Costa, Dasani, doğadan, FUZE TEA, Georgia, glacéau smartwater, glacéau vitaminwater, Gold Peak, Ice Dew, I LOHAS, Powerade and Topo Chico;
(iii) Juice, Value-Added Dairy & Plant-Based Beverages: AdeS, Del Valle, fairlife, innocent, Minute Maid, Minute Maid Pulpy and Simply.
One of the things to note is that the company has a very defensive business model in that, regardless of whether times are good or bad, people will still consume beverages by the company – in fact, beverages bearing trademarks owned by or licensed to the company account for 2.2 billion of the estimated 64 billion servings of all beverages consumed worldwide every day.
Financial Performances
In this section on the beverage company’s financial performances, you will learn about its total revenue and net profit, gross and net profit margins, as well as return on equity over the last 8 years (between FY2015 and FY2022 – the company has a financial year end every 31 December.)
Total Revenue & Net Profit (US$’mil):
| FY2015 | FY2016 | FY2017 | FY2018 | |
| Total Revenue (US$’mil) | $44,294m | $41,863m | $36,212m | $34,300m |
| Net Profit (US$’mil) | $7,351m | $6,527m | $1,248m | $6,434m |
| FY2019 | FY2020 | FY2021 | FY2022 | |
| Total Revenue (US$’mil) | $37,266m | $33,014m | $38,655m | $43,004m |
| Net Profit (US$’mil) | $8,920m | $7,747m | $9,771m | $9,542m |

My Observations: The company’s top- and bottom-lines fell in 4 out of 10 years, due to the following reasons:
FY2016: Due to a foreign currency headwind of 3%, and headwind from acquisitions, divestitures, and structural items of 6%;
FY2017: Due to headwinds of 17% from the ongoing refranchising of bottling territories;
FY2018: Due to a 17% decline from the combined impact of currency and the refranchising of company-owned bottling operations;
FY2020: Due to a 7% decline in concentrate sales and a 2% decline in price/mix.
In terms of the compound annual growth rate (CAGR) of its revenue over a 8-year period, it is in negative figures, as its revenue for FY2022 is lower than that recorded in FY2015. However, for its net profit, it has managed to grow at 3.3% in the same time period – which is considered stable in my opinion.
Gross & Net Profit Margins (%):
| FY2015 | FY2016 | FY2017 | FY2018 | |
| Gross Profit Margin (%) | 60.5% | 60.7% | 62.1% | 61.9% |
| Net Profit Margin (%) | 16.6% | 15.6% | 3.4% | 18.8% |
| FY2019 | FY2020 | FY2021 | FY2022 | |
| Gross Profit Margin (%) | 60.8% | 59.3% | 60.3% | 58.1% |
| Net Profit Margin (%) | 23.9% | 23.5% | 25.3% | 22.2% |
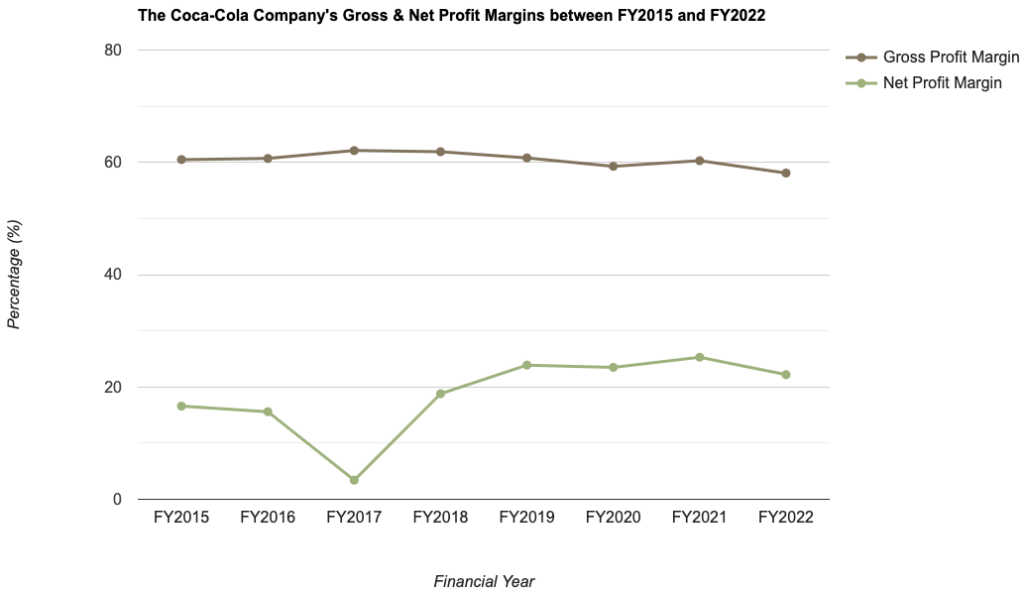
My Observations: Gross profit margin largely remained stable at around the 58% to 62% region over the last 8 years – meaning to say the company has managed to control its cost well.
For its net profit margin, after falling to a low of just 3.4% in FY2017 (due to a one-time charge of $3.6 billion recorded in the 4th quarter of FY2017 as a result of the company refranchising its bottling operations, currency headwinds, along with softer sales in some of the key markets such as China and Brazil), it has gradually recovered, and between the last few financial years (FY2019 and FY2022), it has been hoovering at around the 20+% mark.
Return on Equity (%):
In layman terms, Return on Equity, or RoE for short, is a computation of the amount of profits (expressed in percentage terms), the company is able to generate for every dollar of shareholders’ money it uses in its business.
The following table is The Coca-Cola Company’s RoE which I’ve computed:
| FY2015 | FY2016 | FY2017 | FY2018 | |
| Return on Equity (%) | 28.8% | 28.3% | 7.3% | 37.9% |
| FY2019 | FY2020 | FY2021 | FY2022 | |
| Return on Equity (%) | 47.0% | 40.1% | 42.5% | 39.6% |
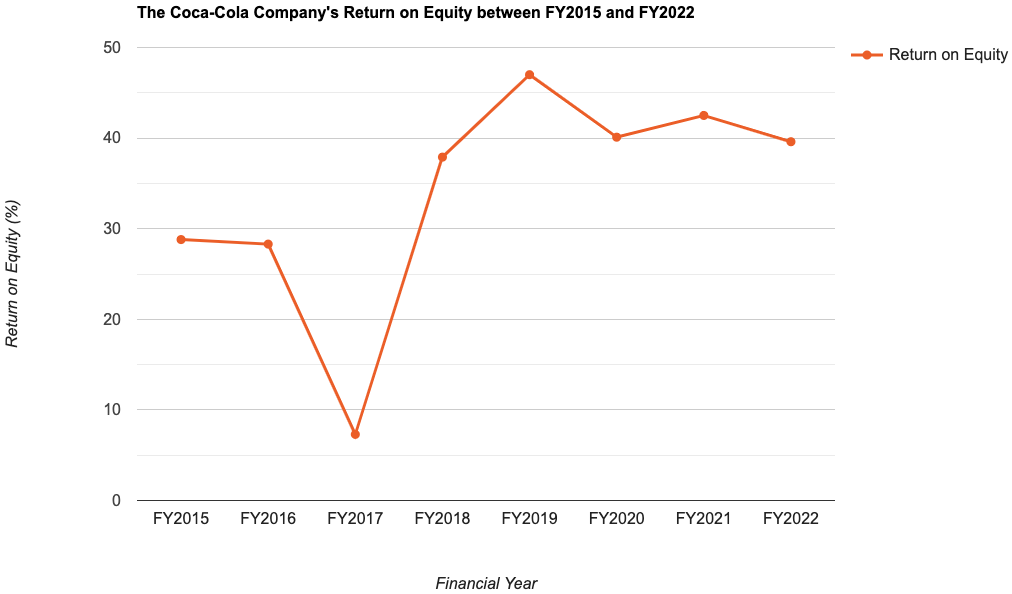
My Observations: When it comes to evaluating a company’s RoE, my preference is towards those that are able to maintain it at above 15.0% over the years.
Looking at the beverage company’s RoE over the last 8 years, it has maintained this financial ratio at above this level in all but 1 year (in FY2017, where the net profit plunged by 80.9%.)
However, over the years, the growth of its RoE have fluctuated.
Debt Profile
Apart from its financial performance, another area I will focus my attention on is its debt profile – especially in times like this, where interest rates are at a high level, I will pay extra attention to make sure a company does not take on too much debt.
That said, is The Coca-Cola Company’s debt profile over the last 8 years a healthy one? Let us take a look at it in the table below:
| FY2015 | FY2016 | FY2017 | FY2018 | |
| Cash & Cash Equivalents (US$’mil) | $7,309m | $8,555m | $6,102m | $9,077m |
| Total Borrowings (US$’mil) | $30,987m | $33,211m | $34,480m | $30,379m |
| Net Cash/ Debt (US$’mil) | -$23,678m | -$24,656m | -$28,378m | -$21,302m |
| FY2019 | FY2020 | FY2021 | FY2022 | |
| Cash & Cash Equivalents (US$’mil) | $6,480m | $6,795m | $9,684m | $9,519m |
| Total Borrowings (US$’mil) | $31,769m | $40,610m | $39,453m | $36,776m |
| Net Cash/ Debt (US$’mil) | -$25,289m | -$33,815m | -$29,769m | -$27,257m |

My Observations: While the company has remained in at net debt position throughout the entire 8-year period, but in recent years, it has improved (from a net debt position of -$33,815m in FY2020 to -$27,257m in FY2022.)
Another thing to note is that, its current ratio have been maintained at above 1.0 (meaning the company does not have any problem in meeting its short-term debt obligations if it is required to) in 6 out of 8 years.
Dividend Payouts
The management of The Coca-Cola Company pays out a dividend to their shareholders on a quarterly basis (do take note that if you are a Singapore investing in a US-listed company, all dividend payouts are subject to a 30.0% withholding tax – meaning the amount you receive will be 30.0% less than the amount declared), and the following table is its dividend payout over the last 8 years (between FY2015 and FY2022):
| FY2015 | FY2016 | FY2017 | FY2018 | |
| Dividend Per Share (US$/share) | $1.34 | $1.42 | $1.50 | $1.57 |
| FY2019 | FY2020 | FY2021 | FY2022 | |
| Dividend Per Share (US$/share) | $1.61 | $1.65 | $1.70 | $1.78 |
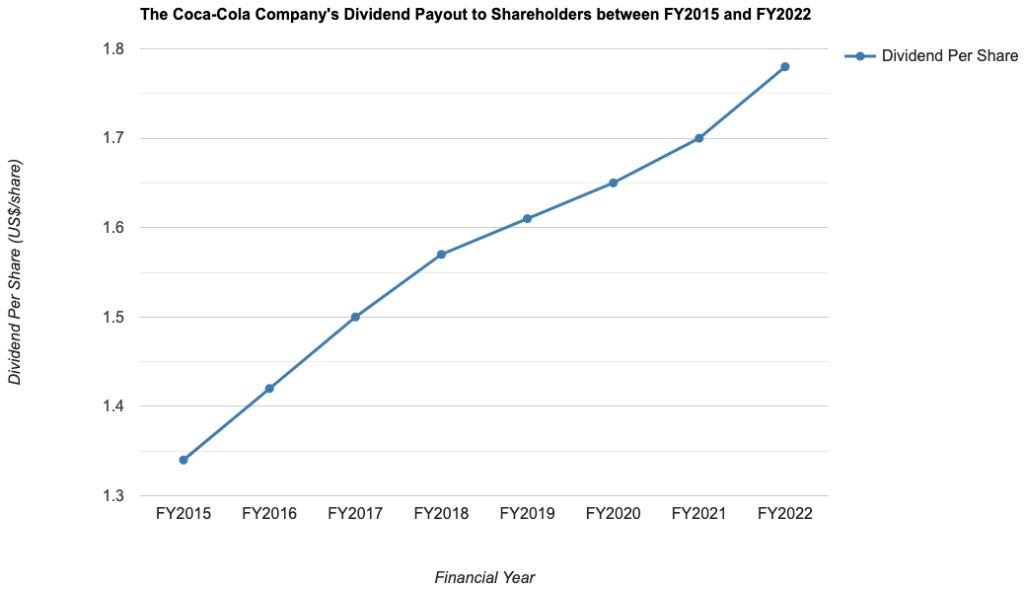
My Observations: Despite the company’s net profits declined in 3 years (in FY2016, FY2017, and FY2020), but its dividend payout have been on a steady upward moving trend every single year, and growing at a CAGR of 3.6% over a 8-year period (which is pretty much in-line with the CAGR of its net profit in the same time period.)
Highlights of The Coca-Cola Company’s Q1 FY2023 Results
The following are some of the key figures from The Coca-Cola Company’s Q1 FY2023 results (released on 24 April 2023) to take note of:
| Q1 FY2022 | Q1 FY2023 | % Variance | |
| Total Revenue (US$’mil) | $10,491m | $10,980m | +4.7% |
| Net Profit (US$’mil) | $2,781m | $3,107m | +11.7% |
| Gross Profit Margin (%) | 61.0% | 60.7% | -0.3pp |
| Net Profit Margin (%) | 26.5% | 28.3% | +1.8pp |
| Cash & Cash Equivalents (US$’mil) | $7,681m | $12,004m | +56.3% |
| Total Borrowings (US$’mil) | $38,091m | $36,945m | -3.0% |
| Net Cash/ Debt (US$’mil) | -$30,410m | -$24,941m | N.M. |
| Dividend Per Share (US$/share) | $0.44 | $0.46 | +4.5% |
My Observations: The latest quarter results (compared to the same time period last year – i.e. Q1 FY2022) is a positive one for the company – with growth in its top- and bottom-line attributed to a 11% growth in price/mix and a 1% growth in concentrate sales. Also, its dividend payout for the quarter have continued to climb (by another 4.5% to $0.46 in Q1 FY2023.)
In terms of its debt, a huge improvement in its cash & cash equivalent, along with a drop in total borrowings, saw its net debt position further improve to -$24,941m.
The only slight negative is the 0.3pp dip in its gross profit margin (but despite of that, it has been maintained at the range of 58% and 62% seen over the last 8-years, so personally, I’m not concerned.)
Is the Current Traded Price of The Coca-Cola Company Considered ‘Cheap’ or ‘Expensive’?
The following table is a comparison of the beverage company’s current valuations (based on its last traded price of US$60.31 as at market close on 06 June 2023), and its 8-year average valuations:
| Current | 8-Year Average | |
| P/E Ratio | 24.3 | 44.5 |
| P/B Ratio | 9.7 | 17.5 |
| Dividend Yield | 3.0%^^ | 3.1% |
Looking at the current vs. its 8-year average valuations, at US$60.31, The Coca-Cola Company is considered ‘cheap’ due to its current P/E and P/B ratios being lower than average.
Closing Thoughts
To recap, some of the positives to note include the defensive nature of its business (in that, regardless of the economic climate, the demand of its beverage products remain unaffected), a stable gross profit margin over the years (implying the company is able to maintain its cost), along with a growing dividend payout (where it has saw year-on-year improvements over the past 8 years.)
On the other hand, its revenue and net profit growth over the years have fluctuated. At the same time, the company is in a net debt position throughout the entire 8-year period I have looked at (but despite having said that, it has remained stable.)
Finally, at its current traded price (of US$60.31 as at market close on 06 June 2023), The Coca-Cola Company is considered to be ‘cheap.’
With that, I have come to my review of The Coca-Cola Company. As always, please note that all the comments you find above are purely mine which I’m sharing for educational purposes only. They do not imply any buy or sell calls for the company’s shares. You’re strongly encouraged to do your own due diligence before you make any investment decisions.
Disclaimer: At the time of writing, I am not a shareholder of The Coca-Cola Company.
Are You Worried about Not Having Enough Money for Retirement?
You're not alone. According to the OCBC Financial Wellness Index, only 62% of people in their 20s and 56% of people in their 30s are confident that they will have enough money to retire.
But there is still time to take action. One way to ensure that you have a comfortable retirement is to invest in real estate investment trusts (REITs).
In 'Building Your REIT-irement Portfolio' which I've authored, you will learn everything you need to know to build a successful REIT investment portfolio, including a list of 9 things to look at to determine whether a REIT is worthy of your investment, 1 simple method to help you maximise your returns from your REIT investment, 4 signs of 'red flags' to look out for and what you can do as a shareholder, and more!

You can find out more about the book, and grab your copy (ebook or physical book) here...


Comments (0)