Some of you may have already been aware that I’ve made another new addition to my long-term investment portfolio in CapitaLand India Trust (SGX:CY6U), at S$1.02 on Tuesday, 16 May 2023 (based on this price, and its full-year distribution payout of 8.19 cents/unit, it represents a yield of an impressive 8.0%.)
Just like for each and every company I have added to this investment portfolio, I will publish an article to talk about reasons for my investment (you can find them here.)
For those of you who may not be too familiar with the REIT, here’s a brief introduction – CapitaLand India Trust, or CLINT for short, was the first Indian property trust in Asia back when it was listed in August 2007. The REIT invests in income-producing IT parks, logistics/industrial assets, and data centre real estate properties located in key Indian cities. As at the end of financial year 2022 (ended 31 December 2022), it has a total of 13 properties (8 IT parks, 3 data centre developments, 1 logistics park, and 1 industrial facility) located in 5 key Indian cities (in Bangalore [1 property], Chennai [4 properties], Hyderabad [4 properties], Mumbai [3 properties], and Pune [1 property]) valued at S$2.5 billion.
In this post, I will be sharing reasons why I’ve made the investment decision on the Singapore-listed, but India-based REIT.
Let’s begin:
1. Tapping into the Growth of the India Market
For those of you who are not already aware, India is one of the fastest-growing economies in the world. There are many factors contributing to this, including a young and growing population (in fact, the country’s population is expected to mach, and then surpass that of China’s, according to a report by the United Nations in April 2023, and you can read about it here – for those who think the population of China is too big not to miss, the same can be said for India), a rising middle-class, along with a strong manufacturing sector.
Another thing to note is that, according to an article published by Enterprise Singapore, the number of Singaporean firms that worked with it to enter India increased by more than 40% compared to 2019 (you can read the article in full here.)
Barring unforeseen circumstances, personally, I am very optimistic of the growth of the India market in the years ahead.
2. Strong Financial Performance
In the following table, you’ll find the REIT’s financial performance over a period of 12 years – from FY2011/12 (between FY2011/12 and FY2018/19, the REIT had a financial year end every 31 March, until CapitaLand’s acquisition and the financial year end changed to every 31 December) all the way till FY2022:
| FY 2011/12 | FY 2012/13 | FY 2013/14 | FY 2014/15 | |
| Gross Revenue (S$’mil) | $127.5m | $126.3m | $120.7m | $128.8m |
| Net Property Income (S$’mil) | $73.0m | $72.1m | $72.1m | $77.6m |
| Distributable Income to Unitholders (S$’mil) | $46.1m | $39.0m | $41.5m | $44.8m |
| FY 2015/16 | FY 2016/17 | FY 2017/18 | FY 2018/19 | |
| Gross Revenue (S$’mil) | $144.0m | $156.7m | $188.2m | $182.0m |
| Net Property Income (S$’mil) | $93.7m | $104.2m | $128.1m | $135.7m |
| Distributable Income to Unitholders (S$’mil) | $50.8m | $52.9m | $57.8m | $76.1m |
| FY 2019 | FY 2020 | FY 2021 | FY 2022 | |
| Gross Revenue (S$’mil) | $150.3m | $191.7m | $192.7m | $210.6m |
| Net Property Income (S$’mil) | $113.4m | $147.9m | $155.7m | $166.8m |
| Distributable Income to Unitholders (S$’mil) | $67.9m | $101.3m | $90.0m | $95.1m |
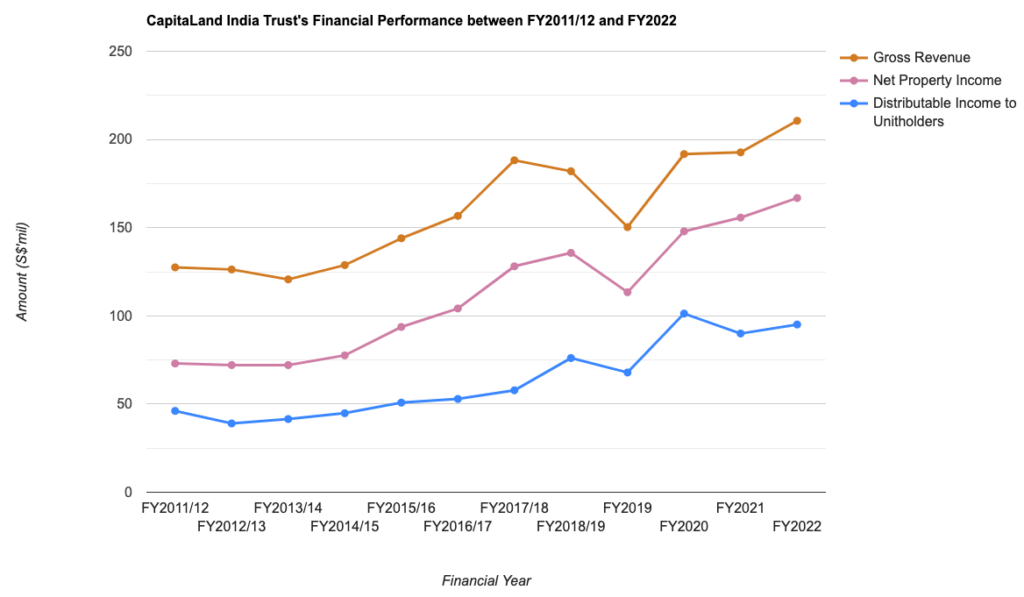
CLINT’s performance over the last 12 years was a pretty stable on in my opinion, where year-on-year (y-o-y) improvements were recorded in most years – for the years where y-o-y declines were recorded, it was mainly due to the strong Singapore Dollar against the India Rupee.
Despite of that, its gross revenue, net property income, as well as distributable income to unitholders still saw a compound annual growth rate (CAGR) of 4.27%, 7.13%, and 6.23% respectively over a 12-year period.
Another thing to note is the resiliency of its financial performance even during the pandemic days (between FY2020 and FY2021) – where they still reported y-o-y increases in its financial performance, as business activities remain undisrupted as they were deem to be ‘essential’.
3. Resilient Portfolio Occupancy
Another aspect when I look at when it comes to reviewing a REIT apart from its financial performance is its portfolio occupancy – and you can check out the statistics recorded over the last 12 financial years (between FY2011/12 and FY2022) in the table and chart below:
| FY 2011/12 | FY 2012/13 | FY 2013/14 | FY 2014/15 | |
| Portfolio Occupancy (%) | 97.0% | 96.0% | 97.0% | 97.0% |
| FY 2015/16 | FY 2016/17 | FY 2017/18 | FY 2018/19 | |
| Portfolio Occupancy (%) | 96.0% | 98.0% | 95.0% | 99.0% |
| FY 2019 | FY 2020 | FY 2021 | FY 2022 | |
| Portfolio Occupancy (%) | 99.0% | 94.0% | 87.0% | 92.0% |
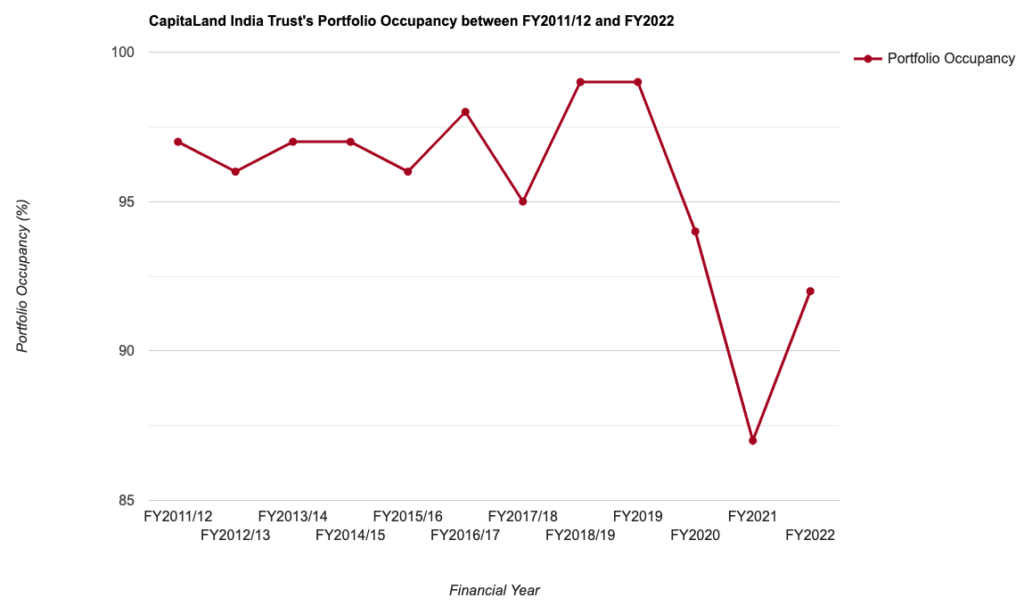
The REIT’s portfolio occupancy rate is, in my opinion, a very strong one, where it has been maintained at above 90.0% in 11 out of 12 years.
On the other hand, as of 31 December 2022, top 10 tenants account for 44% towards the REIT’s portfolio base rent, with the top tenant (being Tata Consultancy Services – where the company is an IT services, consulting, and business solutions organisation partnering with many of the world’s largest businesses for the last 50 years; according to its corporate website, the company is #1 in the UK for 8 years) contributing 12%.
4. Healthy Debt Profile
Especially in the current high interest rate environment, a REIT’s debt profile is very closely watched – where retail investors will very much prefer to invest in those with an aggregate leverage (or gearing level known by some) a safe distance away from the regulatory limit.
Personally, my preference is towards those that are below 40.0%, and as you can see in the table below on CLINT’s aggregate leverage over the last 12 years (between FY2011/12 and FY2022), it has fulfilled this criteria of mine:
| FY 2011/12 | FY 2012/13 | FY 2013/14 | FY 2014/15 | |
| Aggregate Leverage (%) | 29.0% | 22.0% | 22.0% | 25.0% |
| FY 2015/16 | FY 2016/17 | FY 2017/18 | FY 2018/19 | |
| Aggregate Leverage (%) | 26.0% | 29.0% | 26.0% | 31.0% |
| FY 2019 | FY 2020 | FY 2021 | FY 2022 | |
| Aggregate Leverage (%) | 28.0% | 30.0% | 35.0% | 37.0% |
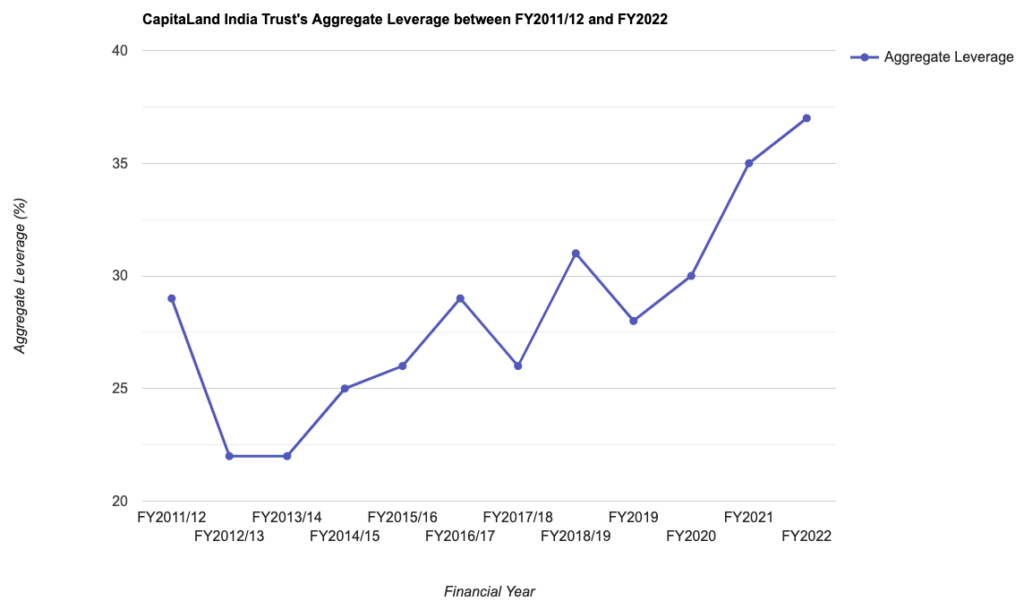
To add on, as at 31 December 2022, the REIT has 76% of borrowings hedged to fixed rates (which provides a good amount of ‘protection’ against the ill-effects of the current high interest rate environment.)
The only slight negative here is that, the REIT has about 34.0% (or S$402.1m) of borrowings due for refinancing in FY2023 – and considering the fact that interest rates are unlikely to come down this year, its financing costs may go up further upon loan refinancing, and its distribution payout may be impacted to a certain extent.
5. Stable Distribution Payouts
Needless to say, one of my requirements when it comes to investing in a REIT is its ability to improve on its distribution payouts over the years.
The management of CLINT pays out a distribution once every half a year, and the following table is its distribution payout over the 12-year period (between FY2011/12 and FY2022):
| FY 2011/12 | FY 2012/13 | FY 2013/14 | FY 2014/15 | |
| Distribution Per Unit (S$’cents) | 6.00 cents | 4.65 cents | 4.56 cents | 4.86 cents |
| FY 2015/16 | FY 2016/17 | FY 2017/18 | FY 2018/19 | |
| Distribution Per Unit (S$’cents) | 5.50 cents | 5.69 cents | 6.10 cents | 7.33 cents |
| FY 2019 | FY 2020 | FY 2021 | FY 2022 | |
| Distribution Per Unit (S$’cents) | 6.45 cents | 8.83 cents | 7.80 cents | 8.19 cents |

The REIT’s distribution payout have saw improvements in most years (which is one of the reasons for my investment decision in it), and over a 12-year period, it has grown at a CAGR of 2.62%.
Finally, in terms of the distribution policy, the REIT will distribute at least 90% of its income available for distribution, and retains 10% for greater flexibility in growing it.
Closing Thoughts
A stable financial performance, resilient portfolio occupancy rate, very healthy aggregate leverage level (where they are maintained at a good distance away from the regulatory limit of 50.0%), along with growth in its distribution payouts over the years are reasons why this Singapore-listed REIT caught my investment eye, and eventually investing in it.
On the other hand, in the near-term, its distribution payout may be impacted as it has 30+% of borrowings due for refinancing in FY2023. Another slight negative will be the fact that top 10 tenants contributing 40+% towards the REIT’s gross revenue (and some may feel this is on the high side.) On top of it, the REIT may continue to suffer from headwinds related to foreign exchange rates (in a weaker Indian Rupee against the Singapore Dollar) – these could be reasons for the REIT’s unit price to weaken of late, but it presented an opportunity for me to invest in it.
With that, I have come to the end of my share today on the reasons why I’ve made the investment decision in CapitaLand India Trust. Please take note that the contents above is purely meant for education purposes only, and they do not represent any buy calls for the REIT’s units. You should always do your own due diligence before making any investment decisions.
Disclaimer: At the time of writing, I am a unitholder of CapitaLand India Trust.
Stop Spending Hours Reading REIT Reports Every Quarter!
What if you could assess a REIT's portfolio occupancy, debt profile, valuation, and overall health in less than 30 seconds - without having to comb through a single quarterly report?
That's the problem the REIT Screener was built to solve.
Developed through a collaboration between ShareInvestor and The Singaporean Investor, the REIT Screener consolidates many of the key metrics and indicators I personally use when analysing REITs into one easy-to-use platform. Instead of spending hours extracting data manually every earnings season, you can now monitor the REITs you own and research new opportunities in just a few clicks.
If you're serious about REIT investing but don't have the time to manually track quarterly developments, the REIT Screener could be the shortcut you've been looking for:

Take a closer look at the REIT Screener here...


Comments (0)