Mapletree Industrial Trust (SGX:ME8U), a constituent of Singapore’s benchmark Straits Times Index (STI), is one of the REITs I have in my long-term investment portfolio – where I invested in it at $3.10 back in October 2020 – back then the yield, based on its distribution payout of 12.16 cents/unit in FY2018/19, was 3.9% (I know its slightly below my preferred 4.0% yield but I still invested in the REIT knowing that its distribution payout to unitholders will go up over time, and at 3.9%, it’s just a whisker away from 4.0%.)
Since then, I have made multiple attempts to average down my invested price of the REIT when its unit price dipped – first down to $2.91 in December 2020, and then to $2.80 in February 2021, and then to $2.79 in September 2021 – based on my current average price, and if I were to continue to take its distribution payout in FY2018/19 (i.e. 12.16 cents/unit), then my yield have been increased to 4.4% – an increase by about 0.5 percentage points (pp).
What I’m going to do in this post is to share with you reasons why I’ve made the investment decision back in October 2020, and continued to remain invested in the REIT till this day, by looking at its financial performance, portfolio occupancy and debt profile, along with its distribution payouts to its unitholders over the past 10 years – between FY2011/12 and FY2020/21 (the REIT has a financial year end every 31 March.)
But first, for the benefit of those who are not familiar with the REIT, here’s a brief introduction:
Brief Introduction of Mapletree Industrial Trust
Listed on the Main Board of the Singapore Exchange since October 2010, and included as a constituent on the STI since 22 June 2020, Mapletree Industrial Trust’s principal strategy is to invest in a diversified portfolio of income-producing real estate used primarily for industrial purposes (Hi-Tech Buildings, Business Park Buildings, Flatted Factories, Stack-up/Ramp-up Buildings and Light Industrial Buildings) in Singapore and also real estate used primarily for data centres in the United States of America.
As at 30 September 2021 (3rd quarter of the financial year 2020/21), the blue-chip REIT’s total assets under management was S$8.5b, comprising of 86 properties in Singapore, along with 57 properties in North America (including 13 data centres held through the joint venture with Mapletree Investments Pte Ltd.)
Financial Performance
Let us take a look at the REIT’s gross revenue, net property income, and its distributable income to unitholders over the past 10 years in the table and chart below:
| FY2011/12 | FY2012/13 | FY2013/14 | FY2014/15 | |
| Gross Revenue (S$’mil) | $246.4m | $276.4m | $299.3m | $313.9m |
| Net Property Income (S$’mil) | $171.3m | $195.4m | $214.7m | $228.6m |
| Distributable Income to Unitholders (S$’mil) | $131.7m | $151.0m | $166.1m | $180.8m |
| FY2015/16 | FY2016/17 | FY2017/18 | FY2018/19 | |
| Gross Revenue (S$’mil) | $331.6m | $340.6m | $363.2m | $376.1m |
| Net Property Income (S$’mil) | $245.1m | $256.8m | $277.6m | $287.8m |
| Distributable Income to Unitholders (S$’mil) | $197.8m | $205.0m | $215.8m | $231.8m |
| FY2019/20 | FY2020/21 | |||
| Gross Revenue (S$’mil) | $405.9m | $447.2m | ||
| Net Property Income (S$’mil) | $318.1m | $351.0m | ||
| Distributable Income to Unitholders (S$’mil) | $265.3m | $295.3m |

As you can see from the above, over the past 10 financial years, the REIT has recorded a steady growth in its top- and bottom-line, with year-on-year improvements recorded every single year.
In terms of its compound annual growth rate (or CAGR) over a 10-year period, its gross revenue grew at 6%, its net property income at 7%, and its distributable income to unitholders at 8% – pretty impressive in my personal opinion (and I’m sure you’ll agree with me as well.)
Portfolio Occupancy
When it comes to reviewing a REIT’s portfolio occupancy, my preference is towards those that are able to record an occupancy rate of over 90.0% at least, and at the same time, be able to maintain its occupancy rate at this percentage (or even better) over the years.
Did Mapletree Industrial Trust’s portfolio occupancy recorded over the years fulfil this criteria of mine? Let us take a look below:
| FY2011/12 | FY2012/13 | FY2013/14 | FY2014/15 | |
| Portfolio Occupancy (%) | 94.9% | 95.4% | 91.3% | 90.2% |
| Portfolio WALE (by Gross Rental Income – Years) | 2.5 years | 2.4 years | 2.5 years | 3.1 years |
| FY2015/16 | FY2016/17 | FY2017/18 | FY2018/19 | |
| Portfolio Occupancy (%) | 94.6% | 93.1% | 90.0% | 90.2% |
| Portfolio WALE (by Gross Rental Income – Years) | 2.8 years | 3.1 years | 3.8 years | 3.6 years |
| FY2019/20 | FY2020/21 | |||
| Portfolio Occupancy (%) | 91.5% | 93.7% | ||
| Portfolio WALE (by Gross Rental Income – Years) | 4.2 years | 4.0 years |
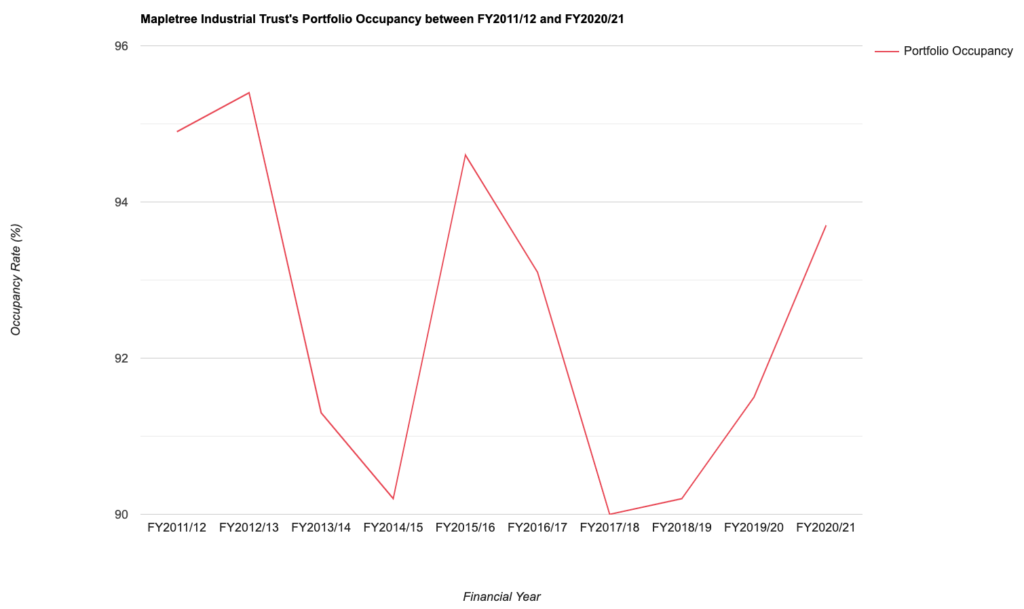
My Observations: It’s good to note that in terms of its portfolio occupancy has been fluctuating at around the 90+% range over the last 10 years. At the same time, its portfolio WALE (Weighted Average Lease Expiry) by gross rental income has also been on an upward moving trend over the years – which is another plus point.
Debt Profile
My selection criteria as far as the REIT’s debt profile is concerned is one where its aggregate leverage (or gearing ratio) has ample of headroom (of about 10.0%) before it reaches its regulatory limit – from 2022, for REITs that are able to maintain an interest coverage of 2.5x, its aggregate leverage limit will be at 50.0%, and for those that are unable to do so, then its aggregate leverage limit will be at 45.0%.
With that in mind, let us now take a look at Mapletree Industrial Trust’s debt profile recorded over the last 10 years below:
| FY2011/12 | FY2012/13 | FY2013/14 | FY2014/15 | |
| Aggregate Leverage (%) | 37.8% | 34.8% | 34.4% | 30.6% |
| Interest Coverage Ratio (times) | 6.1x | 6.6x | 8.1x | 8.0x |
| Average Term to Debt Maturity (years) | 3.0 years | 2.7 years | 2.6 years | 3.7 years |
| Average Cost of Debt (%) | 2.3% | 2.4% | 2.0% | 2.3% |
| FY2015/16 | FY2016/17 | FY2017/18 | FY2018/19 | |
| Aggregate Leverage (%) | 28.2% | 29.2% | 33.1% | 33.8% |
| Interest Coverage Ratio (times) | 8.0x | 7.7x | 6.7x | 6.5x |
| Average Term to Debt Maturity (years) | 2.7 years | 3.5 years | 3.3 years | 4.4 years |
| Average Cost of Debt (%) | 2.5% | 2.7% | 2.9% | 3.0% |
| FY2019/20 | FY2020/21 | |||
| Aggregate Leverage (%) | 37.6% | 40.3% | ||
| Interest Coverage Ratio (times) | 7.7x | 6.0x | ||
| Average Term to Debt Maturity (years) | 4.7 years | 3.6 years | ||
| Average Cost of Debt (%) | 2.9% | 2.8% |

My Observations: Based on its interest coverage ratio over the years, the regulatory limit for its aggregate leverage will be at 50.0% (as it was maintained at above 2.5x) – and if you look at this particular statistic over the years, it has been consistently maintained at around the 30+% range, and this fulfils my selection criteria in that a REIT have to have an aggregate leverage with a debt headroom of around 10% before it reaches the regulatory limit – this allows the REIT to be able to embark on more acquisitions as an when an opportunity to do so comes along.
Also, looking at the other 2 statistics (i.e. its average term to debt maturity and its average cost of debt) it has been pretty stable as well – with the former averaging at around 3+ years, and the latter hoovering at around 2+% range.
If there’s one slight negative as far as the REIT’s debt profile over the years is concerned, it will be that its its aggregate leverage has been on an upward moving trend since FY2015/16 – though its not too much of a problem now as there’s still ample debt headroom, but if it continues trending up down the road, then it may be a cause for concern.
Distribution Payout to Unitholders
For those who prefer to invest their money in REITs that are able to pay out a distribution on a quarterly basis – this REIT is one you may like to consider, as the management declares a distribution payout to its unitholders once every 3 months (and this is one of the reasons why I’ve made the investment decision on the REIT as well.)
The following is the REIT’s distribution payout to its unitholders over the last 10 years:
| FY2011/12 | FY2012/13 | FY2013/14 | FY2014/15 | |
| Distribution Per Unit (S$’cents) | 8.41 cents | 9.24 cents | 9.92 cents | 10.43 cents |
| FY2015/16 | FY2016/17 | FY2017/18 | FY2018/19 | |
| Distribution Per Unit (S$’cents) | 11.15 cents | 11.39 cents | 11.75 cents | 12.16 cents |
| FY2019/20 | FY2020/21 | |||
| Distribution Per Unit (S$’cents) | 12.24 cents | 12.55 cents |
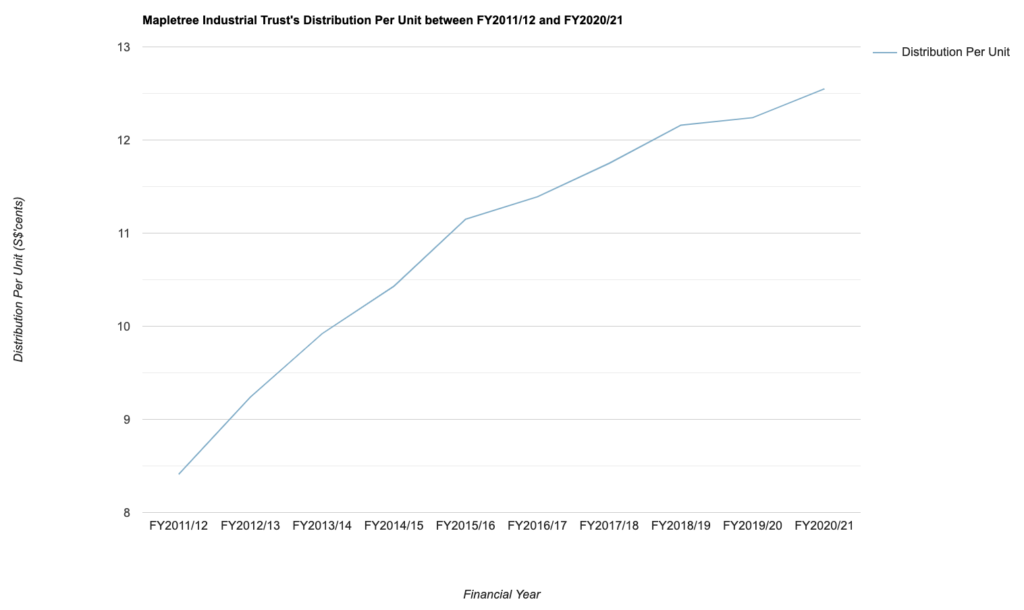
From the table and chart above, you can see that not only has the REIT been paying out its unitholders on a quarterly basis, but it has improved its payout every single year over the last 10 years – and in terms of its CAGR over the past 10 years, it is at 4% – again in my opinion it is pretty impressive.
Closing Thoughts
A consistently growing set of financial results over the years, resilient portfolio occupancy and debt profile, along with improving distribution payouts to unitholders are reasons why I’ve made the investment decision on the REIT back in October 2020, and remained as a unitholder since.
If there’s a slight negative, then it will be that its aggregate leverage has been on an upward moving trend since bottoming at FY2015/16 – even though that’s not a problem for now as there still remains plenty of debt headroom before the regulatory level is reached, but if it were to continue its upward moving trend in the financial years to come, it may be some cause for concern.
Finally, some of you may be keen to know of my thoughts about the REIT’s recent unit price drop – from a high of $3.02 back in August 2021 down to a low of $2.61 at the time of writing this post. Personally, this unit price drop (especially in the past few trading sessions) has nothing to do with its business fundamentals – instead, it is likely due to REITs losing favour with investors as a result of an impending interest rate hike (as REITs may see its gearing ratio pip up as a result; but in my opinion, REITs that has a conservative aggregate leverage will do just fine), and also due to investors losing interest with Mapletree REITs in general due to the negativity surrounding the proposed merger between Mapletree North Asia Commercial Trust and Mapletree Commercial Trust (I have written about this last week, and you can read more about it here.)
With that, I have come to the end of my review of Mapletree Industrial Trust historical results. Hope you’ve found the contents above useful. Also, as always, please do your due diligence before you make any investment decisions.
Disclaimer: At the time of writing, I am a unitholder of Mapletree Industrial Trust.
Are You Worried about Not Having Enough Money for Retirement?
You're not alone. According to the OCBC Financial Wellness Index, only 62% of people in their 20s and 56% of people in their 30s are confident that they will have enough money to retire.
But there is still time to take action. One way to ensure that you have a comfortable retirement is to invest in real estate investment trusts (REITs).
In 'Building Your REIT-irement Portfolio' which I've authored, you will learn everything you need to know to build a successful REIT investment portfolio, including a list of 9 things to look at to determine whether a REIT is worthy of your investment, 1 simple method to help you maximise your returns from your REIT investment, 4 signs of 'red flags' to look out for and what you can do as a shareholder, and more!

You can find out more about the book, and grab your copy (ebook or physical book) here...


Comments (5)