I probably do not need to do any further introduction about Singapore’s biggest local bank – DBS Group Holdings Limited (SGX:D05). As Singaporeans, all of us probably have a savings account opened with them (I remembered opening mine back when I was 7, when we were required to open a bank account by the school.)
However, many probably are not aware that, besides Singapore, DBS also have business presences in other countries – in Australia, China, Hong Kong, India, Indonesia, Japan, Malaysia, Myanmar, South Korea, Taiwan, Thailand, The Philippines, United Arab Emirates, United States of America, as well as in Vietnam.
I added the bank to my long-term investment portfolio in March 2020, at a price of $24.00 – which, based one my knowledge of technical analysis, was a major support line where its share price tend to bounce back up shortly after touching this price point. Also, in terms of its dividend payout of $1.23/share in FY2019, the yield at my buy price was at 5.1% (which satisfied my requirement of my investments providing me with a yield of at least 4.0%.) Apart from its share price, the reason why I’ve made the investment decision was also due to its strong performance over the years (more on that later in this post.)
Unfortunately, shortly after my investment in the bank, the worsening of Covid-19 in the country sent its share price all the way down to a multi-year low of $16.65 on 23 March – yes, I know I should have averaged down, but I did not, as back then, markets all over the world were in red due to the pandemic worsening. At the same time, I held on to my existing shareholdings too, as the bank’s business fundamentals remained intact. Fast forward to today, as I’m looking at its share price (of $31.88) right now, I’m happy to note the 24.7% unrealised capital gain (based on my invested price of $24.00) – and that’s excluding all the dividends I’ve received over the period of close to 2 years.
What I’m going to do in the remainder of today’s post is, I’m going to share with you researches I’ve done on the bank’s performances over the last 9 financial years (between FY2012 and FY2020) – in terms of its key financial performances and statistics, along with its dividend payout declared to its shareholders, along with my outlook for the bank’s performances in the coming year ahead.
Let’s get started…
Key Financial Performances
The following table is a summary of some of the key financial performances reported by DBS over a 9-year period (between FY2012 and FY2020):
| FY2012 | FY2013 | FY2014 | FY2015 | FY2016 | |
| – Net Interest Income (S$’mil) | $5,285m | $5,569m | $6,321m | $7,100m | $7,305m |
| – Net Fee & Commission Income (S$’mil) | $1,579m | $1,885m | $2,027m | $2,144m | $2,331m |
| – Other Non- Interest Income (S$’mil) | $1,200m | $1,473m | $1,270m | $1,557m | $1,853m |
| Total Income (S$’mil) | $8,064m | $8,927m | $9,618m | $10,801m | $11,489m |
| Net Profit (S$’mil) | $3,809m | $3,672m | $4,046m | $4,454m | $4,238m |
| FY2017 | FY2018 | FY2019 | FY2020 | ||
| – Net Interest Income (S$’mil) | $7,791m | $8,955m | $9,625m | $9,076m | |
| – Net Fee & Commission Income (S$’mil) | $2,622m | $2,780m | $3,052m | $3,058m | |
| – Other Non- Interest Income (S$’mil) | $1,511m | $1,448m | $1,867m | $2,458m | |
| Total Income (S$’mil) | $11,924m | $13,183m | $14,544m | $14,592m | |
| Net Profit (S$’mil) | $4,371m | $5,625m | $6,391m | $4,721m |
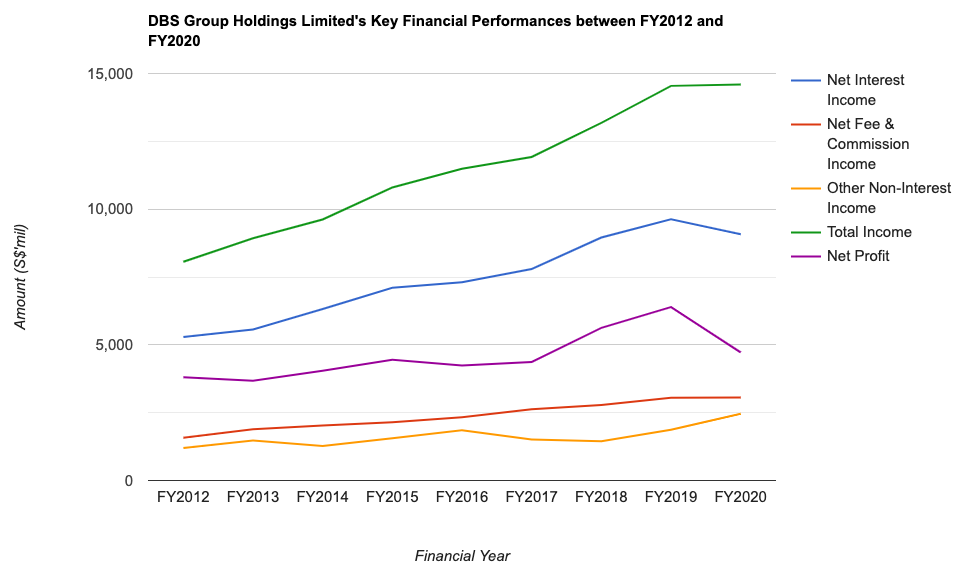
DBS’ net interest income saw year-on-year (y-o-y) improvements every single year, except for in the latest full year under review (i.e. FY2020) due to lower net interest margins as central banks globally slashed interest rates – over a 9-year period, its net interest income grew at a compound annual growth rate (CAGR) of 6% – which in my opinion is really impressive!
The bank’s impressive performance continued in its net fee and commission income, where it recorded y-o-y growths every single year over the past 9 years I have looked at, with a CAGR of 7%.
For its other non-interest income, it saw y-o-y declines in 3 financial years (in FY2014 and in FY2017, with declines on both years due to a drop in net trading income, as well as in FY2018, due to lower gains from investment securities) – despite of that, its other non-interest income still managed to record a strong CAGR of 8% over a 9-year period.
Finally, the bank’s net profit too saw y-o-y declines in the following 3 years:
FY2013 – Due to a lower gain recorded from the partial divestment of a stake in the Bank of Philippine Islands, as well as a sum of $50m set aside to establish DBS Foundation to strengthen the bank’s commitment to social and community development;
FY2016 – Due to a lack of one-off item (of $136m) recorded in the previous financial year;
FY2020 – Due to a 27 basis point decline in net interest margin to 1.62%, along with the quadrupling of allowances to $3.07b.
Despite of the above, the bank’s net profit still managed to record a CAGR of about 2% over a 9-year period.
Key Financial Statistics
In the table below, you’ll find some of the key financial statistics that I look at whenever I study about a bank:
| FY2012 | FY2013 | FY2014 | FY2015 | FY2016 | |
| Net Interest Margin (%) | 1.70% | 1.62% | 1.68% | 1.77% | 1.80% |
| Return on Equity (%) | 11.2% | 10.8% | 10.9% | 11.2% | 10.1% |
| Non-Performing Loans Rate (%) | 1.2% | 1.1% | 0.9% | 0.9% | 1.4% |
| FY2017 | FY2018 | FY2019 | FY2020 | ||
| Net Interest Margin (%) | 1.75% | 1.85% | 1.89% | 1.62% | |
| Return on Equity (%) | 9.7% | 12.1% | 13.2% | 9.1% | |
| Non-Performing Loans Rate (%) | 1.7% | 1.5% | 1.5% | 1.6% |

My Observations: What’s impressive for the bank is that, despite its net interest margin fluctuating over the years, its net interest income has been able to consistently record improving sets of results in the same time period – the reason is because the bank has been able to grow its loans volume to cushion any impact that the fluctuating net interest margins may have on the growth of its net interest income.
For its return on equity, if you were to disregard the figure recorded in FY2020 (due to massive headwinds faced by the bank as a result of the Covid-19 pandemic), the last couple of years (between FY2017 and FY2019) have seen the bank recording improvements – from a low of 9.7% in FY2017 to a high of 13.2% in FY2019 (which also happens to be a record breaking statistic.)
Finally, its non-performing loans rate have also come down and stabilise after climbing to a high of 1.7% in FY2017 (which happen to be the highest over the 9 year period I have looked at.)
Dividend Payout to Shareholders
Since FY2019, the bank’s management have increased its dividend payout frequency from once every half-yearly to once every quarterly – this is also one of the reasons why I’ve made the investment decision on the bank, as my preference is towards companies that are able to declare a dividend payout to its shareholders on a quarterly basis.
With that, let us take a look at its dividend payout, along with its payout ratio over the past 9 years (between FY2012 and FY2020):
| FY2012 | FY2013 | FY2014 | FY2015 | FY2016 | |
| Dividend Per Share (S$’cents) | 56.0 cents | 58.0 cents | 58.0 cents | 60.0 cents | 60.0 cents |
| Dividend Payout Ratio (%) | 35.9% | 39.2% | 36.0% | 33.9% | 36.1% |
| FY2017 | FY2018 | FY2019 | FY2020 | ||
| Dividend Per Share (S$’cents) | 143.0 cents | 120.0 cents | 123.0 cents | 87.0 cents | |
| Dividend Payout Ratio (%) | 84.6% | 55.6% | 50.0% | 48.0% |
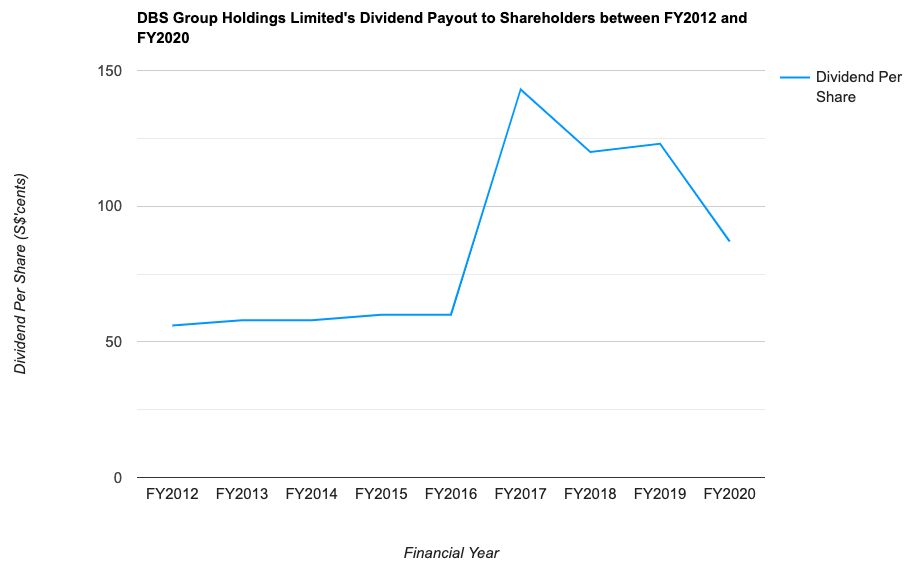
My Observations: In case you’re wondering about the bump in dividend payout by the bank in FY2017, it was due to a special dividend of 50.0 cent/share declared when it released its fourth quarter and full-year results; excluding it, the bank’s dividend payout for the financial year would have been 93.0 cents.
Another year to look at was in FY2020 – where the dividend payout was just 87.0 cents – this can be attributed to the bank following MAS’ regulation to cap its payout for the financial year to 60.0% of what was paid in the previous financial year for prudence (due to the Covid-19 pandemic.)
In terms of its payout ratio, over the years, I noticed that the bank tends to keep it to about 50.0% (except in FY2017, due to a special dividend being paid out.) Moving forward, as long as the bank is able to continue to report improving sets of results, its dividend payouts should also go up in tandem.
In Conclusion
I’m sure you’ll agree with me that DBS Group Holdings’ results over the years have been nothing short of impressive – what I like is that the bank’s ability to consistently grow its net interest margin over the years (except in FY2020, due to massive headwinds faced by the bank as a result of the Covid-19 pandemic.)
And speaking about the Covid-19 pandemic, despite of massive disruptions to the bank’s normal operations, it still managed to record growth in its total revenue (thanks to improvements made in its net fee and commission income, as well as in its other non-interest income.)
Dividend payouts to its shareholders have also improved over the years – where it has recorded a CAGR of 5% over the past 9-years (however, if you exclude FY2020, the CAGR would have been a solid 10% over a 8-year period.)
Looking ahead, with the Fed set to raise interest rates next year, I’m of the opinion that the bank will benefit in terms of its net interest income. Also, as normal business activities gradually resume, barring another huge wave of Covid-19 spread (and blanketed lockdowns being required once again to slowdown the rate of virus transmission in the community), the bank’s financial performance will benefit too – and with its performance improving, so too will its dividend payouts to shareholders.
With that, I have come to the end of my writeup about the Singapore bank’s past year performances. Finally, a disclaimer that the information above is purely for educational purposes only, and they do not represent any buy or sell calls for the bank’s shares. You are strongly advised to always do your own due diligence before making any investment decisions.
Disclaimer: At the time of writing, I am a shareholder of DBS Group Holdings Limited.
Are You Worried about Not Having Enough Money for Retirement?
You're not alone. According to the OCBC Financial Wellness Index, only 62% of people in their 20s and 56% of people in their 30s are confident that they will have enough money to retire.
But there is still time to take action. One way to ensure that you have a comfortable retirement is to invest in real estate investment trusts (REITs).
In 'Building Your REIT-irement Portfolio' which I've authored, you will learn everything you need to know to build a successful REIT investment portfolio, including a list of 9 things to look at to determine whether a REIT is worthy of your investment, 1 simple method to help you maximise your returns from your REIT investment, 4 signs of 'red flags' to look out for and what you can do as a shareholder, and more!

You can find out more about the book, and grab your copy (ebook or physical book) here...


Comments (0)