Previously known as CapitaLand Mall Trust, which was a pure-play retail REIT with 11 shopping malls located in the various parts of Singapore, was later renamed as CapitaLand Integrated Commercial Trust (or CICT for short) after its merger with CapitaLand Commercial Trust (where its portfolio comprises of office properties in Singapore and Germany) in November 2020.
Following its merger with CapitaLand Commercial Trust, CICT’s property portfolio comprises a total of 22 retail, office, and integrated development properties as follows:
Retail Properties:
- Bedok Mall
- Bugis+
- Bugis Junction
- Bukit Panjang Plaza
- Clarke Quay
- IMM Building
- JCube
- Junction 8
- Lot One Shoppers Mall
- Tampines Mall
- Westgate
Office Properties:
- Asia Square Tower 2
- CapitaGreen
- Capital Tower
- One George Street
- Six Battery Road
- 21 Collar Quay
- Gallileo (in Frankfurt, Germany)
- Main Airport Center (in Frankfurt Germany)
Integrated Development:
- CapitaSpring
- Funan
- Raffles City Singapore
- Plaza Singapura
- The Atrium@Orchard
Just a couple of days back (on 07 December 2021), the REIT announced its expansion in another geographic location (Australia) with the acquisition of 2 Grade ‘A’ office properties – 66 Goulburn Street, and 100 Arthur Street – both located in Sydney, Australia (you can read the announcement in full here.) To fund the acquisition, it conducted a private placement at S$1.96 per unit (you can read more about it in full here), along with a declaration of an advanced distribution payout of between 4.80 and 4.90 cents/unit for the period between 01 July and 15 December 2021 to existing unitholders (the announcement can be found here.)
I have been a unitholder of the REIT since end-February 2020 when my initial invested price was at $2.32 (giving me a yield of 5.2% based on its full year payout of 11.97 cents/unit in FY2019). However, in the months thereafter, I have made attempts to average down my price and currently, my average price of the REIT is at $2.09 (if I were to compute the yield based on the full year payout in FY2019, the yield is now increased to 5.7%.)
In the rest of this post, you’ll read about the REIT’s performance over a 9-year period – between FY2012 and FY2020, where you’ll find its key financial results, portfolio occupancy and debt profile, along with its distribution payouts to unitholders. Additionally, you’ll also read about thoughts about the REIT’s performances over the years, and my outlook for it in the financial year ahead.
Let’s begin…
Financial Performance
CICT has a financial year end every 31 December. In the table and chart below, you’ll find its key financial performance recorded over a 9-year period – between FY2012 and FY2020:
| FY2012 | FY2013 | FY2014 | FY2015 | FY2016 | |
| Gross Revenue (S$’mil) | $661.6m | $637.6m | $658.9m | $669.0m | $689.7m |
| Net Property Income (S$’mil) | $445.3m | $438.7m | $448.4m | $466.2m | $479.7m |
| Distributable Income to Unitholders (S$’mil) | $316.9m | $356.2m | $375.3m | $392.0m | $394.3m |
| FY2017 | FY2018 | FY2019 | FY2020 | ||
| Gross Revenue (S$’mil) | $682.5m | $697.5m | $786.7m | $745.2m | |
| Net Property Income (S$’mil) | $478.2m | $493.5m | $558.2m | $512.7m | |
| Distributable Income to Unitholders (S$’mil) | $395.8m | $410.7m | $441.6m | $369.4m |

Over a 9-year period, both its gross revenue and net property income saw year-on-year declines in 3 years – in FY2013, FY2017 (due to the lack of revenue contribution from Funan, which was closed for re-development), as well as in FY2020 (due to lower gross rental income arising from rental waivers granted by the landlord to tenants affected by the Covid-19 pandemic, along with lower occupancy and rental rates contracted on new and renewed leases.)
On the other hand, the REIT’s distributable income to unitholders saw y-o-y improvements for all years except in FY2020.
In terms of its compound annual growth rate (CAGR) over a 9-year period, it was at 1% for its gross revenue, and 2% for its net property income and distributable income to unitholders. However, if I were to exclude results recorded in FY2020 (where its negatively impacted by Covid-19), its gross revenue and net property income would have grown at a CAGR of 2% and 3% respectively, and its distributable income to unitholders have recorded a 4% CAGR – which is pretty decent in my opinion.
Portfolio Occupancy
The following table is CICT’s portfolio occupancy recorded between FY2012 and FY2020:
| Occupancy Rate | FY2012 | FY2013 | FY2014 | FY2015 | FY2016 |
| Retail | 98.2% | 98.5% | 98.8% | 97.6% | 98.5% |
| Office | – | – | – | – | – |
| Integrated Development | – | – | – | – | – |
| Occupancy Rate | FY2017 | FY2018 | FY2019 | FY2020 | |
| Retail | 99.2% | 99.2% | 99.3% | 98.0% | |
| Office | – | – | – | 98.0% | |
| Integrated Development | – | – | – | 97.8% |
My Observations: Over a 9-year period, it is good to note that the REIT’s properties have been maintained at a very high occupancy rate – where all of its asset types have maintained its occupancy rate at above 95.0%.
For those of you who are wondering the percentage of rentals which will be expiring in the near-term – according to its business update for the third quarter of FY2021 ended 30 September 2021, only 2.2% of its retail and 2.0% of its office leases will be expiring in the final quarter of the current financial year. For the upcoming FY2022 ahead, 20.7% of the retail leases, and 9.9% of the office leases will be expiring.
Also, as far as tenant contributions to the REIT’s gross rental income is concerned, the top 10 tenants contributed about 20.8% towards its total gross rental income, and no single tenant contributes more than 5% – as such, there is tenant diversification here.
Debt Profile
Before I discuss about CICT’s debt profile over the past 9 years, in case you’re not already aware, from FY2022, REITs with an interest coverage ratio of at least 2.5x will have its aggregate leverage (or gearing ratio) capped at 50.0%. Otherwise, it will be capped at 45.0%.
When it comes to my ideal aggregate leverage, my preference is towards REITs that are able to maintain this ratio about 10.0% away from the regulatory limit. Did CICT meet this requirement of mine? Let us find out in the table below:
| FY2012 | FY2013 | FY2014 | FY2015 | FY2016 | |
| Aggregate Leverage (%) | 36.7% | 35.3% | 33.8% | 35.4% | 34.8% |
| Interest Coverage Ratio (times) | 3.2x | 4.2x | 4.5x | 4.8x | 4.8x |
| Average Term to Debt Maturity (years) | 3.9 years | 3.6 years | 4.7 years | 5.3 years | 5.3 years |
| Average Cost of Debt (%) | 3.3% | 3.4% | 3.5% | 3.3% | 3.2% |
| FY2017 | FY2018 | FY2019 | FY2020 | ||
| Aggregate Leverage (%) | 34.2% | 34.2% | 32.9% | 40.6% | |
| Interest Coverage Ratio (times) | 4.8x | 5.2x | 4.7x | 3.8x | |
| Average Term to Debt Maturity (years) | 4.9 years | 4.4 years | 5.0 years | 4.1 years | |
| Average Cost of Debt (%) | 3.2% | 3.1% | 3.2% | 3.8% |

My Observations: Looking at its aggregate leverage, it has been maintained at around the 35.0% range between FY2012 and FY2019 (which is about 10.0% away from the regulatory limit at 45.0%.) As for FY2020, when its aggregate leverage was temporarily raised to 50.0% (by the MAS to help them navigate operating challenges posed by Covid-19, and you can read about this in full here), at 40.6%, it also satisfied my requirement of REITs having a 10.0% headroom from its regulatory limit.
Also, as far as its average cost of debt is concerned, in my opinion, it has largely remained stable.
Finally, on its debt maturity, as at the end of the third quarter of the financial year 2021 on 30 September 2021, only 1% (or $75m) of its borrowings will be maturing. In the coming financial year 2022, 12% (or $1,111m) of its borrowings will be maturing.
Distribution Payout to Unitholders
Prior to the current financial year 2021, CICT have been paying out a distribution to its unitholders on a quarterly basis (which is one of the reasons why I’ve invested in the REIT.) From the financial year 2021 onwards, the payout frequency has been changed to twice annually – once when it releases its second quarter results, and once when it releases its fourth quarter results.
So, how has its distribution payouts grown over the past 9 years? Let us find out in the table below:
| FY2012 | FY2013 | FY2014 | FY2015 | FY2016 | |
| Distribution Per Unit (S$’cents) | 9.46 cents | 10.27 cents | 10.84 cents | 11.25 cents | 11.13 cents |
| FY2017 | FY2018 | FY2019 | FY2020 | ||
| Distribution Per Unit (S$’cents) | 11.16 cents | 11.50 cents | 11.97 cents | 8.69 cents |
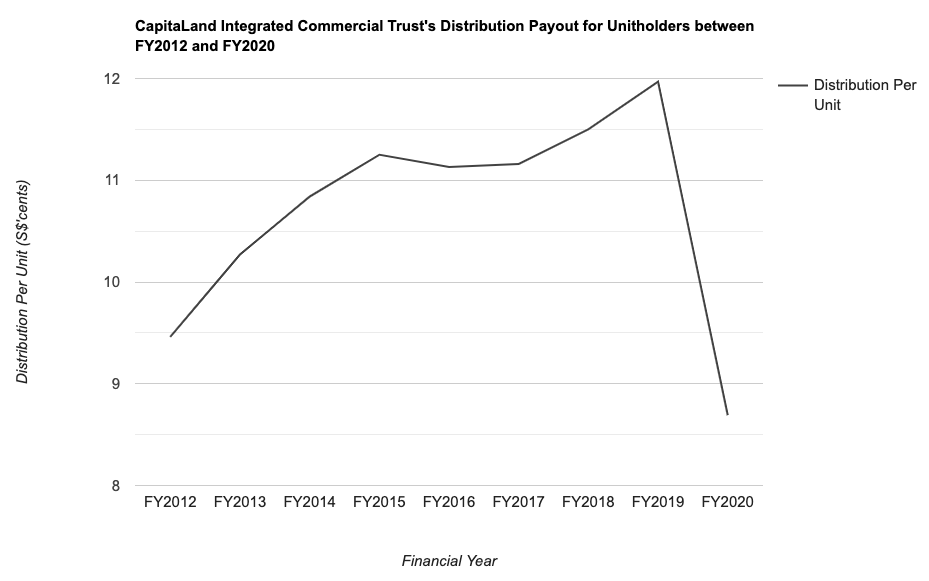
As you can see from the chart above, over the past 9 years, CICT’s distribution payout has been on the rise, except for in FY2016 (where capital distribution and tax-exempt income received from CapitaLand Retail China Trust in FY2015 and Q3 FY2016 had been retained for general corporate and working capital purposes) as well as in FY2020 (where its payout was disrupted due to headwinds associated with the Covid-19 pandemic.)
In terms of its CAGR growth, if you were to include FY2020, then the growth would have been a negative one. If you were to exclude it, then the CAGR was at 3% – again I consider it to be pretty decent.
Closing Thoughts
When it comes to investments, my preference is towards those that are able to exhibit a stable growth in its revenue and net profit, as well as in its dividend payouts (for the case of a REIT, it is known as distribution payouts) to shareholders (for REITs, it is known as unitholders) over a period of at least 3 years. At the same time, if the company I’m looking at is a REIT, then its portfolio occupancy rate must remain resilient (i.e. at least an occupancy rate of 90.0% and above), and that for its debt profile, its aggregate leverage must have sufficient headroom (of about 10.0%) before it reaches the regulatory limit set by the MAS.
CapitaLand Integrated Commercial Trust satisfies all the criteria I have above, which explains why I’ve made the investment decision in the REIT back in 2020, and remain invested in the REIT till now.
Looking forward, as far as growth of the REIT is concerned, I’m convinced that the worst (as far as Covid-19 is concerned) is beyond us, and things should slowly return to pre-Covid levels starting from 2022 (provided if the newly discovered Omicron variant is successfully contained) – as people start to return to their workplaces (where working from home is no longer the default), visitor footfall to malls in or near the CBD area (some of the REIT’s malls located in such areas include Plaza Singapura, Bugis Junction, and Bugis+) should improve. The same can also be said for tenant sales. Additionally, income contribution from the newly acquired properties in Australia will also contribute to the improvement of the REIT’s financial performance.
With that, I have come to the end of my review of CapitaLand Integrated Commercial Trust’s performances over the past 9 years, as well as my outlook for it in the coming year ahead. I do hope you’ve found the contents presented above useful, and as always, do take note that everything you’ve just read is purely for informational purposes only, and they do not constitute of any buy or sell calls for the REIT’s units. Please do your own due diligence before you make any investment decisions.
Disclaimer: At the time of writing, I am a unitholder of CapitaLand Integrated Commercial Trust.
Stop Spending Hours Reading REIT Reports Every Quarter!
What if you could assess a REIT's portfolio occupancy, debt profile, valuation, and overall health in less than 30 seconds - without having to comb through a single quarterly report?
That's the problem the REIT Screener was built to solve.
Developed through a collaboration between ShareInvestor and The Singaporean Investor, the REIT Screener consolidates many of the key metrics and indicators I personally use when analysing REITs into one easy-to-use platform. Instead of spending hours extracting data manually every earnings season, you can now monitor the REITs you own and research new opportunities in just a few clicks.
If you're serious about REIT investing but don't have the time to manually track quarterly developments, the REIT Screener could be the shortcut you've been looking for:

Take a closer look at the REIT Screener here...


Comments (2)