Back in late-January 2020 (just before the Coronavirus started to spread worldwide, leading to immigration borders to close, and lockdowns implemented to bring down the spread of the virus in the community), I’ve added EC World REIT (SGX:BWCU) to my long-term portfolio at $0.71 (the price was determined based on technical analysis, where I’ve noticed its unit price tend to bounce back up whenever it hits this price point) Also, at my invested price, and based on the REIT’s distribution payout of 6.047 cents/unit in FY2019, my invested price represented a yield of 8.5% – which was way above my minimum requirement of a 4.0% yield.
Of course, its not all smooth sailing for me as a unitholder of the REIT – I’ve continued to remain invested in it even when its unit price plunged to a low of just $0.41 in mid-March when the pandemic was at its worst (why I did not divest in the REIT was because I’m confident that its financial figures will improve once the pandemic was beyond us), as well as in mid-July, when it was reported that the Chief Investment Officer of the REIT was under probe by the Commercial Affairs Department (CAD) and the Monetary Authority of Singapore (the reason why I continued to remain invested was because the CAD indicated that EC World REIT and the manager of the REIT were not under investigation – you can read about my views when the event happened back in July 2020 here.)
My patience in the REIT was rewarded in that, based on its current traded price of $0.80 at the time of writing, I’m sitting on a 12.7% capital gain (and the percentage becomes bigger if I were to include the distributions received) – personally, I felt it wasn’t too bad in terms of returns for about 2 years.
In this post, I’ll be sharing with you the REIT’s full-year financial results, portfolio occupancy and debt profile, as well as its distribution payouts to unitholders since its listing on 28 July 2016 (the period I’ll be looking at will be between FY2017 and FY2020). But first, for those of you who may be hearing about this REIT for the very first time, here’s a brief introduction:
A Brief Introduction about EC World REIT
EC World REIT is a pure-play China REIT, where its all the properties in its portfolio are located in the country.
At the time of writing, its portfolio consists of e-commerce logistics assets (4 in total, namely Fu Heng, Fuzhou E-Commerce, Stage 1 Properties of Bei Gang, as well as Wuhan Meiluote), specialised logistics assets (1 in total, namely Hengde Logistics, with its major tenant being China Tobacco), and port logistics assets (3 in total, namely Chongxian Port Investment, Chongxian Port Logistics, and Fu Zhuo Industrial.)
Another thing to note is that, apart from Wuhan Meiluote (which is 79.4% occupied), the REIT’s remaining 7 other properties are fully occupied, with just a small percentage of leases will be expiring over the next 2 years (just 5.9% in the final quarter of 2021, and another 6.9% in the year 2022.)
Financial Performance
The following is the REIT’s key financial performance figures for the most recent 4 full years since its listing (i.e. between FY2017 and FY2020):
| FY2017 | FY2018 | FY2019 | FY2020 | |
| Gross Revenue (S$’mil) | $91.4m | $96.2m | $99.1m | $109.7m |
| Net Property Income (S$’mil) | $82.7m | $87.3m | $89.7m | $100.3m |
| Distributable Income to Unitholders (S$’mil) | $47.1m | $48.8m | $48.2m | $43.1m |
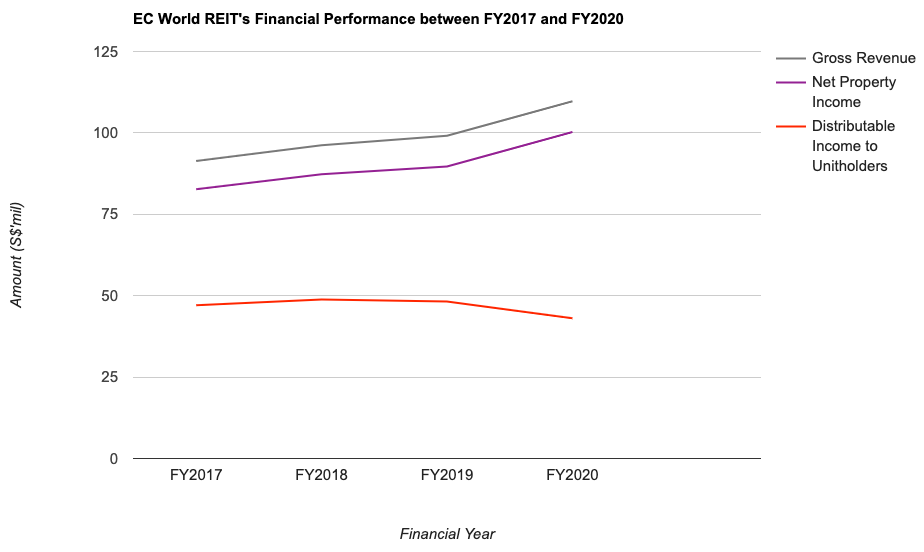
The REIT’s gross revenue, as well as its net property income, saw improvements over the last 4 years, primarily due to organic rental escalations – in terms of its compound annual growth rate (CAGR), they both grew at 5% – which in my opinion is pretty decent.
However, its distributable income to unitholders fell in the most recent 2 years – with the 1.2% year-on-year (y-o-y) drop in FY2019 due to foreign exchange difference, technical timing difference between the loan drawdown and the completion of the acquisition of Fuzhou E-commerce in the third quarter of the financial year, as well as the retention of 5% of the distributable income in the fourth quarter; the 10.6% decline in its distributable income to unitholders for FY2020 was due to rental rebates given out to tenants who have seen their operations affected by the Covid-19 pandemic in the first quarter, as well as the retention of distributable income.
Portfolio Occupancy Profile
Moving on, let us take a look at the REIT’s portfolio occupancy profile recorded over the last 4 financial years (i.e. between FY2017 and FY2020):
| FY2017 | FY2018 | FY2019 | FY2020 | |
| Portfolio Occupancy (%) | 100.0% | 99.2% | 100.0% | 99.3% |
| Portfolio WALE (by Gross Rental Income – years) | 3.0 years | 2.0 years | 4.1 years | 3.4 years |
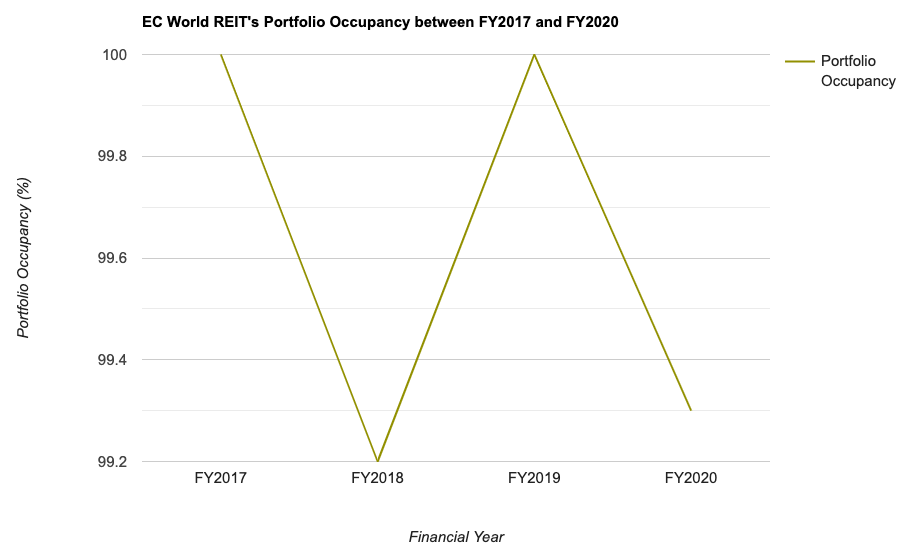
My Observations: Throughout the entire 4 year period, its portfolio occupancy has remained very resilient – where it has been either at 100.0%, or very close to it.
Debt Profile
Apart from a REIT’s financial performance and portfolio occupancy, another area I look at is its debt profile – where my preference is towards REITs that are able to maintain a relatively low aggregate leverage and at the same time, having a high interest coverage ratio (from FY2022, for REITs with an interest coverage of more than 2.5x, the aggregate leverage limit will be at 50.0%, while for the others, the limit will be at 45.0%.)
With that, let us take a look at EC World REIT’s debt profile recorded over the past 4 years in the table below:
| FY2017 | FY2018 | FY2019 | FY2020 | |
| Aggregate Leverage (%) | 29.2% | 31.5% | 38.7% | 38.1% |
| Average Cost of Debt (%) | 5.3% | 4.3% | 4.5% | 4.3% |
My Observations: Based on its interest coverage of 2.62x for FY2020, in FY2022, the REIT’s aggregate leverage limit cannot exceed 45.0% – and at 38.1%, in my opinion, it is pretty close (I prefer REITs that are able to maintain its aggregate leverage at 35.0% and below if the limit is at 45.0%.) Also, its interest coverage ratio in my opinion is a bit on the low end (my preference is those that are able to maintain its interest coverage at 5.0x and above.)
Distribution Payout to Unitholders
The REIT is one of the few that have maintained a quarterly distribution payout (as such, for those who would like to invest in REITs that declares a distribution payout once every 3 months, this is one you may want to consider.)
Over the past 4 years, its distribution payout to unitholders is as follows:
| FY2017 | FY2018 | FY2019 | FY2020 | |
| Distribution Per Unit (S$/cents) | 6.025 cents | 6.179 cents | 6.047 cents | 5.359 cents |
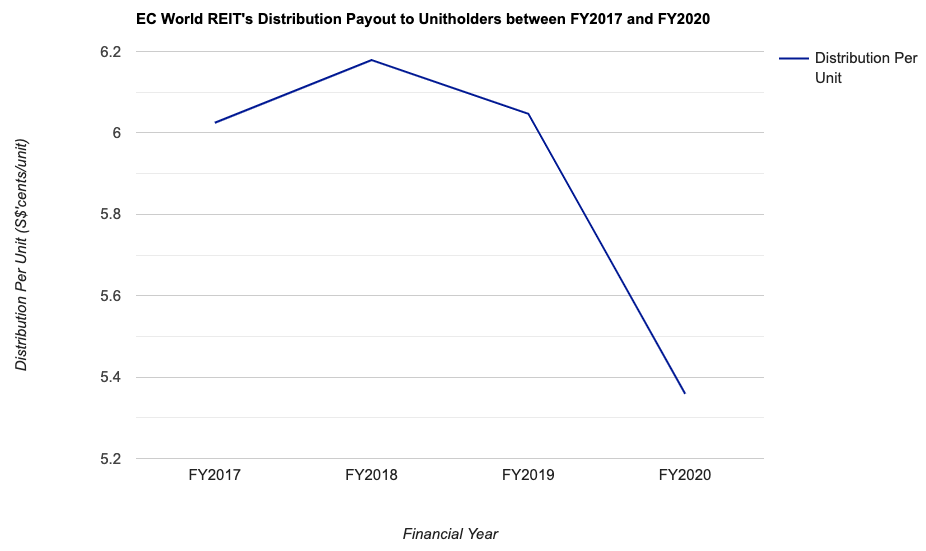
The decline in distribution payouts for the most recent 2 years (i.e. in FY2019 and in FY2020) are explained above in the section where I reviewed the REIT’s financial performance.
Closing Thoughts
A stable performance in its financial results over the years since post-IPO, along with a resilient portfolio occupancy (where at the time of writing, all but one of its properties are fully occupied), as well as the fact that the REIT pays out a distribution once every quarter (my preference is towards companies that are able to pay out a dividend on a quarterly basis) are reasons why I’ve made the investment decision last year.
Another thing I like about the REIT is that, despite not mandated to report its full financial results on a quarterly basis, it has continued to do so – and this allows me to have a much better understanding about its performance.
The only thing that may not be so ideal with the REIT is its debt profile – where it was at 38.1% as at 31 December 2021. However, in the third quarter of the current financial year 2021, it has improved slightly to 37.9%.
Finally, as far as the REIT’s dividend payouts are concerned, perhaps many would like to know if the decline has continued in the current financial year – with regard to that, I’m happy to report that its distribution payout have risen by 20.2% compared to the same time period last year – from 3.932 cents/unit in 9M FY2020 to 4.726 cents/unit in 9M FY2021 – which can be attributed to the absence of rental rebates given in the first quarter of FY2020, and also the payout of distribution previously retained in Q4 FY2019, Q1 FY2020, and Q2 FY2020 (partial) in Q2 FY2021.
Moving forward, my opinion is that there may not be any news about new property acquisitions (considering the fact that the Sponsor may be looking to take the REIT private – as to when it will happen, we can only wait and see.) Any improvements in terms of its financial performance in the year ahead will mainly be from the organic rental escalations of the existing leases.
With that, I have come to the end of my look back at the past year performance of EC World REIT. I hope you’ve found the information presented in this post useful, and as always, do note that this post does not represent any buy or sell recommendation for the REIT’s units. You should always do your own due diligence before you make any investment decisions.
Disclaimer: At the time of writing, I am a unitholder of EC World REIT.
Are You Worried about Not Having Enough Money for Retirement?
You're not alone. According to the OCBC Financial Wellness Index, only 62% of people in their 20s and 56% of people in their 30s are confident that they will have enough money to retire.
But there is still time to take action. One way to ensure that you have a comfortable retirement is to invest in real estate investment trusts (REITs).
In 'Building Your REIT-irement Portfolio' which I've authored, you will learn everything you need to know to build a successful REIT investment portfolio, including a list of 9 things to look at to determine whether a REIT is worthy of your investment, 1 simple method to help you maximise your returns from your REIT investment, 4 signs of 'red flags' to look out for and what you can do as a shareholder, and more!

You can find out more about the book, and grab your copy (ebook or physical book) here...


Comments (0)