I’d like to start off today’s post with the following quote:
“Be patient. Everything comes to you in the right moment.”
I’ve applied exactly just that, where I waited patiently for the unit price of Keppel DC REIT (SGX:AJBU) to come down to $2.32 prior to adding it to my long-term investment portfolio – based on this invested price, and also the distribution of 9.17 cents/unit, it represents a yield of 4.0% (which fulfils my requirement when it comes to investing in companies.)
And in case you’re wondering how long have I waited for the price to come down to this level – the answer is more than a year. While waiting for my preferred price to come my way, I’ve been monitoring the REIT’s latest developments to make sure that their business fundamentals continue to remain sound.
What I’m going to do in this post is to share with you all the researches I’ve done about the REIT – particularly its business operations, historical financial performance, portfolio and debt profile, along with its distribution payout to unitholders over the years, as well as for the first half of the current financial year 2021, along with reasons why I’ve made this investment decision.
Keppel DC REIT’s Business Operations
Keppel DC REIT is a pure-play data centre REIT – at the time of writing this post, it has a total of 19 data centres located in 8 geographical locations (you can click on the respective links to read more about the individual data centres):
- 6 in Singapore (in Keppel DC Singapore 1, Keppel DC Singapore 2, Keppel DC Singapore 3, Keppel DC Singapore 4, Keppel DC Singapore 5, as well as DC1)
- 3 in Australia (in Intellicentre Campus [its development was recently completed on 13 July 2021], iseek Data Centre [which have been divested according to an announcement dated 27 August 2021, and you can read about it here], and Gore Hill Data Centre)
- 1 in Malaysia (in Basis Bay Data Centre)
- 2 in Germany (in Kelsterbach Data Centre, and manicures Data Centre)
- 2 in Ireland (in Keppel DC Dublin 1, and Keppel DC Dublin 2)
- 1 in Italy (in Milan Data Centre)
- 3 in The Netherlands (in Amsterdam Data Centre, Almere Data Centre, and Eindhoven Campus [a recently acquired property in an announcement on 06 September 2021, and you can read more about it here])
- 2 in The United Kingdom (in Cardiff Data Centre, and GV7 Data Centre)
Additionally, along with the REIT’s half-yearly results release on 26 July 2021, it has also announced its first foray into another new geographical location in China with its acquisition of Guangdong Data Centre in Jiangmen, Guangdong Provice, which will allow them to tap into China’s growing digital economy – you can read about the acquisition in a Business Times article here.
Keppel DC REIT’s Historical Financial Performance (between FY2015 and FY2020)
As Keppel DC REIT was listed on the Singapore Exchange on 12 December 2014, in this section, you’ll find its full-year results between FY2015 and FY2020:
| FY2015 | FY2016 | FY2017 | FY2018 | |
| Gross Revenue (S$’mil) | $102.5m | $99.1m | $139.1m | $175.5m |
| Property Operating Expenses (S$’mil) | $15.6m | $8.2m | $13.9m | $17.9m |
| Net Property Income (S$’mil) | $86.7m | $90.9m | $125.1m | $157.7m |
| Distributable Income to Unitholders (S$’mil) | $57.4m | $61.0m | $82.3m | $96.1m |
| FY2019 | FY2020 | |||
| Gross Revenue (S$’mil) | $194.8m | $265.6m | ||
| Property Operating Expenses (S$’mil) | $17.5m | $21.4m | ||
| Net Property Income (S$’mil) | $177.3m | $244.2m | ||
| Distributable Income to Unitholders (S$’mil) | $113.2m | $156.9m |

In my personal opinion, the data centre REIT’s financial figures for the full-year since its listing have been pretty impressive – its gross revenue saw year-on-year (y-o-y) improvements in 5 out of 6 years I have studied (and it recorded a compound annual growth rate, or CAGR, of 17%), while its net property income and distributable income to unitholders saw growth in all of the 6 years (with the former recording a CAGR of 19% and the latter recording a CAGR of 18%.)
Its growing financial performance over the years is one of the reasons for my investment decision.
Keppel DC REIT’s Historical Portfolio Occupancy Profile (between FY2015 and FY2020)
Moving on, let us take a look at Keppel DC REIT’s portfolio occupancy profile recorded between FY2015 and FY2020:
| FY2015 | FY2016 | FY2017 | FY2018 | |
| Portfolio Occupancy (%) | 94.8% | 94.4% | 92.6% | 93.1% |
| Portfolio WALE (years) | 8.7 years | 9.6 years | 9.1 years | 8.3 years |
| FY2019 | FY2020 | |||
| Portfolio Occupancy (%) | 94.9% | 97.8% | ||
| Portfolio WALE (years) | 8.6 years | 6.8 years |

Another thing I like about the blue-chip REIT’s portfolio occupancy profile is that the occupancy rate of its data centre properties have been maintained at over 90.0% in all of the 6 years I have looked at, along with a long portfolio weighted average lease expiry as well – what this means is that income coming in from the tenants is stable (unlike the portfolio weight average lease expiry of retail REITs where they are much shorter and as such, the income received may be more volatile, because depending on many factors, if the overall environment is unfavourable to lease renewal, new and/or expiring leases may be signed at lower leases, and it will affect the REIT’s revenue ahead.)
Keppel DC REIT’s Historical Debt Profile (between FY2015 and FY2020)
One of the requirements I have when it comes to reviewing a REIT’s debt profile is that, it should have a good debt headroom before it reaches its regulatory limit (currently at 50.0%) – as this will allow it to be able to make yield-accretive acquisitions as and when an opportunity to do so becomes available.
With that, let us take a look at Keppel DC REIT’s debt profile over the years (between FY2015 and FY2020):
| FY2015 | FY2016 | FY2017 | FY2018 | |
| Aggregate Leverage (%) | 29.2% | 28.3% | 32.1% | 30.8% |
| Interest Coverage Ratio (times) | 9.4x | 9.4x | 9.7x | 11.4x |
| Average Term to Debt Maturity (years) | 3.3 years | 3.2 years | 3.8 years | 3.0 years |
| Average Cost of Debt (%) | 2.5% | 2.3% | 2.2% | 1.9% |
| FY2019 | FY2020 | |||
| Aggregate Leverage (%) | 30.7% | 36.2% | ||
| Interest Coverage Ratio (times) | 13.3x | 13.3x | ||
| Average Term to Debt Maturity (years) | 3.9 years | 3.2 years | ||
| Average Cost of Debt (%) | 1.7% | 1.6% |
There are several things I like about its debt profile:
- In terms of its aggregate leverage, it has consistently been maintained at below 35.0% – except in the latest financial year, FY2020, where it is at 36.2%. Even so, there still remain a very good debt headroom before the REIT’s aggregate leverage reaches the regulatory limit of 50.0%.
- Interest coverage ratio, which in layman terms is about the REIT’s ability to fulfil its short-term debt obligations is also high (personally, anything above 5.0x is considered ideal, and the REIT’s interest coverage ratio recorded over the years more than fulfil this criteria of mine.)
- Finally, it’s also encouraging to note that over the years, its average cost of debt over the years is on a downward moving trend.
Keppel DC REIT’s Distribution Per Unit to Unitholders (between FY2015 and FY2020)
Keppel DC REIT declares a distribution payout to its unitholders on a half-yearly basis (except for in FY2019, where a quarterly payout was declared) – once when they release its second quarter results, and once when they release its fourth quarter results.
Over the years, its distribution payout to its unitholders is as follows:
| FY2015 | FY2016 | FY2017 | FY2018 | |
| Distribution Per Unit (S$’cents) | 6.84 cents | 6.14 cents | 7.12 cents | 7.32 cents |
| FY2019 | FY2020 | |||
| Distribution Per Unit (S$’cents) | 7.61 cents | 9.17 cents |
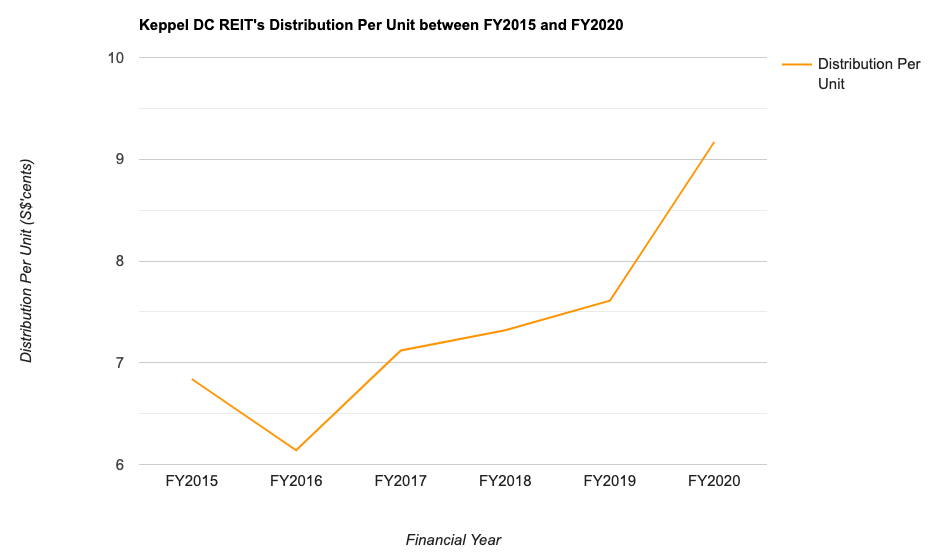
Apart from in FY2016, where its distribution payout dipped slightly, all the remaining 5 years saw its distribution recording a y-o-y improvement – and growing at a CAGR of 5.01%.
Keppel DC REIT’s 1H FY2021 Results
At the time of writing, the latest set of results released by the data centre REIT is for the second quarter, as well as for the first half of the financial year 2021 ended 30 June 2021 (you’ll find my review of the REIT’s latest set of results as and when they are made available in the future.)
The following table are some of the key statistics to take note of, compared against the same time period last year (i.e. 1H FY2020 ended 30 June 2020):
| 1H FY2020 | 1H FY2021 | % Variance | |
| Gross Revenue (S$’mil) | $124.0m | $135.1m | +9.0% |
| Property Operating Expenses (S$’mil) | $9.7m | $11.3m | +16.2% |
| Net Property Income (S$’mil) | $114.2m | $123.8m | +8.4% |
| Distributable Income to Unitholders (S$’mil) | $75.0m | $84.3m | +12.4% |
| Portfolio Occupancy (%) | 96.1% | 98.0% | – |
| Portfolio WALE (years) | 7.4 years | 6.5 years | – |
| Aggregate Leverage (%) | 34.5% | 36.7% | – |
| Interest Coverage Ratio (times) | 12.8x | 12.9x | – |
| Average Term to Debt Maturity (years) | 3.7 years | 2.8 years | – |
| Average Cost of Debt (%) | 1.7% | 1.5% | – |
| Distribution Per Unit (S$’cents) | 4.375 cents | 4.924 cents | +12.5% |
Financial Performance:
- The 9.0% y-o-y growth in its gross revenue can be attributed to the full period contribution from Kelsterbach DC, the acquisition of Amsterdam DC, as well as additional income attained after the asset enhancement initiatives in its Singapore and Ireland assets.
- Property operating expenses, as a result of higher property-related expenses incurred at Keppel DC Dublin 1, and at Gore Hill Data Centre, increased by 16.2% compared to the same time period last year.
Portfolio Occupancy Profile:
- In my opinion, it was a mixed bag here, as the improvements in its portfolio occupancy rate was offset by a decline in its portfolio WALE (but despite of that, it is still considered very good in my opinion.)
Debt Profile:
- On the whole, apart from a slight increase in its aggregate leverage and a dip in the average term to debt maturity, its interest coverage ratio and average cost of debt remained stable.
Closing Thoughts
A growing financial performance over the years, along with a resilient portfolio occupancy profile and a stable debt profile are reasons why the data centre REIT caught my investment eye. The same can also be said about its improving distribution payout over the years.
Looking forward, I’m positive about Keppel DC REIT’s ability to make further yield-accretive acquisitions (as it has plenty of debt headroom to do so), and also in my opinion – data centre businesses are stable in terms of income, as in my opinion, its very unlikely for companies to want to migrate their data once they have settled in (as it’s quite cumbersome to do so.)
With that, I have come to the end of today’s share on reasons why I have made the investment decision on the blue-chip Keppel DC REIT. I hope you’ve found the contents above useful. For those of you who are new to this site and would like to know the companies I have in my long-term portfolio, you can check them out here. Finally, please note that this post is by no means a buy or sell call for the REIT’s units – you should always do your own due diligence before you make any investment decisions.
Disclaimer: At the time of writing, I am a unitholder of Keppel DC REIT.
Are You Worried about Not Having Enough Money for Retirement?
You're not alone. According to the OCBC Financial Wellness Index, only 62% of people in their 20s and 56% of people in their 30s are confident that they will have enough money to retire.
But there is still time to take action. One way to ensure that you have a comfortable retirement is to invest in real estate investment trusts (REITs).
In 'Building Your REIT-irement Portfolio' which I've authored, you will learn everything you need to know to build a successful REIT investment portfolio, including a list of 9 things to look at to determine whether a REIT is worthy of your investment, 1 simple method to help you maximise your returns from your REIT investment, 4 signs of 'red flags' to look out for and what you can do as a shareholder, and more!

You can find out more about the book, and grab your copy (ebook or physical book) here...


Comments (7)