Hulk Hogan, The Ultimate Warrior, The Undertaker – I’m sure you would have heard of these names before, even if you don’t watch wrestling. I can still remember following them back in the 90s when Singapore’s local TV was still airing their shows every Saturday (back then it was known as WWF, or World Wrestling Federation), and even bought VCDs of their special events like Wrestlemania and Royal Rumble.
So, the US-listed World Wrestling Entertainment Inc. (NYSE:WWE) needs no further introduction – they have been involved in the sports entertainment business for over 4 decades and are currently one of the most popular brands in the global entertainment industry.
In today’s post about the sports entertainment company, you’ll read about the company’s business operations, and how it generates its revenue, its financial performance, debt profile, and dividend payouts between FY2015 and FY2020, its current year performance so far (compared against the same time period last year), and finally, my outlook for the company ahead.
Let’s begin…
World Wrestling Entertainment’s Business Operations
World Wrestling Entertainment’s (or WWE in short) business operations can be centred around 3 business segments:
(i) Media – which comprises of WWE Network, broadcast and pay TV, digital and social media, as well as filmed entertainment. Revenues from this business segment comes from contents rights fee, subscriptions to the WWE Network, as well as from advertising and sponsorships. This business segment is also the largest contributor towards the company’s total revenue at 89% in FY2020;
(ii) Live Events – some examples include their Monday Night Raw, Friday Night Smackdown, Wrestlemania, Royal Rumble, etc., with revenue coming from ticket sales, along with sale of travel packages associated with the company’s global live events;
(iii) Consumer Products – Revenue from this business segment comes from WWE-branded products such as video games, toys and apparel, through licensing agreements and direct-to-consumer sales, as well as from royalties and license fees related to WWE-branded products.
Financial Performance between FY2015 and FY2020
To begin, the company has a financial year ending every 31 December. And in this section, let us take a look at WWE’s financial performance between FY2015 and FY2020 (a period of 6 financial years):
Total Revenue & Net Profit (USD’mil):
| FY2015 | FY2016 | FY2017 | FY2018 | FY2019 | |
| Total Revenue (USD’mil) | $659m | $729m | $801m | $930m | $960m |
| Net Profit (USD’mil) | $24m | $34m | $33m | $100m | $77m |
| FY2020 | |||||
| Total Revenue (USD’mil) | $974m | ||||
| Net Profit (USD’mil) | $132m |
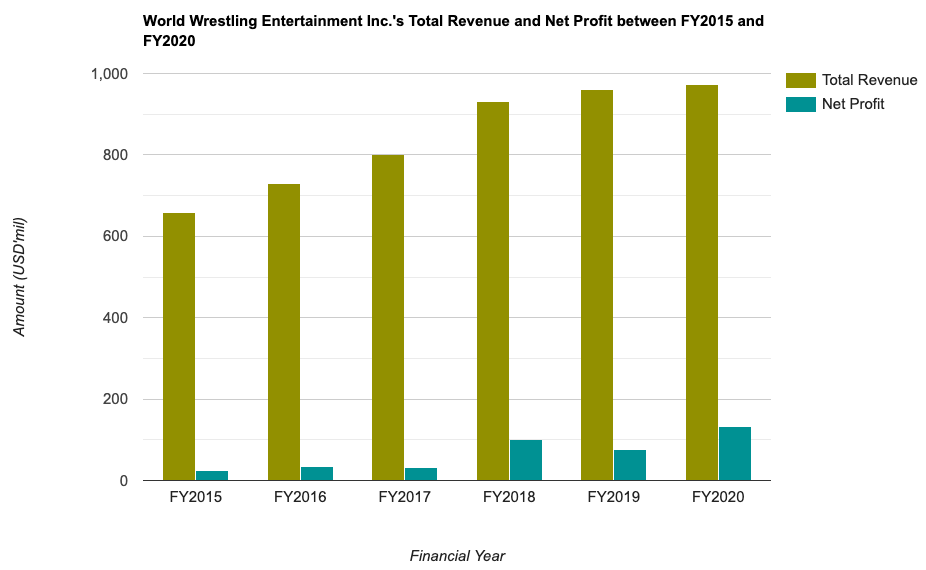
WWE’s total revenue went up from $659m in FY2015 to $974m in FY2020, with improvements recorded every single year – in a span of 6 years, its total revenue grew at a compound annual growth rate (CAGR) of 6.7%.
Net profit, on the other hand, saw year-on-year (y-o-y) growth in 4 out of 6 years – the 2 years which saw its net profit decline were in FY2017 (due to a one-time charge totalling $11.3m that arose from the enactment of the new tax law – excluding the impact of these charges, net profit would have increased to $43.9m), as well as in FY2019 (due to the impact of the finance lease related to the company’s new HQ, as well as higher effective tax rate for the year.) Over a period of 6 years, its net profit grew at a CAGR or 32.9%.
Net Profit Margin (%):
The following is the company’s net profit margin which I have computed:
| FY2015 | FY2016 | FY2017 | FY2018 | FY2019 | |
| Net Profit Margin (%) | 3.6% | 4.7% | 4.1% | 10.8% | 8.0% |
| FY2020 | |||||
| Net Profit Margin (%) | 13.6% |
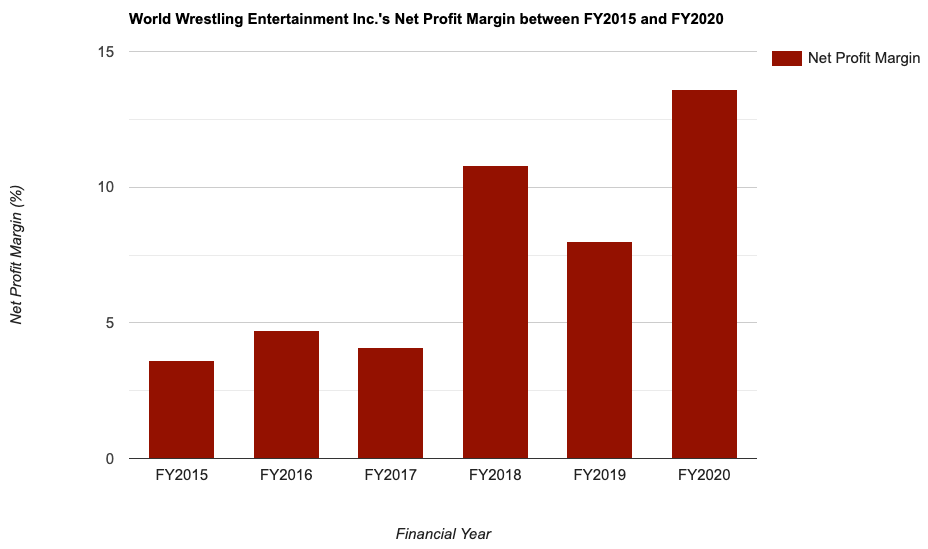
In-line with a y-o-y decline in its net profit in FY2017 and FY2019, its net profit margin also fell.
Return on Equity (%):
In layman terms, Return on Equity (or RoE) is a measure of profitability (in percentage terms) the company is able to generate for every dollar of shareholders’ money it uses in its business/es.
The table below is WWE’s RoE which I’ve computed over the past 6 financial years:
| FY2015 | FY2016 | FY2017 | FY2018 | FY2019 | |
| Return on Equity (%) | 11.5% | 14.2% | 13.0% | 31.6% | 28.0% |
| FY2020 | |||||
| Return on Equity (%) | 33.9% |

In-line with a decline in its net profit in FY2017 and FY2019, its RoE also fell for those year. Apart from that, all the other 4 years saw this financial ratio recording an improvement on a y-o-y basis – where it improved from a mere 11.5% in FY2015 to a high of 33.9% in FY2020 (which coincidentally is also the highest in the 6 years I have looked at.)
Debt Profile between FY2015 and FY2020
Apart from a company’s financial performance, another area I focus my attention on is its debt profile – where my preference is towards companies with minimal or no debt (the latter preferred), as well as one that’s in a net cash position.
The following table is WWE’s debt profile between FY2015 and FY2020:
| FY2015 | FY2016 | FY2017 | FY2018 | FY2019 | |
| Cash & Cash Equivalent (USD’mil) | $38m | $212m | $138m | $167m | $90m |
| Total Borrowings (USD’mil) | $21m | $42m | $36m | $31m | $26m |
| Net Cash/ Debt (USD’mil) | +$170m | +$102m | +$136m | +$64m | +$340m |
| Free Cash Flow/Share (USD/share) | $0.94 | $0.83 | $1.69 | $3.55 | $1.15 |
| FY2020 | |||||
| Cash & Cash Equivalent (USD’mil) | $462m | ||||
| Total Borrowings (USD’mil) | $122m | ||||
| Net Cash/ Debt (USD’mil) | +$40m | ||||
| Free Cash Flow/Share (USD/share) | $6.25 |
Apart from in the most recent financial year 2020 where its total borrowings spiked up, all the other years saw the company having minimal borrowings. The company is also in a net cash position in the 6 years I have looked at. Also, apart from in FY2019, its free cash flow have also improved for the remaining 5 financial years – which is good to note as well.
Dividend Payout to Shareholders between FY2015 and FY2020
The management of WWE pays out a dividend to its shareholders on a quarterly basis.
With that, let us take a look at its dividend payout to its shareholders over the last 6 years, along with its payout ratio which I’ve computed:
| FY2015 | FY2016 | FY2017 | FY2018 | FY2019 | |
| Dividend Per Share (USD’cents) | 48.0 cents | 48.0 cents | 48.0 cents | 48.0 cents | 48.0 cents |
| Dividend Payout Ratio (%) | 150.0% | 109.1% | 114.3% | 42.9% | 56.5% |
| FY2020 | |||||
| Dividend Per Share (USD’cents) | 48.0 cents | ||||
| Dividend Payout Ratio (%) | 30.8% |

While its revenue and net profit have grown over the years, its dividend payout have not – it remained at 48.0 cents in all of the 6 years I have looked at.
Comparison of WWE’s 1H FY2020 Results vs. its 1H FY2021 Results
WWE have reported its results for the first half of the financial year 2021 on 29 July 2021. In this section, let us take a look at how its results fared when compared against the same time period last year (i.e. 1H FY2020):
| 1H FY2020 | 1H FY2021 | % Variance | |
| Total Revenue (USD’mil) | $514m | $530m | +3.1% |
| Net Profit (USD’mil) | $70m | $73m | +4.3% |
| Net Profit Margin (%) | 13.6% | 13.8% | +0.2pp |
| Cash & Cash Equivalent (USD’mil) | $425m | $323m | -24.0% |
| Total Borrowings (USD’mil) | $223m | $21m | -90.6% |
| Net Cash/ Debt (USD’mil) | +$202m | +$302m | +49.5% |
| Dividend Per Share (USD’cents) | 24.0 cents | 24.0 cents | – |
On the whole, the company’s latest set of financial results compared against last year was a better one – in terms of its financial performance (helped by an improvement in revenue in its media business, offset by weakness from its live events business due to the ongoing pandemic where international events were cancelled), as well as in its debt profile (where a huge fall in its total borrowings saw the company’s net cash position improving significantly.)
The only slight negative is that its cash and cash equivalent suffered a dip compared to last year, along with its dividend payout remaining the same as last year (where it paid out 12.0 cents in the first, as well as in the second quarters of FY2019 and FY2020.)
Closing Thoughts
What I like about WWE is its simple-to-understand business, its growing financial performance, and also the fact that the company is in a net cash position in all of the 6 years I have studied. On the other hand, for those of you who would prefer companies that are able to increase its dividend payout to shareholders over the years may not find this company ideal (as its dividend payout have remained stagnant at 48.0 cents/share over the years.)
Looking ahead, I am of the opinion that its media segment (which contributes a lion’s share towards the company’s overall revenue) should continue to remain stable. However, due to the ongoing pandemic, its live events business may be affected in the near- to mid-term due to border restrictions, along with a caps on the number of audiences allowed in live events currently (which differs from country to country). As to when the contribution from its live events business could return to pre-Covid levels, it will very much depend on the speed at which the virus is being contained, and also when border restrictions (as well as that surrounding the holding of live events) are being relaxed.
With that, I have come to the end of my review of World Wrestling Entertainment Inc. I hope you’ve found the contents above useful, and before I end, a gentle reminder that everything that you’ve just read above are purely for educational purposes only. Please do your own due diligence before you engage in any investment decisions.
Disclaimer: At the time of writing, I am not a shareholder of World Wrestling Entertainment Inc.
Stop Spending Hours Reading REIT Reports Every Quarter!
What if you could assess a REIT's portfolio occupancy, debt profile, valuation, and overall health in less than 30 seconds - without having to comb through a single quarterly report?
That's the problem the REIT Screener was built to solve.
Developed through a collaboration between ShareInvestor and The Singaporean Investor, the REIT Screener consolidates many of the key metrics and indicators I personally use when analysing REITs into one easy-to-use platform. Instead of spending hours extracting data manually every earnings season, you can now monitor the REITs you own and research new opportunities in just a few clicks.
If you're serious about REIT investing but don't have the time to manually track quarterly developments, the REIT Screener could be the shortcut you've been looking for:

Take a closer look at the REIT Screener here...


Comments (0)