The US indexes (namely the S&P 500, the Dow Jones Industrial Average, as well as the NASDAQ) have been hitting new highs recently (and in the trading community, there are discussions that a correction may be coming right up).
Hong Kong’s benchmark Hang Seng Index (or HSI), meanwhile, have gone on a downward slide since last Monday – where it fell from a high of 29,394 points to a low of 27,153 points when the stock market closed yesterday (08 July 2021) – a drop by 2.89% in a single trading session.
Singapore’s Straits Times Index (or STI), after climbing to a high of 3,195 points on Tuesday (06 July 2021), retreated, and currently, it is nearing where the 200-day moving average (on a weekly timeframe) is at 3,100 points.
Question: How could the indexes potentially move in the near-term? In today’s post, I’m going to share my technical analysis of the 3 US indexes, the HSI, as well as the STI, based on their close yesterday (08 July 2021).
Before I begin, here’s the list of technical indicators that I am using to analyse the indexes:
- 20-day (dark green line), 50-day (light green line), 100-day (orange line), 150-day (yellow line), and also 200-day (red line) moving averages on a weekly timeframe
- Moving Average Convergence Divergence (MACD) on a daily timeframe
- Stochastic on a daily timeframe
Let’s begin:
1. S&P 500 Index
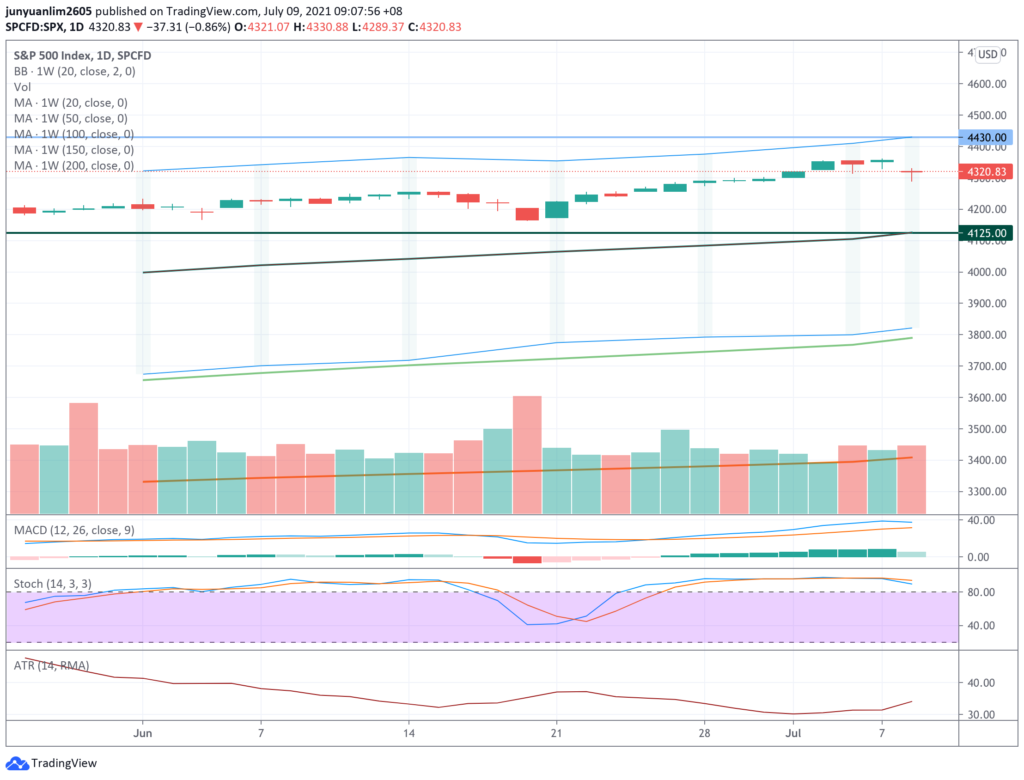
The S&P 500 index went on a bullish ascend since 21 June 2021, where it climb from a low of 4,173 points to a high of 4,361 points the day before (07 July 2021) – which is also the index’s current 52-week high, before declining by 37 points (or by 0.86%) at 4,320 points when the market closed yesterday (08 July 2021.)
Looking at the technical indicators MACD as well as stochastic, the former looks like it is about to reverse into a downtrend, while the latter have already reversed into a downtrend position from an overbought level – and this suggests that in the near-term, it is likely that the index is likely to trend lower. If it does indeed go downward, then it could possibly move towards where the 20-day moving average is at 4,125 points.
On the flip side, should the index were to continue its upward ascend, then it could possibly head towards where the upper band of the Bollinger Band is, at 4,430 points.
2. Dow Jones Industrial Average Index
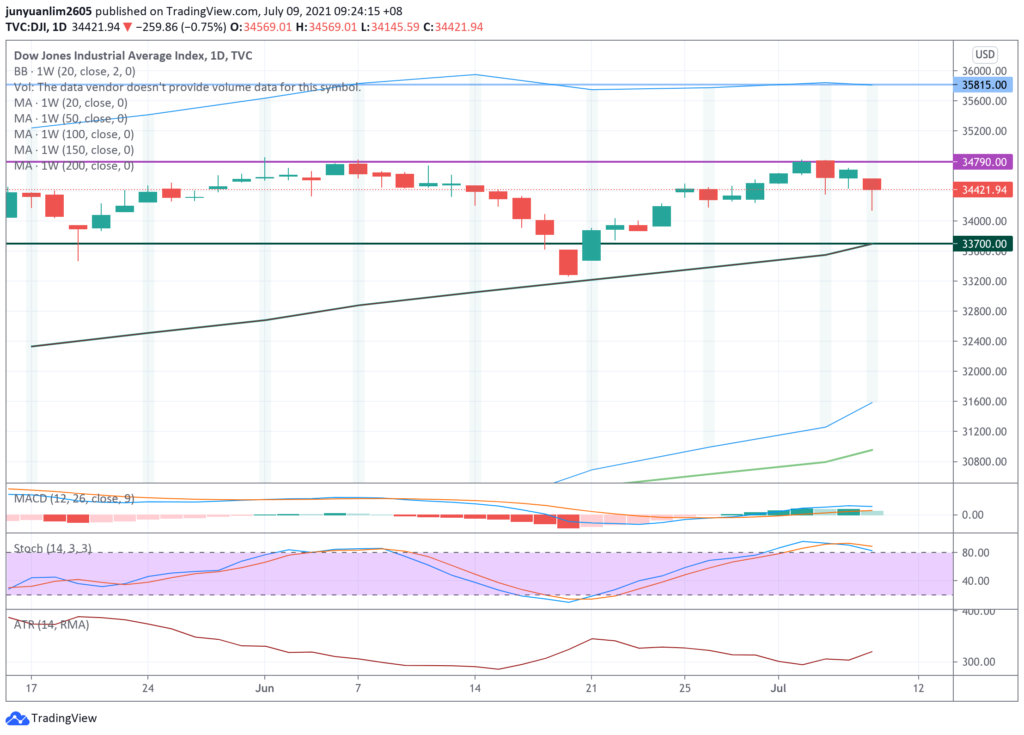
Moving on, let us take a look at another US index – the Dow Jones Industrial Average Index – similar to how the S&P 500 index moved, it started its upward movement since 21 June 2021, where it climbed from a low of 33,480 points then to a high of 34,821 points on 02 July 2021 – even though it did not form a new 52-week high (the index’s current 52-week high is at 35,091 points.) It subsequently fell a little over the next few days, and when the market closed last night (08 July 2021), the index was at 34,421 points.
The 2 technical indicators (MACD as well as stochastic) also similar to that of the S&P 500 index we’ve seen earlier – where the MACD looks like its about to reverse into a downtrend position, while the stochastic have already crossed into a downtrend position in an overbought level (a sign which suggests that the index is likely trend down in the near-term.)
In the near-term, if the index were to continue its bearish movement, it could possibly head towards where the 20-day moving average is, at 33,700 points. On the other hand, if the index were to turn bullish once again, then the next resistance lines could be found at 34,790 (where the purple line is), and at 35,815 points (in light blue where the upper band of the Bollinger Band is.)
3. NASDAQ Index

Since touching the 20-day moving average on 03 June 2021, the NASDAQ index subsequently started its upward climb, where it went up to a high of 14,755 points the day before (on 07 July 2021) – a new 52-week high for the index. The index then fell by 105 points (or 0.72%) last night (08 July 2021) to close at 14,559 points.
Stochastic have reversed into a downtrend position from an overbought level – suggesting that in the near-term, the index could trend lower. While the MACD is still in an uptrend position, but it looks like it is about to cross down into a downtrend.
In the coming days ahead, here’s how I think the index may possibly move, both in the bullish, as well as in the bearish scenario – first the bearish, where the index could once again re-visit the 20-day moving average level at 13,750 points before recovering from there; however, if the index were to resume its upward climb, then it could possibly revisit the resistance line (where the upper band of the Bollinger Band is) at 14,685 points, or even retest the current 52-week high and attempt to create another new high.
4. Hang Seng Index

Since reaching a high of 29,394 points in late-June (28 June 2021), Hong Kong’s Hang Seng Index declined for 7 consecutive days – and in the process breaking under a couple of support lines – namely the 20-day moving average (at 28,700 points), the 200-day moving average (at 27,570 points), and it also fell out of the lower band of the Bollinger Band at 27,765 points.
When the Hong Kong market closed yesterday (08 July 2021), it fell slightly under the 50-day moving average support line (at 27,145 points.)
In terms of the technical indicators, MACD is entrenched in a downtrend position. The stochastic is also way into ‘oversold’ territory, and also in a downtrend position. However, it seems like the technical indicator is showing signs of a positive crossover soon – indicating that we could see some form of recovery in the coming days.
If a recovery does indeed happen, then the index could potentially head up to where the 200-day moving average is (at 27,570 points). If it can break past this resistance line, then the next one will be at where the lower band of the Bollinger Band is, at 27,865 points.
On the other hand, should the downward movement were to continue, then the Hang Seng Index could be heading down to where the 150-day moving average is, at 26,865 points. If this support line is broken, then the index could be headed to where the 100-day moving average is, at 26,525 points.
5. Straits Times Index

As I’ve mentioned in the introductory paragraph, after hitting a high of 3,195 points on Tuesday (06 July 2021), it has retreated in the subsequent days. The Straits Times Index closed at 3,111 points yesterday (down by 30 points, or 0.97% compared to the previous day.)
Right now, it is nearing where the 200-day moving average is, at 3,100 points – in fact, during the day, as you can see from the chart above, it actually touched this support line and bounced back up. Looking at the technical indicators, MACD looks like its about to reverse into a downtrend, while stochastic have just turned into a downtrend as well – both of which suggests that it is likely that the 200-day moving average support line at 3,100 points may be broken, and the index head down towards where the 150-day moving average, and the lower band of the Bollinger Band are, at around 3,000 points.
However, in a bullish scenario, should the index were to recover, then a resistance could be found at where the 20-day moving average is, at 3,135 points.
In Conclusion
That concludes my personal technical analysis on the movements of the indexes of US, Hong Kong, and Singapore for sharing. Along with my analysis, I have also identified some of the possible support and resistance lines which the indexes could be headed to in the near-term, all of which I hope you find useful.
Stop Spending Hours Reading REIT Reports Every Quarter!
What if you could assess a REIT's portfolio occupancy, debt profile, valuation, and overall health in less than 30 seconds - without having to comb through a single quarterly report?
That's the problem the REIT Screener was built to solve.
Developed through a collaboration between ShareInvestor and The Singaporean Investor, the REIT Screener consolidates many of the key metrics and indicators I personally use when analysing REITs into one easy-to-use platform. Instead of spending hours extracting data manually every earnings season, you can now monitor the REITs you own and research new opportunities in just a few clicks.
If you're serious about REIT investing but don't have the time to manually track quarterly developments, the REIT Screener could be the shortcut you've been looking for:

Take a closer look at the REIT Screener here...


Comments (0)