Its understandable that this is the first time you may have heard about this US-listed company (the same for me as well when I first came across it), but simply by looking at the company name, you should be able to more or less guess that company’s businesses – that’s right, Pool Corporation (NASDAQ:POOL), also known as POOLCORP, is the world’s largest wholesale distributor of swimming pool supplies, equipment, and related leisure products. Apart from this, the company is also in the business of irrigation (the artificial process of applying controlled amounts of water to assist in the production of crops) and landscape products in the United States of America (also not forgetting to mention that it is also one of the leading distributors.)

POOLCORP’s customers include swimming pool modellers and builders, as well as swimming pool repair and service businesses, specialty retailers selling swimming pool supplies (for its swimming pool-related products), along with contractors in the irrigation construction and landscape maintenance industries (for its irrigation and landscape products.)
The company’s sales centres are located across North America (US, Canada and Mexico), Europe (France, UK, Spain, Portugal, Italy, Belgium, Germany, and Croatia), as well as in Australia.
One of the reasons the company caught my investment radar (and have continued with my research about it) was because I found the business operations (which I have explained above) easy to understand (I hope you find it likewise as well.) Apart from that, some of the key financial statistics which I have looked at when I study about individual companies satisfies my criteria for company selection too, all of which you will find in the next few sections in today’s post:
Financial Performance (between FY2015 and FY2020)
POOLCORP has a financial year-end every 31 December, and in this section, you will find its financial performance recorded over the past 6 financial years – between FY2015 and FY2020:
Total Revenue and Net Profit (US$’mil):
| FY2015 | FY2016 | FY2017 | FY2018 | FY2019 | |
| Total Revenue (US$’mil) | $2,363m | $2,571m | $2,788m | $2,998m | $3,200m |
| Net Profit (US$’mil) | $128m | $149m | $192m | $234m | $262m |
| FY2020 | |||||
| Total Revenue (US$’mil) | $3,937m | ||||
| Net Profit (US$’mil) | $367m |

As you can see from the table and chart above, both the company’s total revenue and net profit saw year-on-year (y-o-y) improvements every single year over the past 6 years – with its total revenue growing at a compound annual growth rate (CAGR) of 8.9%, while its net profit improving at a CAGR of 19.2% – both of them very impressive in my personal opinion.
Gross and Net Profit Margin (%):
The following table is the company’s gross and net profit margins I have computed:
| FY2015 | FY2016 | FY2017 | FY2018 | FY2019 | |
| Gross Profit Margin (%) | 28.6% | 28.8% | 28.9% | 29.0% | 28.9% |
| Net Profit Margin (%) | 5.4% | 5.7% | 6.9% | 7.8% | 8.2% |
| FY2020 | |||||
| Gross Profit Margin (%) | 28.7% | ||||
| Net Profit Margin (%) | 9.3% |

Its net profit margin, similar to its total revenue and net profit we’ve looked at moments earlier, also recorded y-o-y improvements throughout the entire 6-year period I have looked at.
However, for its gross profit margin, after peaking at 29.0% in FY2018, it recorded slight declines over the next 2 years (i.e. in FY2019 as well as in FY2020), as the percentage increase in its cost was more than its revenue – that said, throughout the entire 6-year period, it still managed to stay above 28.0%.
Return on Equity (%):
In layman terms, Return on Equity, or RoE for short, is the amount of profits (usually expressed in percentage terms) a company is able to generate for every single dollar of shareholders’ money it use in its business/es.
Ideally, my preference is towards investing in companies that are able to consistently maintain that statistic at above 15.0%.
Question – did POOLCORP satisfy this criteria of mine? Let us have a look at its RoE over the past 6 years (which I have calculated):
| FY2015 | FY2016 | FY2017 | FY2018 | FY2019 | |
| Return on Equity (%) | 50.0% | 72.7% | 86.1% | 104.5% | 63.9% |
| FY2020 | |||||
| Return on Equity (%) | 57.4% |

Similar to its gross profit margin over the past 6-years, POOLCORP’s RoE peaked at 104.5% in FY2018 before declining in the subsequent years – that said, its RoE throughout the entire 6-year period managed to stay above 15.0%, which satisfies my selection criteria.
Debt Profile (between FY2015 and FY2020)
Besides its financial performance, another area I look at when I study a company is its debt profile – where my preference is towards companies that have minimal or no debt (the latter preferred), along with the company being in a net cash position.
The following table is POOLCORP’s debt profile over the past 6 financial years (between FY2015 and FY2020) I have compiled:
| FY2015 | FY2016 | FY2017 | FY2018 | FY2019 | |
| Cash & Cash Equivalent (US$’mil) | $13m | $22m | $30m | $16m | $29m |
| Total Borrowings (US$’mil) | $328m | $438m | $520m | $667m | $512m |
| Net Cash/Debt (US$’mil) | -$315m | -$416m | -$490m | -$651m | -$483m |
| FY2020 | |||||
| Cash & Cash Equivalent (US$’mil) | $34m | ||||
| Total Borrowings (US$’mil) | $416m | ||||
| Net Cash/Debt (US$’mil) | -$382m |
No doubt the company is in a net debt position in all of the 6 financial years I have looked at, but I noticed its total borrowings going down since FY2019, and as a result, its net debt position have also improved.
Dividend Payouts to Shareholders (between FY2015 and FY2020)
POOLCORP’s management declares a dividend to its shareholders on a quarterly basis (good for those who like to receive regular dividends.) However, if you are a Singaporean investor, do take note that all dividends declared are subjected to a 30.0% withholding tax – meaning the amount you receive will be 30.0% less.
The following table is the company’s dividend payouts over the last 6 years, along with its payout ratio I’ve calculated:
| FY2015 | FY2016 | FY2017 | FY2018 | FY2019 | |
| Dividend Per Share (US$/share) | $1.00 | $1.19 | $1.42 | $1.72 | $2.10 |
| Dividend Payout Ratio (%) | 34.5% | 34.3% | 31.5% | 30.6% | 32.8% |
| FY2020 | |||||
| Dividend Per Share (US$/share) | $2.29 | ||||
| Dividend Payout Ratio (%) | 25.5% |
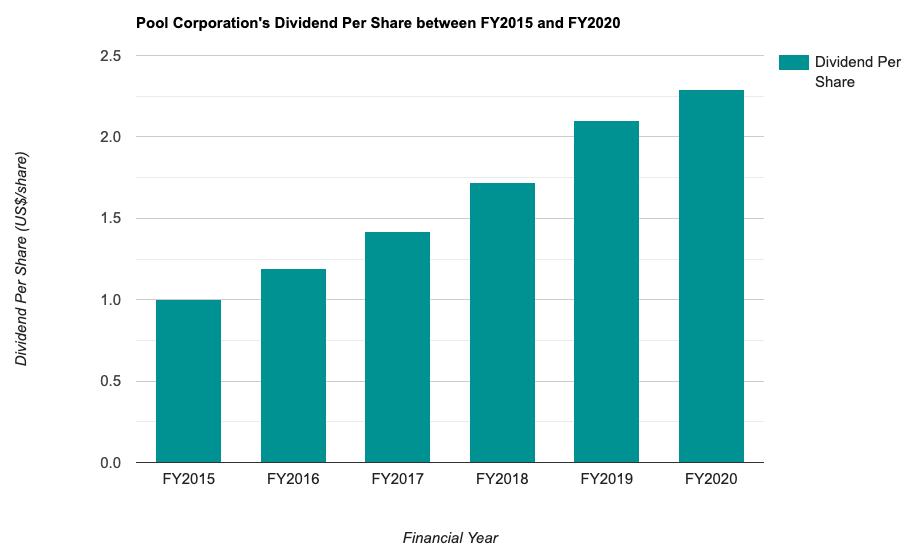
Over the past 6 years, POOLCORP have been increasing its dividend payouts to its shareholders – from US$1.00/share in FY2015 to US$2.29/share in FY2020 – a CAGR of 14.8% – somewhat in-line with the CAGR of its net profit over the same time period.
In terms of its payout ratio, it has been maintained at under 35.0% in all of the 6 years I have looked at.
POOLCORP’s Q1 FY2020 vs. Q1 FY2021 Results
In end-April 2021, Pool Corporation released its results for the first quarter of the financial year 2021 ended 31 March 2021, and the following are some of the key statistics for the quarter under review compared against the same time period last year (i.e. Q1 FY2020 ended 31 March 2020):
| Q1 FY2020 | Q1 FY2021 | % Variance | |
| Total Revenue (US$’mil) | $677m | $1,061m | +56.7% |
| Net Profit (US$’mil) | $31m | $99m | > 100.0% |
| Gross Profit Margin (%) | 27.9% | 28.4% | – |
| Net Profit Margin (%) | 4.6% | 9.3% | – |
| Cash & Cash Equivalent (US$’mil) | $18m | $27m | +50.0% |
| Total Borrowings (US$’mil) | $586m | $433m | -26.1% |
| Net Cash/Debt (US$’mil) | -$568m | -$406m | – |
| Dividend Per Share (US$/share) | $0.55 | $0.58 | +5.5% |
Compared to the same time period last year, Pool Corporation’s latest first quarter results was, in my opinion, an impressive one – the huge improvements recorded in its total revenue and net profit were due to elevated demand for the company’s residential pool products, driven by home-centric trends influenced by the Covid-19 pandemic.
In-line with growth in its top- and bottom-line results, the company’s gross and net profit margins also saw improvements.
Another improvement to highlight in its latest quarter results was its debt profile – while the company is still in a net debt position, but compared to last year, due to a decrease in its total borrowings, its net debt position have also improved.
Closing Thoughts
Apart from the company being in a net debt position, personally, there is nothing not to like about the company – what caught my eye, as I have mentioned in the earlier sections of this post, was its continuously improving total revenue and net profit, dividend payout to its shareholders, and also its high RoE.
That said, this post is by no means a recommendation to buy shares of Pool Corporation. You are strongly advised to do your own due diligence before you make any investment decisions.
Disclaimer: At the time of writing, I am not a shareholder of Pool Corporation.
Stop Spending Hours Reading REIT Reports Every Quarter!
What if you could assess a REIT's portfolio occupancy, debt profile, valuation, and overall health in less than 30 seconds - without having to comb through a single quarterly report?
That's the problem the REIT Screener was built to solve.
Developed through a collaboration between ShareInvestor and The Singaporean Investor, the REIT Screener consolidates many of the key metrics and indicators I personally use when analysing REITs into one easy-to-use platform. Instead of spending hours extracting data manually every earnings season, you can now monitor the REITs you own and research new opportunities in just a few clicks.
If you're serious about REIT investing but don't have the time to manually track quarterly developments, the REIT Screener could be the shortcut you've been looking for:

Take a closer look at the REIT Screener here...


Comments (0)