I know, it has been quite some time since I last wrote about a Hong Kong-listed company – part of the reason was due to me being very tied up with my new home renovation works as well as moving over the past couple of months, and because of that, I have decided to focus my attention on just Singapore and US-listed companies during that period.
Now that I am more or less settled down, except for some touchup works to go, which I have scheduled for them to be done on weekends so I can focus on my investing and trading work on weekdays, I am back to studying about Hong Kong-listed companies once again.
Today, I would like to write about this company called Techtronic Industries Company Limited (SEHK:0669), which specialises in power and hand tools (and accessories), outdoor power equipment, along with floor care and appliances. If you are into DIY, then some of these brands under the company should be familiar with you – including MILWAUKEE, RYOBI, and HOOVER.

Founded in 1985, and listed in the Stock Exchange of Hong Kong since 1990, the company is one of the constituents of Hong Kong’s benchmark Hang Seng Index.
In the rest of today’s post, I will be sharing all the researches I have done about the company – including its financial performance, debt profile, as well as its dividend payout to its shareholders over a 6-year period (between FY2015 and FY2020.)
Let’s begin…
Financial Performance between FY2015 and FY2020
Techtronic Industries has a financial year end every 31 December. In this section, you will learn about some of the key financial figures the company has recorded between FY2015 and FY2020:
Total Revenue and Net Profit (US$’mil):
| FY2015 | FY2016 | FY2017 | FY2018 | FY2019 | |
| Total Revenue (US$’mil) | $5,038m | $5,480m | $6,064m | $7,021m | $7,667m |
| Net Profit (US$’mil) | $354m | $409m | $470m | $552m | $615m |
| FY2020 | |||||
| Total Revenue (US$’mil) | $9,812m | ||||
| Net Profit (US$’mil) | $801m |

Personally, I am quite impressed by the company’s ability to record growth every single year in all of the 6 years I have looked at – its total revenue saw a compound annual growth rate (or CAGR) of 11.8%, while its net profit saw a CAGR of 14.6%.
Gross and Net Profit Margin (%):
The following table is the company’s gross and net profit margin which I have computed:
| FY2015 | FY2016 | FY2017 | FY2018 | FY2019 | |
| Gross Profit Margin (%) | 35.7% | 36.2% | 36.7% | 37.2% | 37.7% |
| Net Profit Margin (%) | 7.0% | 7.5% | 7.8% | 7.9% | 8.0% |
| FY2020 | |||||
| Gross Profit Margin (%) | 38.3% | ||||
| Net Profit Margin (%) | 8.2% |
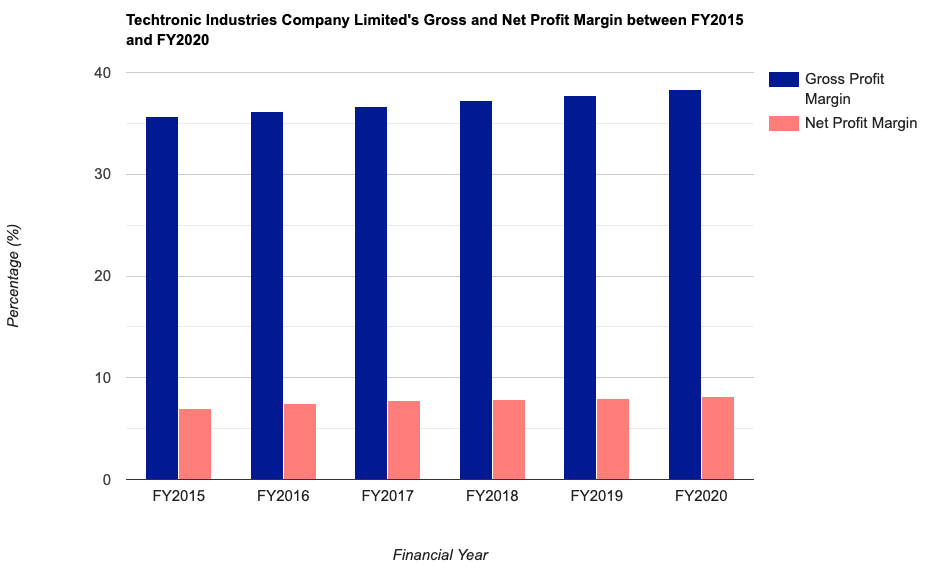
In-line with its year-on-year (y-o-y) growth in its total revenue and net profit, the company’s gross and net profit margins saw incremental improvements every single year as well.
Return on Equity (%):
Return on Equity, or RoE, is a calculation of the percentage of profits the company is able to generate for every dollar of shareholders’ money it uses in its business/es.
As an investor, ideally, I would prefer to invest in companies that are able to consistently maintain their RoE at above 15.0% over the years.
Did Techtronic Industries’ RoE meet this criteria of mine? Let us take a look at it in the table below, where you will find the company’s RoE which I have manually computed:
| FY2015 | FY2016 | FY2017 | FY2018 | FY2019 | |
| Return on Equity (%) | 16.4% | 17.0% | 17.2% | 18.1% | 18.1% |
| FY2020 | |||||
| Return on Equity (%) | 20.5% |

Another thing about the company I like is that, not only has it maintained its RoE at above 15.0% in all of the 6 financial years I have looked at, but this particular statistic have also gradually improved as well in the same time period.
Debt Profile between FY2015 and FY2020
Apart from a company’s financial results, another area of focus (whenever I study a company) is its debt profile – where my preference is towards companies with minimal or no debt, as well as one that is in a net cash position.
Again, did Techtronic Industries fulfil this criteria of mine? Let us find out in the table below:
| FY2015 | FY2016 | FY2017 | FY2018 | FY2019 | |
| Cash & Cash Equivalents (US$’mil) | $771m | $803m | $864m | $1,104m | $1,412m |
| Total Borrowings (US$’mil) | $1,045m | $894m | $825m | $795m | $1,487m |
| Net Cash/ Debt (US$’mil) | -$274m | -$91m | +$39m | +$309m | -$75m |
| FY2020 | |||||
| Cash & Cash Equivalents (US$’mil) | $1,534m | ||||
| Total Borrowings (US$’mil) | $1,325m | ||||
| Net Cash/ Debt (US$’mil) | +$209m |
One thing I like about the company’s debt profile is that its cash and cash equivalents have been on the rise every single year, and that in terms of its net cash/debt position, it is in a net cash position in 3 out of the 6 financial years I have looked at.
As at the end of FY2020, the company is in a net cash position of +$209m, which is good to note in my opinion.
Dividend Payout to Shareholders between FY2015 and FY2020
Techtronic Industries declare a dividend payout to its shareholders on a semi-annual basis, and the following table is its dividend payout over the past 6 years, along with its payout ratio which I have computed:
| FY2015 | FY2016 | FY2017 | FY2018 | FY2019 | |
| Dividend Per Share (US$/share) | $0.05 | $0.06 | $0.09 | $0.11 | $0.13 |
| Dividend Payout Ratio (%) | 26.1% | 28.9% | 33.7% | 37.2% | 39.3% |
| FY2020 | |||||
| Dividend Per Share (US$/share) | $0.17 | ||||
| Dividend Payout Ratio (%) | 39.8% |
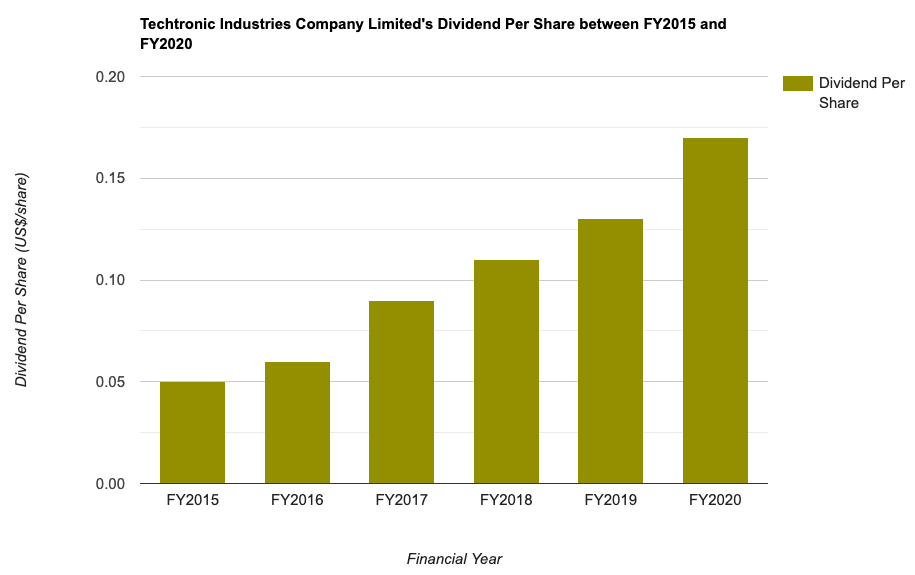
Techtronic Industries have increased its dividend payout every single year over the past 6 financial years I have looked – from US$0.05/share in FY2015 to US$0.17/share in FY2020, a CAGR of 22.9%.
I also noticed from the increase in its dividend payout ratio over the years that the company have also been increasing their proportion of earnings to its shareholders as dividends.
Closing Thoughts
Apart from the company being in a net debt position in 3 out of the 6 financial years I have looked at, this company caught my eye in terms of its growth in its financial performance and dividend payout. Also, in terms of the company’s business operations, it is in one that is simple enough to understand (I’m sure you will agree with me on that as well.)
However, despite having said that, this post is by no means a recommendation to buy or sell the shares of Techtroinic Industries. You should always do your own due diligence before you make any investment decisions.
Disclaimer: At the time of writing, I am not a shareholder of Techtronic Industries Company Limited.
Are You Worried about Not Having Enough Money for Retirement?
You're not alone. According to the OCBC Financial Wellness Index, only 62% of people in their 20s and 56% of people in their 30s are confident that they will have enough money to retire.
But there is still time to take action. One way to ensure that you have a comfortable retirement is to invest in real estate investment trusts (REITs).
In 'Building Your REIT-irement Portfolio' which I've authored, you will learn everything you need to know to build a successful REIT investment portfolio, including a list of 9 things to look at to determine whether a REIT is worthy of your investment, 1 simple method to help you maximise your returns from your REIT investment, 4 signs of 'red flags' to look out for and what you can do as a shareholder, and more!

You can find out more about the book, and grab your copy (ebook or physical book) here...


Comments (0)