Fellow Singaporean investors should have come across the company name S&P Global Inc. (NYSE:SPGI) before, where on and off, you will find reports published by their ‘Ratings’ business division on the outlooks of Singapore-listed companies, along with their credit ratings to them.
Today, I’d like to share with you researches I have done on this US-listed company – particularly their financial performance, debt profile, and dividend payouts to its shareholders over the past 6 years (between FY2015 and FY2020), along with whether or not the company, at its current price, is considered ‘cheap’ or ‘expensive.’
But before I go into that, here’s a brief introduction about the company – S&P Global Inc. (NYSE:SPGI) is a leading provider of transparent and independent ratings, benchmarks, analytics and data to both capital markets (which includes asset managers, investment and commercial banks, insurance companies, exchanges, trading firms and issuers), as well as commodity markets (including producers, traders, intermediaries within energy, petrochemical, metals and agriculture) worldwide.
The company operates in the following 4 business segments:
(i) Ratings – an independent provider of credit ratings, research and analytics, offering investors and other market participants information, ratings and benchmarks (in FY2020, it contributed 49% towards the company’s total revenue)
(ii) Market Intelligence – a global provider of multi-asset-class data, research and analytical capabilities, which integrate cross-asset analytics and desktop services (in FY2020, this business segment contributed 29% towards the company’s total revenue)
(iii) Platts – the leading provider of information and benchmark prices for the commodity and benchmark markets (this business segment contributed 10% towards the company’s total revenue in FY2020)
(iv) Indices – a global index provider maintaining a wide variety of valuation and index benchmarks for investment advisors, wealth managers, and institutional investors (in FY2020, it contributed 12% towards the company’s total revenue)
Financial Performance
S&P Global Inc. have a financial year end every 31 December. In this section, let us take a look at its key financial statistics recorded between FY2015 and FY2020:
Total Revenue (US$’mil), Net Profit (US$’mil), and Net Profit Margin (%):
| FY2015 | FY2016 | FY2017 | FY2018 | |
| Total Revenue (US$’mil) | $5,313m | $5,661m | $6,063m | $6,258m |
| Net Profit (US$’mil) | $1,156m | $2,106m | $1,496m | $1,958m |
| Net Profit Margin (%) | 21.8% | 37.2% | 24.7% | 31.3% |
| FY2019 | FY2020 | |||
| Total Revenue (US$’mil) | $6,699m | $7,442m | ||
| Net Profit (US$’mil) | $2,123m | $2,339m | ||
| Net Profit Margin (%) | 31.7% | 31.4% |
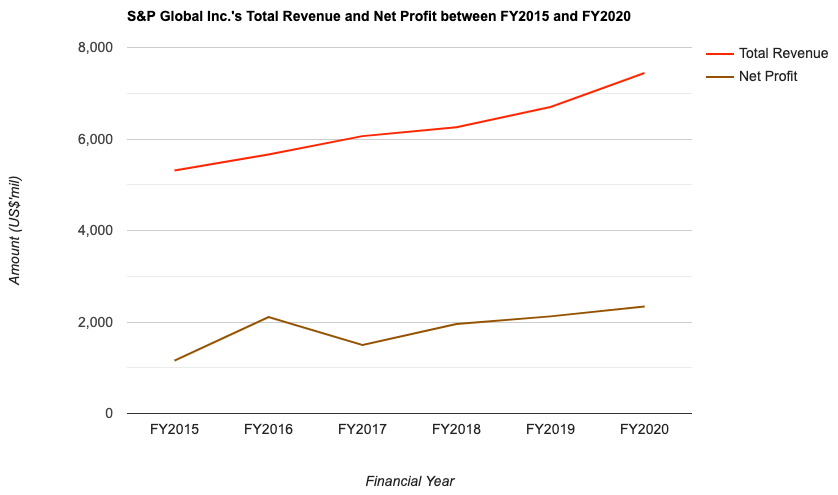
The company has seen its total revenue recording growth in all of the 6 financial years I have looked at – and a compound annual growth rate (CAGR) of 5.8% in this time period.
In terms of its net profit growth, it saw year-on-year (y-o-y) improvements in 5 out of the 6 years I have looked at – the only exception was in FY2017, where it fell by 29.0% due to US tax reform. Despite that, over a 6-year time period, the company’s net profit grew at a CAGR of 12.5%.
Finally, in terms of its net profit, it has largely been moving around the 30+% range in the past 6 years.
Return on Equity (%):
In terms of a company’s Return on Equity, or RoE (which is the amount of profits a company is able to generate for every dollar of shareholders’ money it uses in its businesses), my preference is towards those that are able to consistently maintain it at above 15.0%.
With that, the following table is S&P Global Inc.’s RoE I have computed over the past 6 financial years:
| FY2015 | FY2016 | FY2017 | FY2018 | |
| Return on Equity (%) | 475.7% | 300.4% | 195.3% | 286.3% |
| FY2019 | FY2020 | |||
| Return on Equity (%) | 396.1% | 409.6% |

While the growth in its RoE over the past 6 years I have looked at has been irregular, but in all the years, this statistic has been way above my preferred level of 15.0% – as such, the company passes this selection criteria of mine.
Debt Profile
Apart from its financial performance, another area I focus my attention on when I study about a company is its debt profile, where my preference is towards companies with little or no debt.
So, did S&P Global Inc. pass through this criteria of mine? Let us find out in the table below, where you will find the company’s debt profile between FY2015 and FY2020:
| FY2015 | FY2016 | FY2017 | FY2018 | |
| Cash & Cash Equivalent at the End of Period (US$’mil) | $1,481m | $2,392m | $2,779m | $1,958m |
| Total Borrowings (US$’mil) | $3,611m | $3,564m | $3,569m | $3,662m |
| Net Cash/Debt (US$’mil) | -$2,130m | -$1,172m | -$790m | -$1,704m |
| FY2019 | FY2020 | |||
| Cash & Cash Equivalent at the End of Period (US$’mil) | $2,886m | $4,122m | ||
| Total Borrowings (US$’mil) | $3,948m | $4,110m | ||
| Net Cash/Debt (US$’mil) | -$1,062m | +$12m |
Over the years, especially between FY2018 and FY2020, its total borrowings have been on the rise. The company, as a result of an increase in its total borrowings, have been in a net debt position in 5 out of the 6 years I have looked at (in the table above) – the only exception was in the latest financial year (i.e. FY2020), where it has reversed into a net cash position, due to a strong 42.8% y-o-y increase in its cash and cash equivalents.
As I’m not too comfortable with its increasing amount of total borrowings, I will continue to keep a close watch on its debt profile in the coming quarters ahead.
Dividend Payout to Shareholders
The company pays out a dividend to its shareholders on a quarterly basis. However, there is one thing you need to take note of if you are a Singaporean investing in a US-listed company, and that is, all payouts will be subjected to a 30.0% withholding tax – meaning the amount you eventually receive as dividends will be 30.0% less than the amount declared.
Now, let us take a look at S&P Global’s dividend payout, along with its dividend payout ratio, over the past 6 financial years (between FY2015 and FY2020):
| FY2015 | FY2016 | FY2017 | FY2018 | |
| Dividend Per Share (USD/share) | $1.32 | $1.44 | $1.64 | $2.00 |
| Dividend Payout Ratio (%) | 31.4% | 18.1% | 28.4% | 25.9% |
| FY2019 | FY2020 | |||
| Dividend Per Share (USD/share) | $2.28 | $2.68 | ||
| Dividend Payout Ratio (%) | 26.5% | 27.7% |

Over the past 6 years, its dividend payout have been on a rise – from US$1.32/share in FY2015 to a high of US$2.68/share in FY2020 – a CAGR of 12.5% – which is in-line with its net profit growth.
In terms of its payout ratio, I’ve noticed that the company seem to have capped its payout to no more than 30.0% of its earnings over the years.
Is the Current Share Price of S&P Global Inc. Considered ‘Cheap’ or ‘Expensive’?
One of the ways I use to find out whether or not the current share price of a company is considered to be ‘cheap’ or ‘expensive’ is to take its current valuation (based on its current share price), and compare against its historical valuations.
At the time of writing, the share price of S&P Global Inc. was trading at US$346.83, with its current valuations as follows (taken from the ShareInvestor WebPro platform):
P/E Ratio: 35.7
P/B Ratio: 164.0
Dividend Yield: 0.8% (computed based on its dividend payout of US$2.68/share in FY2020)
The company’s historical valuations over the past 6 years (between FY2015 and FY2020), along with its average which I’ve computed are as follows:
| FY2015 | FY2016 | FY2017 | FY2018 | |
| P/E Ratio | 23.4 | 13.5 | 29.3 | 22.0 |
| P/B Ratio | 107.9 | 39.7 | 56.2 | 61.9 |
| Dividend Yield | 1.3% | 1.3% | 1.0% | 1.2% |
| FY2019 | FY2020 | Average | ||
| P/E Ratio | 31.8 | 34.0 | 25.7 | |
| P/B Ratio | 124.3 | 138.7 | 88.1 | |
| Dividend Yield | 0.8% | 0.8% | 1.1% |
Comparing its current valuations against its 6-year average, it does look like S&P Global Inc.’s current share price is considered to be ‘expensive’, due to its higher-than-average current P/E and P/B ratios, along with a lower-than-average current dividend yield.
In Conclusion
What I like about S&P Global Inc. is its growing top- and bottom-line, along with its improved dividend payout over the past 6 years I have looked at.
On the other hand, I have some concerns about the company’s increase in its total borrowings in the same time period, along with its high current price-to-book (P/B) ratio.
With that, I have come to end of my share about S&P Global Inc. I hope you have found the contents useful, and that through this post, you now have a better understanding about the US-listed company. However, do take note that the contents above are solely for educational purposes only, and they do not represent any buy or sell calls for the company’s shares. As always, please do your own due diligence before you make any investment decisions.
Disclaimer: At the time of writing, I am not a shareholder of S&P Global Inc.
Are You Worried about Not Having Enough Money for Retirement?
You're not alone. According to the OCBC Financial Wellness Index, only 62% of people in their 20s and 56% of people in their 30s are confident that they will have enough money to retire.
But there is still time to take action. One way to ensure that you have a comfortable retirement is to invest in real estate investment trusts (REITs).
In 'Building Your REIT-irement Portfolio' which I've authored, you will learn everything you need to know to build a successful REIT investment portfolio, including a list of 9 things to look at to determine whether a REIT is worthy of your investment, 1 simple method to help you maximise your returns from your REIT investment, 4 signs of 'red flags' to look out for and what you can do as a shareholder, and more!

You can find out more about the book, and grab your copy (ebook or physical book) here...


Comments (0)