If there’s one word I can use to describe the movements of the US market over the past 2 weeks or so, it is the word ‘volatile.’
The S&P 500 Index fell from a high of 3,950 points (on 16 Feb 2021) to 3,811 points when the market closed last Friday (26 February 2021) – a 3.5% decline, the Dow Jones Industrial Average Index fell from a high of 32,009 points (on 24 February 2021) to close at 30,932 points last Friday – a drop by 3.4%, and the NASDAQ Composite Index fell from 14,175 points (on 16 Feb 2021) to close at 13,192 points last Friday – falling by 6.9%.
In this post, you will find my technical analysis of the 3 US indexes (both the bull, as well as the bear case) based on the following:
- 20 day (dark green), 50 day (light green), 100 day (orange), 150 day (yellow), and 200 day (red) moving average on a weekly timeframe
- Bollinger band on a weekly timeframe (with the upper and lower bands in sky blue colour)
- Moving average convergence divergence (or MACD) on a daily timeframe
- Stochastic on a daily timeframe
Some of you may be wondering why my moving averages and Bollinger bands are based on a weekly timeframe (instead of on a daily timeframe) – the reason is because from my trading experiences, I find that they are more ‘accurate’ in helping me determine major support and/or resistance levels.
Let’s begin…
S&P 500 Index
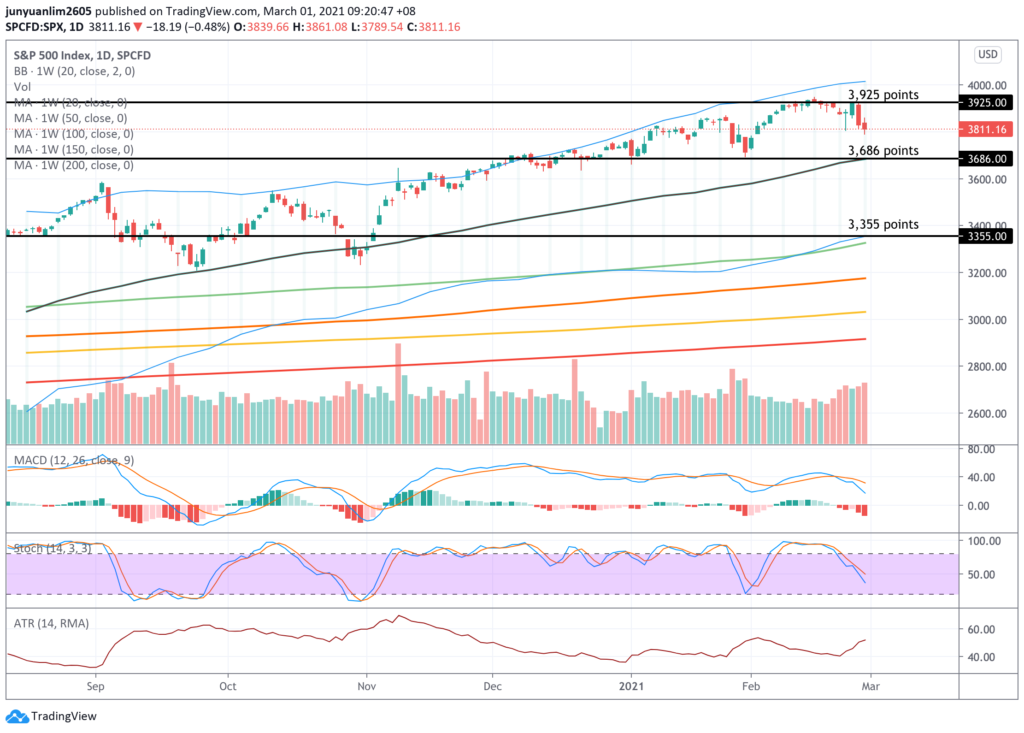
Looking at the movements of the S&P 500 on a daily timeframe, you can see that it is heading down towards where MA20 is at 3,686 points (and also where the most immediate support line is.) Both the MACD and stochastic are in a downtrend, suggesting that in the near-term, the index is in a bearish state and could potentially visit that level.
If the bears were to continue to push the index down, then the next level of support is around 3,355 points, where the lower band of the Bollinger Band is.
However, should the bulls were to come back again to push the S&P 500 up from its current position when the market closed last Friday (26 Feb 2021), then we could see the index going up to around 3,925 points (I’ve denoted where it is on the chart above), where there is an immediate resistance.
Dow Jones Industrial Average Index
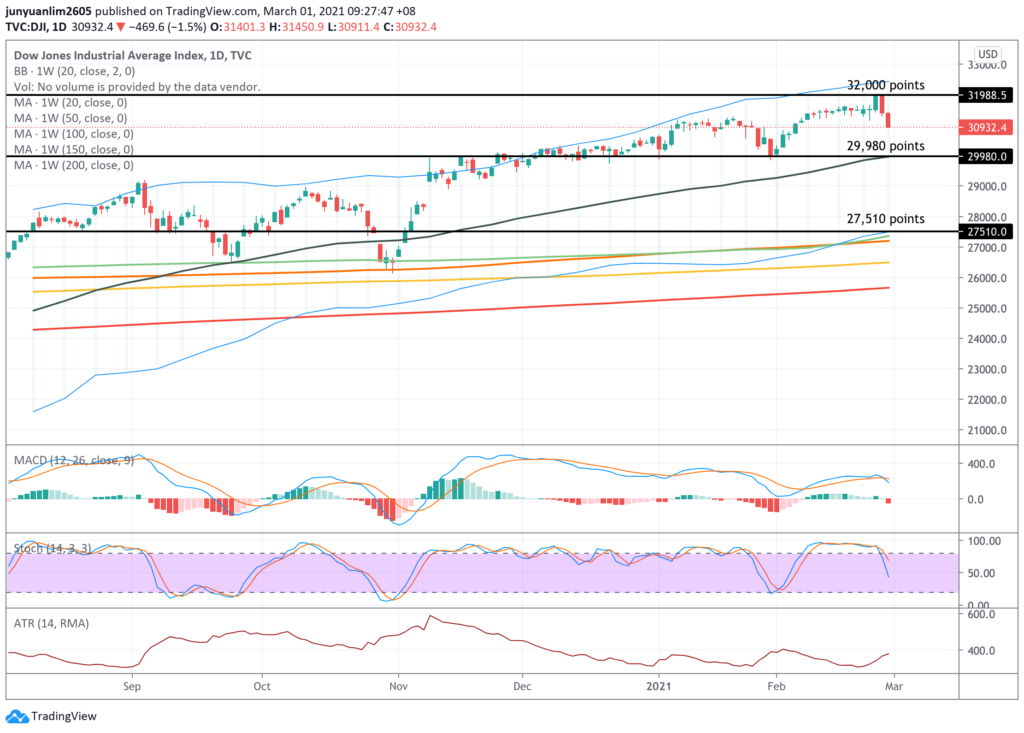
Similar to the S&P 500 Index, the Dow Jones Industrial Average Index too reversed after reaching a high (of 32,009 points.) Looking at the technical indicators MACD and stochastic, both of them are also in a downtrend position, suggesting that in the near-term, the movement of the index is likely to be bearish – where it could possibly move down towards the 29,980 point mark (and this is where MA20, and a major support line is.)
If this major support line is broken and the index continues to trend downwards, then it is possible that it could move down towards where the lower band of the Bollinger Band is, at around 27,510 points. Notice that MA50 and MA100 are also around this range as well – and in my personal opinion, this point acts as a very strong support.
The above is a bear case scenario. However, should the bulls come back again to push the index up, then it is likely that we could see it going up to 32,000 points, or maybe even re-visiting its all-time high of 32,009 points.
NASDAQ Composite Index
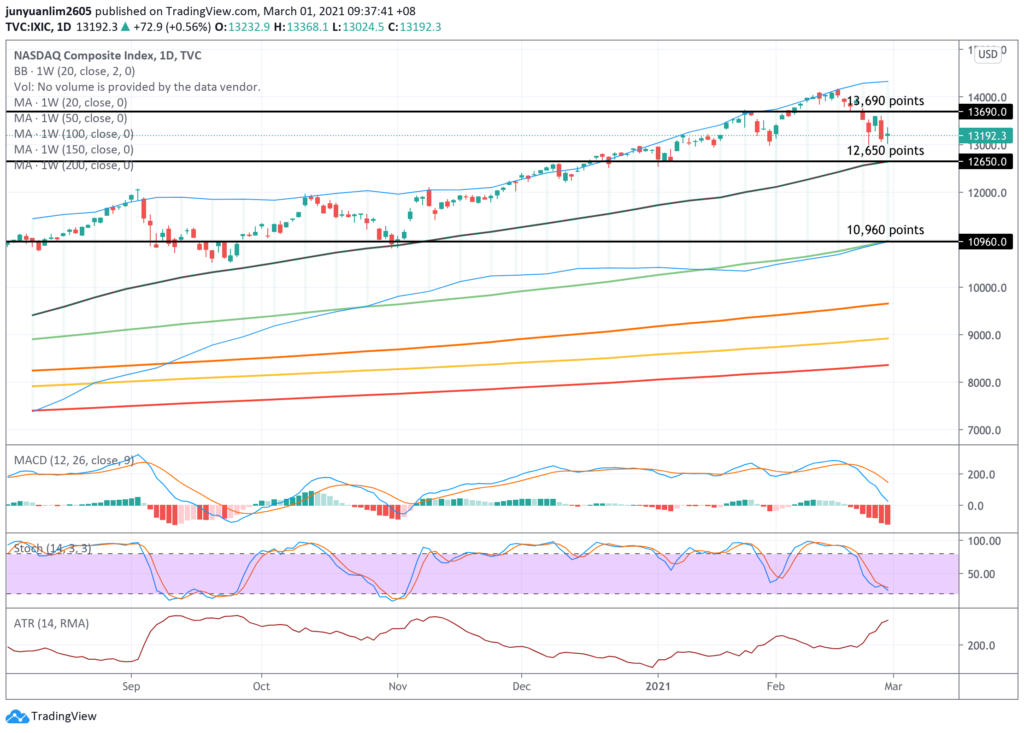
Among the 3 US indexes, the NASDAQ Composite Index saw the heaviest degree of drop – by 6.9% from its high (of 14,175 points.)
Just like the S&P 500 Index and the Dow Jones Industrial Average Index, looking at the technical indicators MACD and stochastic, they are both in a downtrend position, suggesting that in the near-term, the bears are in control. Should the index continue to trend downwards, then it could go down to where MA20 is (and this also acts as a support line), at around 12,650 points.
Should this support line be broken, then the next support line is at 10,960 points – where the lower band of the Bollinger Band, as well as where MA50 is – the fact that the 2 lines are around the same point suggests that this is a very strong support line.
However, should the bulls come back once again and push the index up from where it closed last Friday (26 Feb 2021), then it could go up to around 13,690 points (I’ve denoted where it is in the chart above), where there is a resistance line around that area.
In Conclusion
In the near-term, it seems that the bears are in control. However, I believe that the recent pulldown is just a retracement, and not a correction (which is a drop by 20% from its high.) In case you may be wondering about my thoughts on whether or not the US indexes will re-visit levels around mid-March last year, I personally do not think so, as the global economy is slowly recovering with the introduction of vaccines, and with countries carrying out vaccination for their population.
However, do take note that the above is just my personal analysis of the US indexes, which I am sharing purely for educational purposes only. I hope you’ll find it useful, and here’s wishing you a great week, as well as a profitable month of March ahead!
Are You Worried about Not Having Enough Money for Retirement?
You're not alone. According to the OCBC Financial Wellness Index, only 62% of people in their 20s and 56% of people in their 30s are confident that they will have enough money to retire.
But there is still time to take action. One way to ensure that you have a comfortable retirement is to invest in real estate investment trusts (REITs).
In 'Building Your REIT-irement Portfolio' which I've authored, you will learn everything you need to know to build a successful REIT investment portfolio, including a list of 9 things to look at to determine whether a REIT is worthy of your investment, 1 simple method to help you maximise your returns from your REIT investment, 4 signs of 'red flags' to look out for and what you can do as a shareholder, and more!

You can find out more about the book, and grab your copy (ebook or physical book) here...


Comments (0)