Following my company writeup about the video streaming company Netflix Inc. yesterday (you can check out the post here in case you’ve missed it), today I’d like to share with you all the researches I have done about another US-listed company in Nike Inc. (NYSE:NKE.)
This American sports apparel company needs no further introduction, where they are the makers of their namesake brand of sports apparels. Apart from that, Nike also owns the brand ‘Converse’ (I’m sure you should be familiar with this brand as well, where their apparels can be found in Singapore.)
In terms of the company’s revenue in the latest financial year 2019/20 (the company has a financial year-end every 31 May), the United States accounted for 39% of its total revenues, while the international markets contributed the remaining 61%.
Question: Does Nike Inc. make a good addition to your long-term investment portfolio? To best answer this question, let us take a look at its financial performance, debt profile, as well as its dividend payout (to its shareholders) over the years, along with the latest year’s financial results so far to find out (all of which you’ll read about in the rest of this post, so let’s begin…)
Financial Performance between FY2014/15 and FY2019/20
In this section, let us take a look at Nike Inc.’s financial performance over the past 6 years – between FY2014/15 (ended 31 May 2015) and FY2019/20 (ended 31 May 2020.)
Total Revenue & Net Profit (US$’mil):
| FY 2014/15 | FY 2015/16 | FY 2016/17 | FY 2017/18 | |
| Total Revenue (USD’mil) | $30,601m | $32,376m | $34,350m | $36,397m |
| Net Profit (USD’mil) | $3,273m | $3,760m | $4,240m | $1,933m |
| FY 2018/19 | FY 2019/20 | |||
| Total Revenue (USD’mil) | $39,117m | $37,403m | ||
| Net Profit (USD’mil) | $4,029m | $2,539m |

Its total revenue saw year-on-year (y-o-y) improvements every single year except for the latest financial year 2019/20, which dipped 4.4%, due to temporary store closures as a result of lockdowns in the various countries to curb the further spread of Covid-19 in the community. Over a 6-year period, Nike’s total revenue grew at a compound annual growth rate (CAGR) of 3.4%.
Its net profit saw y-o-y declines in 2 out of 6 financial years I have looked at – in FY2017/18 (due to impact of the Tax Act), as well as in FY2019/20 (due to temporary store closures as a result of the ongoing Covid pandemic.) Over the 6 financial years I have looked at, its net profit did not record any growth (in fact, it declined, from US$3,273m in FY2014/15 to US$2,539m in FY2019/20.)
Gross and Net Profit Margins (%):
The following table is Nike Inc.’s gross and net profit margins over the last 6 financial years I have calculated:
| FY 2014/15 | FY 2015/16 | FY 2016/17 | FY 2017/18 | |
| Gross Profit Margin (%) | 46.0% | 46.2% | 44.6% | 43.8% |
| Net Profit Margin (%) | 10.7% | 11.6% | 12.3% | 5.3% |
| FY 2018/19 | FY 2019/20 | |||
| Gross Profit Margin (%) | 44.7% | 43.4% | ||
| Net Profit Margin (%) | 10.3% | 6.8% |

The company’s gross profit margins have remained stable over the past 6 years – at around the 40+% region; meanwhile, its net profit margin saw y-o-y declines in FY2017/18 and in FY2019/20, in-line with the decline in its net profits (which I have talked about earlier.)
Return on Equity (%):
Return on Equity, or RoE, is the measure of profits a company is able to generate for every dollar of shareholders’ money it uses in its businesses; personally, my preference is towards companies that are able to consistently maintain its RoE at 15.0% and above over the years.
With that, let us take a look at Nike Inc.’s RoE I’ve calculated over the past 6 financial years:
| FY 2014/15 | FY 2015/16 | FY 2016/17 | FY 2017/18 | |
| Return on Equity (%) | 25.8% | 30.7% | 34.2% | 19.7% |
| FY 2018/19 | FY 2019/20 | |||
| Return on Equity (%) | 44.6% | 31.5% |

As you can see from the table and line chart above, even though there’s some fluctuations on some years, but Nike was able to keep its RoE at above 15.0% in all of the 6 years I’ve looked at, which is ideal in my opinion.
Debt Profile between FY2014/15 and FY2019/20
Next, let us take a look at Nike Inc.’s debt profile over the years – when it comes to selecting companies to invest, my preference is towards those that have minimal or no debt (the latter preferred.)
That said, does Nike Inc.’s debt profile satisfy this requirement of mine? Let us find out in the table below:
| FY 2014/15 | FY 2015/16 | FY 2016/17 | FY 2017/18 | |
| Cash & Cash Equivalent at the End of Period (USD’mil) | $3,852m | $3,138m | $3,808m | $4,249m |
| Total Borrowings (USD’mil) | $1,186m | $2,037m | $3,477m | $3,474m |
| Net Cash/ Debt (USD’mil) | +$2,666m | +$1,101m | +$331m | +$775m |
| FY 2018/19 | FY 2019/20 | |||
| Cash & Cash Equivalent at the End of Period (USD’mil) | $4,466m | $8,348m | ||
| Total Borrowings (USD’mil) | $3,470m | $9,409m | ||
| Net Cash/ Debt (USD’mil) | +$996m | -$1,061m |
While the company was able to grow its cash and cash equivalents over the years – where it went up from US$3,852m in FY2014/15 to US$8,348m in FY2019/20, a CAGR of 13.8%, its total borrowings also spiked in the same time period, recording a CAGR of 41.2%. As such, the company’s net cash position weakened over the years, and eventually reversed into a net loss position in FY2019/20.
Dividend Payout to Shareholders between FY2014/15 and FY2019/20
The management of Nike Inc. pays out a dividend to its shareholders on a quarterly basis. The following table is the company’s dividend payouts over the years, along with its dividend payout ratio (which is the percentage of earnings the company pays out as dividends to its shareholders.)
| FY 2014/15 | FY 2015/16 | FY 2016/17 | FY 2017/18 | |
| Dividend Per Share (USD’cents) | 54.0 cents | 78.0 cents | 70.0 cents | 78.0 cents |
| Dividend Payout Ratio (%) | 29.2% | 36.1% | 27.9% | 66.7% |
| FY 2018/19 | FY 2019/20 | |||
| Dividend Per Share (USD’cents) | 86.0 cents | 96.0 cents | ||
| Dividend Payout Ratio (%) | 34.5% | 59.7% |
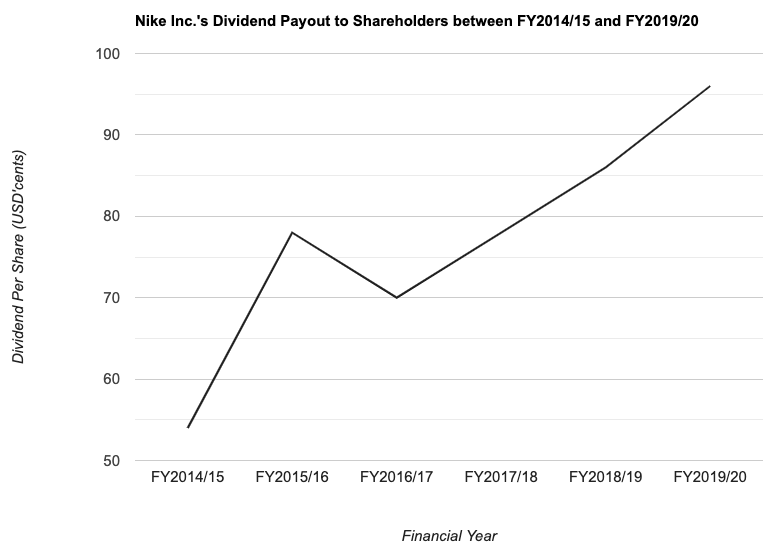
Over the past 6 years I have looked at, Nike’s dividend payouts have grown at a CAGR of 10.0%; in terms of its payout ratio, except for in FY2017/18 and in FY2019/20, the company have been paying out no more than 40.0% of its earnings as dividends.
A Look into Nike Inc.’s Current Year Financial Results (vs. the Previous Financial Year)
Let us take a look at the company’s latest financial results for the first half of the year (i.e. 1H FY2020/21 ended 30 November 2020) compared against the same time period last year (i.e. 1H FY2019/20 ended 30 November 2019):
| 1H FY2019/20 | 1H FY2020/21 | % Variation | |
| Total Revenue (USD’mil) | $20,986m | $21,837m | +4.1% |
| Net Profit (USD’mil) | $11,571m | $12,249m | +5.9% |
| Gross Profit Margin (%) | 44.9% | 43.9% | – |
| Net Profit Margin (%) | 11.8% | 12.7% | – |
On a half-year basis, both the company’s top- and bottom-line have recorded improvements once again (the former due to Nike direct sales, and also in its brand digital sales; the latter due to lower selling and administrative expense.) With improvements made in net profit, its net profit margin also saw a 0.9 percentage point improvement to 12.7%.
Is Nike Inc.’s Current Share Price Considered Cheap or Expensive?
One of the ways I use to determine whether or not a company’s current share price is considered cheap or expensive is to take its current valuations and compare against its average.
The following is the company’s valuations over the past 6 financial years, along with its average, which I’ve calculated:
| FY 2014/15 | FY 2015/16 | FY 2016/17 | FY 2017/18 | |
| P/E Ratio | 27.5 | 25.6 | 21.1 | 61.4 |
| P/B Ratio | 5.4 | 6.0 | 5.6 | 9.3 |
| Dividend Yield | 1.1% | 1.4% | 1.3% | 1.1% |
| FY 2018/19 | FY 2019/20 | Average | ||
| P/E Ratio | 31.0 | 61.6 | 38.0 | |
| P/B Ratio | 10.7 | 15.2 | 8.7 | |
| Dividend Yield | 1.1% | 1.0% | 1.2% |
At the time of writing, the share price of Nike Inc. was trading at US$142.12, and its current valuations is as follows:
P/E Ratio: 79.8
P/B Ratio: 21.2
Dividend Yield: 0.7% (computed based on a dividend payout of 96.0 cents/share in FY2019/20)
Comparing its current valuations against its 6-year average valuations, it seems that the current share price of Nike Inc. is on the expensive side, as its current P/E and P/B ratios are above the average, and its current dividend yield is lower than the average.
However, if I were to look at the consensus estimate on the ShareInvestor WebPro platform, there still remains a 15% upside to its mean target price of US$166.63:

In Conclusion
One thing about Nike Inc. that I like is that the company was able to record a steady growth in its revenue over the last 6 financial years. Another thing I like about the company was its ability to maintain its gross profit margin, as well as increase its dividend payout to its shareholders in the same time period.
The only thing I am not too comfortable with is its total borrowings, which have spiked by a huge margin over the past 6 financial years I have looked at – so much so that the company have reversed from a net cash position to a net debt position at the end of FY2019/20.
With that, I have come to the end of my share about the NYSE-listed Nike Inc. Do take note that everything you have just read above is purely for educational purposes only, and they do not imply any buy or sell calls for the company’s shares. You are encouraged to do your own due diligence before making any investment decisions.
Disclaimer: At the time of writing, I am not a shareholder of Nike Inc.
Are You Worried about Not Having Enough Money for Retirement?
You're not alone. According to the OCBC Financial Wellness Index, only 62% of people in their 20s and 56% of people in their 30s are confident that they will have enough money to retire.
But there is still time to take action. One way to ensure that you have a comfortable retirement is to invest in real estate investment trusts (REITs).
In 'Building Your REIT-irement Portfolio' which I've authored, you will learn everything you need to know to build a successful REIT investment portfolio, including a list of 9 things to look at to determine whether a REIT is worthy of your investment, 1 simple method to help you maximise your returns from your REIT investment, 4 signs of 'red flags' to look out for and what you can do as a shareholder, and more!

You can find out more about the book, and grab your copy (ebook or physical book) here...


Comments (0)