I have received a number of messages from readers of my site asking me for my outlook of the markets in the various geographical locations in the near-term, and for the benefit of all, I’ve decided to write a short post to share with my personal outlook on the movement of indexes in Singapore (the Straits Time Index), Hong Kong (the Hang Seng Index), as well as in the United States (the S&P 500 Index, Dow Jones Industrial Average Index, as well as the NASDAQ Composite Index.)
In my chart analyses below, you’ll find candlestick movements on a daily timeframe, along with the following major moving averages on a weekly timeframe: MA20 (dark green line), MA50 (light green line), MA100 (orange line), MA150 (yellow line), and MA200 (red line). In terms of technical indicators, I’ve used MACD, as well as stochastic.
Before you continue reading, do take note that everything you’re about to read are based purely on my own technical analysis, which I am sharing purely for educational purposes only. Let’s begin…
The Straits Times Index (Singapore)
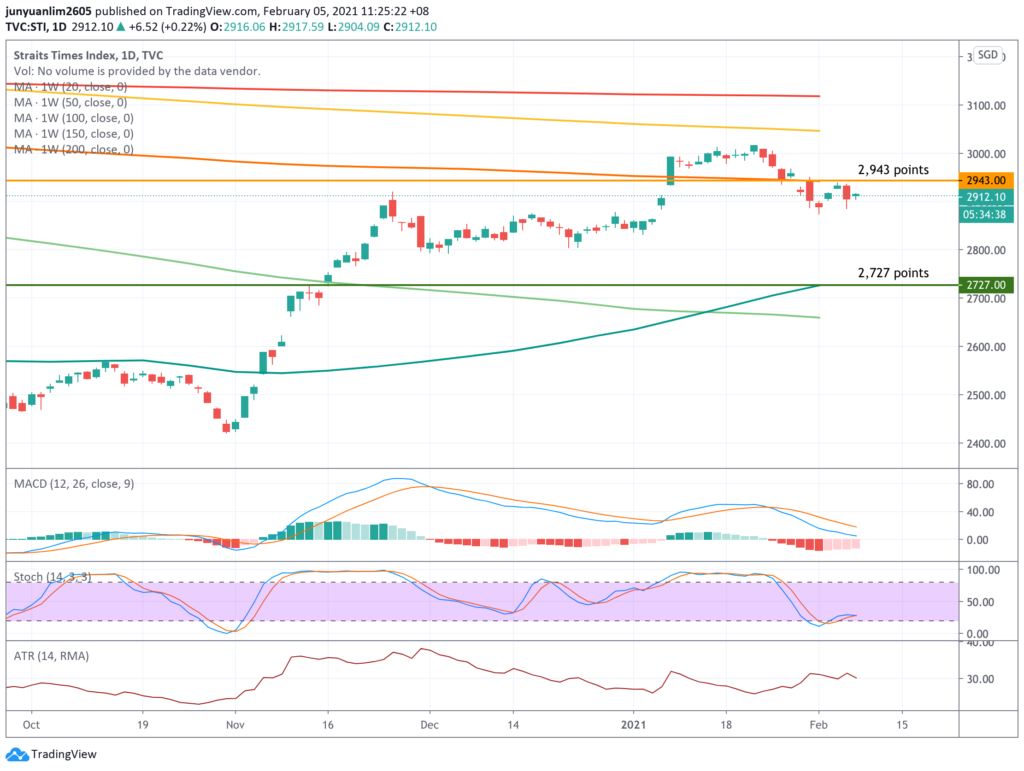
At the time of writing (at 11.25am on 05 February 2021), the STI is at 2,912.10 points.
Looking at the technical indicators, while stochastic is in an uptrend position, but it looks like the trend is about to reverse downwards. The other technical indicator, the MACD, is in a downtrend position, and pointing downwards, suggesting that in the near-term, the index may move downwards.
Personally, I feel that the Straits Times Index may continue to see some weakness in the near-term, where in the bearish scenario, it could possibly head down towards the support line at 2,727 points (where MA20 is.) While there’s a chance the index could possibly head up towards the resistance at 2,943 points (where MA100 is), but I personally feel that further upside from there could be limited (unless or otherwise companies in the index post better than expected set of results for the quarter ended 31 December 2020 in the days and weeks ahead.)
Hang Seng Index (Hong Kong)

At the time of writing (at 11.40am on 05 February 2021), the Hang Seng Index is at 29,359.51 points, with the candlestick above all 5 moving averages. Also, in terms of the technical indicators, stochastic is in an uptrend (however, at this point in time I can’t really tell if it is about to reverse into a downtrend), and MACD is in a downtrend position.
The index’s major support line is at 27,235 points (where MA200 is.) Looking at how the index is moving, I am of the opinion that the index could move in either direction from here – either up towards the 30,000.00 level (and possibly even move higher), or down towards where MA20 is.
One thing to take note here is that, any worsening of condition as far as the number of community cases of Covid-19 is concerned, along with further announcements to restrict movements by the Hong Kong government could negatively impact the index’s movements.
S&P 500 Index (United States of America)

The S&P 500 Index closed at 3,871.75 points on 04 February 2021 (US time), with the candlestick above all 5 moving averages (just like the Hang Seng Index), with MACD on the verge of turning upwards into an uptrend position, and stochastic in an uptrend position (even though it is very close to “overbought” levels.) Another thing to note is that, the index is very close to its all-time high at 3,872.42 points.
I am optimistic that the index will once again test its current all-time high, and move higher from there (setting new highs.) As the earnings season is currently underway, with many companies releasing their latest quarterly results, a better-than-expected set of results and outlook ahead could see the index recording new highs. On the flip side, a weaker-than-expected set of results and outlook ahead could see the index moving down towards the major support line at 3,609 points (where MA20 is.)
Dow Jones Industrial Average Index (United States of America)

The Dow Jones Industrial Average Index closed at 31,055.9 points as at 04 February 2021 (US time), a whisker away from its all-time high at 31,272.2 points. The candlestick is above all 5 moving averages (just like the S&P 500 Index), with technical indicators MACD about to turn into an uptrend position and stochastic in an uptrend position.
In the near-term, I am of the opinion that the Dow Jones is likely to once again move up to its all-time high level (attained on 21 January 2021), and possibly move higher from there (creating a new all-time high level.)
Catalysts for further upside include a better-than-expected set of results and outlook for companies when they release their results n the days and weeks ahead; on the other hand, a weaker set of results and bleak outlook by the companies’ management in the year ahead may lead to the index moving down towards the major support line at 29,453 points (where MA20 is.)
NASDAQ Composite Index (United States of America)

Finally, let us have a look at the NASDAQ Composite Index. As at the end of the trading day on 04 February 2021 (US time) it closed at 13,777.7 points (the all-time high, which is also attained on the very same day, is at 13,778.4 points.)
Just like the other 2 indexes in the United States, its candlestick is currently above all 5 moving averages. Also, looking at the 2 technical indicators, both MACD and stochastic is in an uptrend position (with the former having just reversed into an uptrend position, while the latter in an “overbought” position.)
In my personal opinion, the index’s uptrend looks pretty much intact for now, and its highly likely that the index will create new all-time highs in the near-term, especially if companies in the index report a resilient set of financial results and outlook in the year ahead. However, on the other hand, should the companies report a poorer set of financial results and outlook ahead, then we could see the index moving down towards the 12,268 level (where MA20 is.)
In Conclusion
The US indexes certainly look very bullish at the moment, and personally, I am of the opinion that in the near-term, they are likely to move up higher (and in so doing, create new highs from there.)
As far as the Hang Seng Index is concerned, I feel it could move in either direction (it will very much depend on the condition of Covid-19 in the country). Finally, for the Straits Times Index, I am of the opinion that further climb above 2,943 points (where the most immediate resistance line is located) is slim, unless the index constituents (particularly the 3 big banks in DBS, UOB, and OCBC) report a resilient set of results and outlook for the year 2021 ahead – and this could act as a catalyst to give the index a strong upward push above the major resistance line.
With that, I’ve come to the end of my share on the indexes from the 3 countries. I hope you will find the share useful and here’s wishing you a great weekend ahead with your loved ones!
Are You Worried about Not Having Enough Money for Retirement?
You're not alone. According to the OCBC Financial Wellness Index, only 62% of people in their 20s and 56% of people in their 30s are confident that they will have enough money to retire.
But there is still time to take action. One way to ensure that you have a comfortable retirement is to invest in real estate investment trusts (REITs).
In 'Building Your REIT-irement Portfolio' which I've authored, you will learn everything you need to know to build a successful REIT investment portfolio, including a list of 9 things to look at to determine whether a REIT is worthy of your investment, 1 simple method to help you maximise your returns from your REIT investment, 4 signs of 'red flags' to look out for and what you can do as a shareholder, and more!

You can find out more about the book, and grab your copy (ebook or physical book) here...


Comments (0)