With business operations in over 100 countries (where Singapore is one of them), CBRE Group Inc. (NYSE:CBRE) is the world’s largest commercial real estate services and investment company (based on its revenue in 2019.) The company is also ranked #146 on the Fortune 500 in 2019.
The company is focused on providing services to:
- Real estate companies, where CBRE Group Inc. provides facilities management, project management, transaction (both property sales as well as leasing), and consulting services
- Investors, where CBRE Group Inc. provides capital markets (in property sales, mortgage origination, sales and servicing), leading, investment management, property management, as well as valuation and development services
Its revenue is generated from management fees (for large multi-year portfolio, and per-project contracts), and commissions on transactions. In terms of the company’s client base, I understand from its 2019 annual report that it comes from a highly diversified base of clients, including more than 90 of the Fortune 100 companies.
In the next few sections of this post about the real estate services and investment firm, you’ll find its historical financial performance (over a 5-year period between FY2015 and FY2019, as well as for the first 9-months of the current financial year 2020, compared to the same time period last year), its debt profile and dividend payout (again over a 5-year period), and finally, whether or not the company’s current share price is considered ‘cheap’ or ‘expensive’ (based on its current valuations vs. its 5-year average, as well as based on its intrinsic value.)
Let’s begin…
CBRE Group Inc.’s Financial Performance
CBRE Group Inc has a financial year-end every 31 December.
In this section, you will find the NYSE-listed company’s financial performance recorded over the past 5-years (between FY2015 and FY2019), as well as for the first 9-months of the current financial year 2020 (compared against the first 9-months of the previous financial year 2019):
Between FY2015 and FY2019:
Total Revenue & Net Profit (USD’mil):
| FY2015 | FY2016 | FY2017 | FY2018 | FY2019 | |
| Total Revenue (USD’mil) | $10,856m | $17,369m | $18,629m | $21,340m | $23,894m |
| Net Profit (USD’mil) | $559m | $573m | $697m | $1,063m | $1,282m |

I like the company for the fact that both its top- (total revenue) as well as its bottom- (net profit) line saw year-on-year (y-o-y) growth every single year for the past 5 years, where the compound annual growth rate (CAGR) in its total revenue was at 17.1%, while the CAGR in its net profit was at 18.1%.
Gross & Net Profit Margin (%):
| FY2015 | FY2016 | FY2017 | FY2018 | FY2019 | |
| Gross Profit Margin (%) | 34.8% | 22.7% | 23.2% | 22.9% | 21.8% |
| Net Profit Margin (%) | 5.1% | 3.3% | 3.7% | 5.0% | 5.4% |

The company’s gross profit margin seem to be on a downward decline over the past 5 years, where it fell from a high of 34.8% in FY2015 to a low of just 21.8% in FY2019. Personally, I will be concerned if the decline continues, to the extent where it breaks below 20.0%.
On the other hand, its net profit margin have improved over the years since falling to a low of 3.3% in FY2016. In fact, the company’s net profit margin, at 5.4% in FY2019, was the highest recorded over a 5-year period.
Return on Equity (%):
| FY2015 | FY2016 | FY2017 | FY2018 | FY2019 | |
| Return on Equity (%) | 20.6% | 19.0% | 16.9% | 21.5% | 20.6% |

Over the years, the company’s Return on Equity (RoE) has been inconsistent. However, I note that it has stayed above 15.0% in all of the 5 years I have looked at (in general, RoEs of between 15.0% and 20.0% is considered ideal.)
9M FY2019 (ended 30 September 2019) vs. 9M FY2020 (ended 30 September 2020):
After looking at the company’s financial performance over the past 5 years, let us now have a look at its financial performance for the first 9-months of the current financial year, compared to the previous financial year:
| 9M FY2019 | 9M FY2020 | % Variation | |
| Total Revenue (USD’mil) | $16,775m | $16,915m | +0.8% |
| Net Profit (USD’mil) | $648m | $438m | -32.1% |
| Gross Profit Margin (%) | 21.6% | 19.1% | -2.5pp |
| Net Profit Margin (%) | 3.8% | 2.6% | -1.2pp |
The ongoing Covid-19 pandemic have stalled CBRE Group Inc.’s consistent growth over the past 5 years in their tracks – while its top-line edged up by 0.8%, its bottom-line slumped by 32.1% on a y-o-y basis.
Likewise, its gross and net profit margins also fell on a y-o-y basis no thanks to the pandemic – of particular concern is its gross profit margin, where it fell under 20.0%. I will continue to monitor this particular statistic in the quarters ahead.
CBRE Group Inc’s Debt Profile between FY2015 and FY2019
Apart from a company’s financial performance, another area I focus my attention on (when studying a company) is its debt profile, where my preference is towards companies with minimal or no debt, as well as one that is in a net cash position.
Let us take a look at CBRE Group Inc.’s debt profile over the past 5 financial years below:
| FY2015 | FY2016 | FY2017 | FY2018 | FY2019 | |
| Cash & Cash Equivalents at the End of Period (USD’mil) | $540m | $831m | $825m | $864m | $1,094m |
| Total Borrowings (USD’mil) | $4,376m | $3,803m | $2,911m | $3,096m | $2,743m |
| Net Cash/ Debt (USD’mil) | -$3,856m | -$2,972m | -$2,086m | -$2,232m | -$1,649m |
| Current Ratio | 1.1 | 1.1 | 1.2 | 1.2 | 1.2 |
My Observations: Even though the company is in a net debt position over the 5 years I have looked at, but over the years, I’ve noted that its total borrowings have been coming down.
Another thing to note is the company’s current ratio (which measures its ability to pay off any short-term debt obligations, where a ratio of above 1.0 implies the company have no problem in doing so) where over the past 5 years, it has been consistently maintained at above 1.0.
CBRE Group Inc.’s Dividend Payout to Shareholders
The company has not paid out any dividends to its shareholders over the years, hence there is nothing to report here.
Is the Current Share Price of CBRE Group Inc. Considered ‘Cheap’ or ‘Expensive’?
One of the ways I use to determine or not a company’s current share price is considered ‘cheap’ or ‘expensive’ is to take its current valuations (based on its current share price), and compare against its historical average.
The following is CBRE Group Inc.’s P/E and P/B ratios I’ve computed over the past 5 years, along with their averages:
| FY2015 | FY2016 | FY2017 | FY2018 | FY2019 | Average | |
| P/E Ratio | 21.2 | 18.6 | 21.1 | 12.9 | 16.3 | 18.0 |
| P/B Ratio | 4.3 | 3.5 | 3.6 | 2.7 | 3.3 | 3.5 |
At the time of writing, the share price of CBRE Group Inc. was trading at US$65.74, and as such, its current valuations are as follows (taken from ShareInvestor WebPro):
P/E ratio: 20.5
P/B ratio: 3.4
Comparing its current valuations against its 5-year average, it seems that the current share price of CBRE Group Inc. is considered to be slightly on the ‘expensive’ side, due to its higher-than-average current P/E ratio (even though its current P/B ratio is slightly lower compared to its 5-year average.)
Finally, let us take a look at the company’s intrinsic value which I’ve taken from ShareInvestor WebPro:
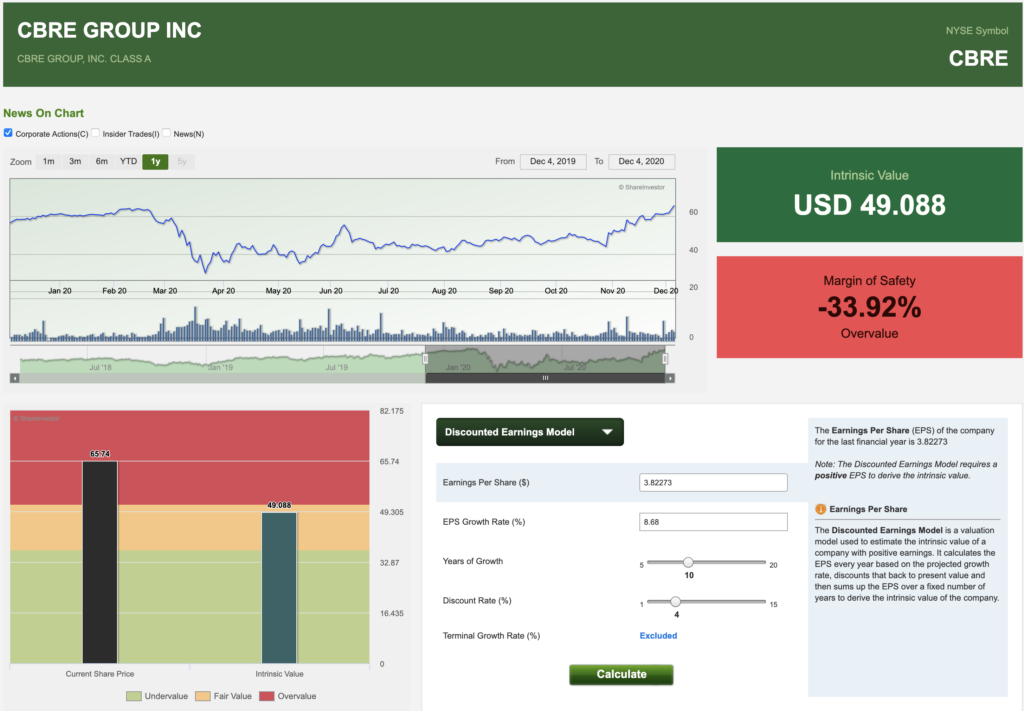
As you can see from the image above, the current share price of CBRE Group Inc. is considered overvalued.
In Conclusion
The company’s consistent top- and bottom-line growth over the years have been stopped on its tracks by the ongoing Covid-19 pandemic.
One particular statistic that is of concern to me is its gross profit margin, which has been on a declining trend over the years. Also, as a result of the ongoing pandemic, the first 9 months of FY2020 have seen its gross profit margin fallen to under 20.0%.
In terms of its current share price, both its valuations and intrinsic value suggests that it is ‘expensive’ at the moment.
With that, I have come to the end of my share about the real estate services and investment firm. Do take note that everything you have just read above (including my personal opinions), are purely for educational purposes only, and they do not imply any buying or selling recommendations for the company’s shares. As always, please do your own due diligence before you make any investment decisions.
Disclaimer: At the time of writing, I am not a shareholder of CBRE Group Inc.
Stop Spending Hours Reading REIT Reports Every Quarter!
What if you could assess a REIT's portfolio occupancy, debt profile, valuation, and overall health in less than 30 seconds - without having to comb through a single quarterly report?
That's the problem the REIT Screener was built to solve.
Developed through a collaboration between ShareInvestor and The Singaporean Investor, the REIT Screener consolidates many of the key metrics and indicators I personally use when analysing REITs into one easy-to-use platform. Instead of spending hours extracting data manually every earnings season, you can now monitor the REITs you own and research new opportunities in just a few clicks.
If you're serious about REIT investing but don't have the time to manually track quarterly developments, the REIT Screener could be the shortcut you've been looking for:

Take a closer look at the REIT Screener here...


Comments (0)