[Update as at 12 August 2021 – Please note that the collaboration between The Singaporean Investor and ShareInvestor Pte Ltd has been ceased, and I have since removed all sign up links on this page. Thank you.]
After speaking to many readers of The Singaporean Investor, one of the things I often hear about is that, most do not have the time to go through a particular company’s annual reports to study about it due to time constraints (as many are working full-time and after a long day of work, many are just too tired to go through a company’s thick annual reports.) As such, most of them make their investment decisions based on ‘hearsay’ or recommendations from their brokers, which is something I do not recommend, as different people invest in a company for different reasons, and that a company may make a good investment for one person doesn’t mean it will make a good investment for another.
So, how can you learn more about a particular company without going through their annual reports? One quick and easy way to do so is to make use of ShareInvestor’s WebPro platform.
What I like about this platform is the wealth of information it provides about a company, which can really help one to learn more about a company and hence, be able to help you make a more informed decision. However, if you are new to investing, you may find the amount of information available overwhelming. Not to worry, as in today’s post, I’ll be sharing with you the most important statistics you should focus your attention on to learn the essentials about a company (which can help you better decide whether or not you should invest in it.) I will also be showing you how you can find out whether or not a company’s current share price is considered ‘cheap’ or ‘expensive’ based on its current vs. its historical valuations.
Let’s get started…
Key Financial Statistics of a Company
I’ll be using Sheng Siong Group Limited (SGX:OV8) as an example in this post. The supermarket chain provider have benefitted from the ongoing Covid-19 pandemic – where the two-month circuit breaker period, as well as a continued work from home scheme resulted in an increase in demand for fresh produces and groceries, and as such, the company’s financial results this year improved significantly (compared to the year before.)
But, how has the company performed in the years prior? In ShareInvestor’s WebPro platform, you have the option to study about the company’s results for the past 10 years (just go to ‘Fundamental’ in the menu bar on top, followed by ‘Financials’):
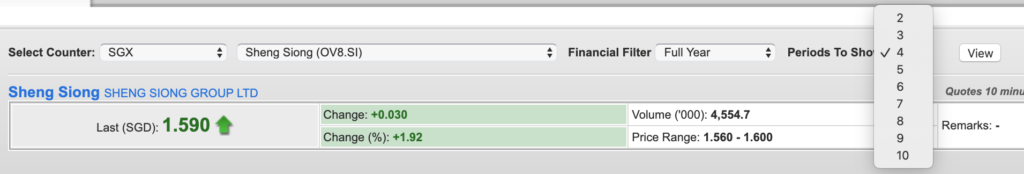
For simplicity sake, let us look at the company’s results over the past 5-years (you will need to choose ‘6’, as it also includes statistics for the ‘Trailing 12M’, which I will ignore, as I focus on just its full-year results):

When it comes to long-term investing, my preference is towards companies that are able to record year-on-year (y-o-y) improvements in its revenue, net earnings (also known as net profit), and profit attributable to shareholders over the years. Looking at these 3 statistics (which I’ve highlighted in red rectangular boxes in the screenshot above), Sheng Siong fulfils this selection criteria of mine.
Next, under ‘Profitability Ratios’ section (you can scroll down the same page for it), I will look at the company’s gross and net profit margin to find out whether it has increased, remained consistent, or decreased over the years (I prefer to invest in companies that are able to increase their gross and net profit margins, if not they should at least maintain them):
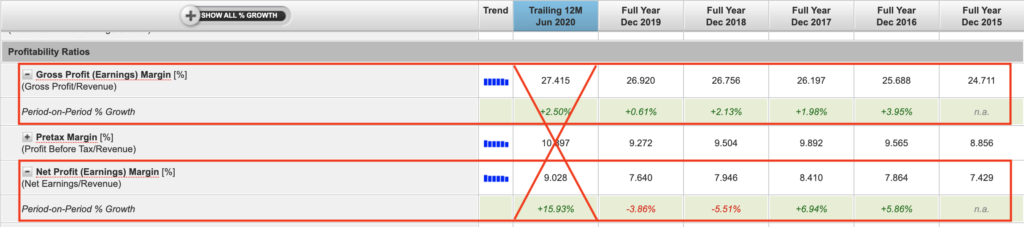
As you can see from the screenshot above, Sheng Siong have managed to maintain its gross profit margin at around 24-26% (which fulfils my selection criteria.) However, its net profit margin have slipped in 2 successive years (in FY2018 as well as in FY2019.) But over the years, its net profit margin have been hoovering around the 7+% range, which is still considered pretty consistent as well (and it passes my selection criteria too.)
Finally, another statistic I look at in terms of a company’s financial performance is its return on equity (or ROE), which in layman terms, is the amount of profit (in percentage terms) the company is able to generate for every dollar of shareholders’ money it uses in its business. You can find this statistic under the section ‘Management Efficiency Ratios’:

For a company’s ROE, my preference is towards companies that are able to record improvements over the years, or at least remain consistent (any percentage above 15.0% is considered ideal.)
Looking at Sheng Siong’s ROE over the years, no doubt it has fallen in FY2018 and FY2019, but over the past 5 years, it has hoovered around the 23+% and 24+% range, which is pretty consistent as well and hence, it passes my selection criteria.
Debt Profile of a Company
If you have been following my company writeups, you will notice that whenever I look at a company, apart from its financial performance, I also look at its debt profile, where my preference is towards companies that are either in a ‘net cash’ position (if not, one with minimal debt.)
In ShareInvestor’s WebPro platform, I focus on two statistics found under the‘Leverage Ratios’ section (which can be found near the bottom of the page), namely ‘Net Debt to Equity’, as well as ‘Interest Coverage.’
Let us now take a look at these two statistics for Sheng Siong Group over the past 5 years:

Notice Sheng Siong’s net debt to equity recorded over the years – they’re recorded as ‘Net Cash’ for all of the 5 years I’ve looked at, which passes my selection criteria. Personally, I will be careful of investing in companies with their net debt to equity on an upward moving trend, particularly those above 2.0, as a company could potentially be taking on more debts than it can afford to (which is a potential red flag.)
Another statistic I look at is the company’s ‘Interest Coverage.’ In layman terms, it is a measure of a company’s ability to fulfil its interest obligations for its borrowings. As such, the higher this statistic is, the better it is. On the other hand, I’d be concerned if this statistic has declined over the years. Looking at Sheng Siong’s interest coverage, it fulfils my selection criteria.
Dividend Payout to Shareholders
When investing in a company, apart from the potential capital appreciation we can enjoy (where the share price of the company goes up over the years), we also look at its dividend payouts. Personally, I would prefer to invest in companies that is able to increase its dividend payouts over the years.
You can learn about a company’s dividend payouts over the years via the ‘Dividend Analysis’ section:

The following is Sheng Siong’s dividend payouts to its shareholders over the last 5 years:

I focus my attention on 2 statistics – ‘Total Dividend Per Share’ (which is the amount of dividends that the company have declared every year for every share you have), as well as ‘Dividend Payout Ratio’ (which is the percentage of earnings the company have paid out to its shareholders as dividends.)
Looking at Sheng Siong’s dividend payout over the years, it has somewhat remained consistent at 3+ cents/share. Also, from its dividend payout ratio over the years, I learn that the company tend to payout a majority of its earnings to its shareholders as dividends (70% and above.)
Finally, if you scroll all the way down, you will notice the company pays out its shareholders on a semi-annual basis – once in the second quarter and once in the fourth quarter:

Is the Current Share Price Considered ‘Cheap’ or ‘Expensive’?
Finally, let us find out whether or not a company’s current traded price is considered ‘cheap’ or ‘expensive’ by comparing its current valuations (based on its current share price) against its historical valuations.
You can find out all these figures via ShareInvestor’s WebPro platform by going to the ‘Valuation Ratios (Historical)’ section (which can be found in the ‘Fundamental’ -> ‘Financials’ page.) I look at 3 ratios – particularly its ‘Basic Price Earnings Ratio (PER)’ (also known as P/E ratio), ‘Price/NAV’ (also known as P/B ratio), as well as ‘Dividend Yield including Special Dividend – Historical [%]’:

You will need to do some manual calculations here to find out their average over the last 5 years:
P/E ratio: 21.76 (the average of 21.64, 22.47, 20.50, 21.85, and 22.34)
P/B ratio: 5.32868 (the average of 4.0369, 5.5907, 5.2833, 5.3316, and 5.4009)
Dividend yield: 3.6422% (the average of 4.279%, 4.002%, 3.470%, 3.304% and 3.156%)
To find out a company’s current valuations, you can go to ‘Fundamental’ -> ‘Factsheet’ section, and locate the section ‘Key Statistics’:

Sheng Siong’s current valuations, based on its current traded price of S$1.59 (at the time of writing) is as follows:
P/E ratio: 31.566
P/B ratio: 6.1604
Dividend yield: 2.233%
Now, if you compare its current valuation against its 5-year average, it seems that Sheng Siong’s current traded price is considered ‘expensive’ due to its current P/E and P/B ratios being higher than its average, and at the same time its current dividend yield being lower than its average.
In Conclusion
As you can see from the sections above, using the ShareInvestor WebPro platform, you can learn about the essentials about a company with minimal time.
I hope you find that so-called ‘step-by-step’ guide on how you can use the platform to conduct a company research useful.
Are You Worried about Not Having Enough Money for Retirement?
You're not alone. According to the OCBC Financial Wellness Index, only 62% of people in their 20s and 56% of people in their 30s are confident that they will have enough money to retire.
But there is still time to take action. One way to ensure that you have a comfortable retirement is to invest in real estate investment trusts (REITs).
In 'Building Your REIT-irement Portfolio' which I've authored, you will learn everything you need to know to build a successful REIT investment portfolio, including a list of 9 things to look at to determine whether a REIT is worthy of your investment, 1 simple method to help you maximise your returns from your REIT investment, 4 signs of 'red flags' to look out for and what you can do as a shareholder, and more!

You can find out more about the book, and grab your copy (ebook or physical book) here...


Comments (18)