Yesterday, I have taken a look at the digital payment company Visa (NYSE:V) – you can read the post here in case you’ve missed it.
Today, let us take an in-depth look at its direct competitor, Mastercard Incorporated (NYSE:MA).
Just like Visa, Mastercard Incorporated is also in the business of connecting consumers, financial institutions, merchants, governments, digital partners, businesses and other organisations worldwide, enabling them to use electronic forms of payment through their family of well-known brands, including Mastercard, Maestro, and Cirrus.
Currently, the company’s payment network spans more than 150 currencies and in over 210 countries and territories. Their core products include:
(i) Consumer Credit – where there are a number of programs available to provide consumers with credit that allow them to defer payment
(ii) Consumer Debit – which can be used to make purchases, as well as obtain cash in bank branches, at ATMs, and also at point of sales
(iii) Prepaid – a type of electronic payment that allows consumers to pay in advance, regardless of whether they have a bank account or credit history
(iv) Commercial – provides payment products and solutions that help large corporations, midsize companies, small businesses. and government entities
In the remainder of this post, you will read about the NYSE-listed company’s historical financial performance, debt profile, as well as dividend payout over a 5-year period (between FY2015 and FY2019 – the company has a financial year-end every 31 December), its current year results so far (compared against the previous year), and finally, a look at whether the current share price is deemed to be cheap or expensive.
Let’s begin…
Historical Financial Performance of Mastercard Incorporated between FY2015 and FY2019
As mentioned earlier, the company has a financial year-end every 31 December. In this section, let us take a look at its financial performance over the past 5 years, between FY2015 and FY2019:
Total Revenue and Net Profit (USD’mil):
| FY2015 | FY2016 | FY2017 | FY2018 | FY2019 | |
| Total Revenue (USD’mil) | $9,667m | $10,776m | $12,497m | $14,950m | $16,883m |
| Net Profit (USD’mil) | $3,808m | $4,059m | $3,915m | $5,859m | $8,118m |

Over a 5-year period, Mastercard Incorporated’s total revenue saw a steady growth – from US$9,667m in FY2015 to US$16,883m in FY2019, with improvements made every single year, and a compound annual growth rate (or CAGR) of 11.8%.
Its net profit saw year-on-year (y-o-y) growth in 4 out of 5 years (the exception was in FY2017, where its net profit saw a 3.5% y-o-y decline to US$3,915m), and a CAGR of 16.3% – pretty impressive growth rate in my opinion.
Net Profit Margin (%):
The following is Mastercard Incorporated’s net profit margin I’ve calculated:
| FY2015 | FY2016 | FY2017 | FY2018 | FY2019 | |
| Net Profit Margin (%) | 39.4% | 37.7% | 31.3% | 39.2% | 48.1% |
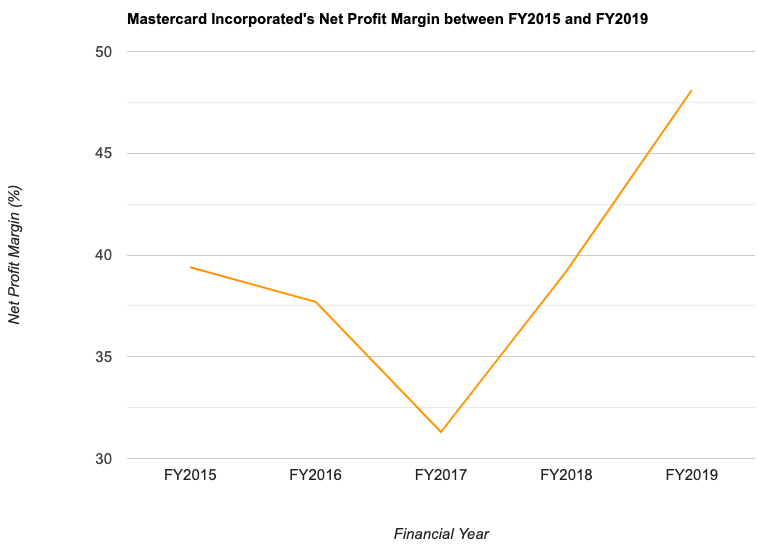
While the company’s net profit margin declined from 39.4% in FY2015 to a low of 31.3% in FY2017, it saw improvements in subsequent years, and at 48.1% in FY2019, it was also the highest recorded over a 5-year period (which I have looked at.)
Return on Equity (%):
In layman terms, Return on Equity (or RoE) is a measure of profitability (in percentage terms) the company is able to generate for every dollar of shareholders’ money it uses in its businesses – if the company has an RoE of 15.0%, it means the company is able to generate a profit of $15 for every $100 of shareholders’ money it uses.
The following table is Mastercard Incorporated’s RoE I’ve calculated:
| FY2015 | FY2016 | FY2017 | FY2018 | FY2019 | |
| Return on Equity (%) | 63.2% | 71.8% | 71.6% | 108.6% | 137.8% |

Apart from a slight 0.2 percentage point y-o-y dip in FY2017, the other years saw the digital payment company’s RoE recording strong growth – over the years, it has gone up from 63.2% in FY2015 to a very impressive 137.8% in FY2019.
Debt Profile of Mastercard Incorporated between FY2015 and FY2019
Besides studying a company’s financial results over the years, another area I focus my attention on when researching about a company is its debt profile – where my preference is towards companies with minimal or no debt, one that is in a net cash position, and also one that has a current ratio above 1.0 (meaning the company is able to fulfil its short-term debt commitments.)
So, does Mastercard Incorporated’s debt profile fulfil these three requirements of mine? Let us take a look below:
| FY2015 | FY2016 | FY2017 | FY2018 | FY2019 | |
| Cash & Cash Equivalents as at End of Period (USD’mil) | $5,747m | $8,273m | $7,592m | $8,337m | $8,969m |
| Total Borrowings (USD’mil) | $3,268m | $5,180m | $5,424m | $5,834m | $8,527m |
| Net Cash/ Debt (USD’mil) | +$2,479m | +$3,093m | +2,168m | +$2,503m | +$442m |
| Current Ratio | 1.8 | 1.8 | 1.6 | 1.4 | 1.4 |
Over the past 5 financial years, even though its cash and cash equivalents have gradually increased, its total borrowings have gone up significantly as well.
While the company is in a net cash position in all the 5 years I have looked at, but looking at its net cash position in FY2019, it has fallen significantly compared to the previous year. Should its total borrowings continue to go up, the company is likely going to reverse into a net debt position.
Finally, while the current ratio have been maintained at above 1.0 throughout the years, but it is in a declining trend as well.
Mastercard Incorporated’s Dividend Payout to Shareholders between FY2015 and FY2019
The management of Mastercard Incorporated declares a dividend payout to its shareholders on a quarterly basis. However, do take note that if you are a Singaporean investing in US-listed companies, all dividend payouts are subjected to a 30.0% withholding tax – meaning all dividends you eventually receive will be 30.0% less than what was declared.
The following table is the digital payment company’s dividend payout to shareholders over the past 5 years, along with its payout ratio:
| FY2015 | FY2016 | FY2017 | FY2018 | FY2019 | |
| Dividend Per Share (USD/share) | 67.0 cents | 79.0 cents | 91.0 cents | 108.0 cents | 139.0 cents |
| Dividend Payout Ratio (%) | 20.0% | 21.4% | 24.9% | 19.3% | 17.5% |

Mastercard Incorporated’s dividend payouts have been on a rise over the years – from 67.0 cents/share in FY2015 to 139.0 cents/share in FY2019, a CAGR of 15.7% over a 5-year period.
Its payout ratio have been maintained at below 25.0% over the years – meaning the company distributes no more than 25.0% of its earnings to its shareholders as dividends.
Personally, with its payout ratio at just 17.5% in FY2019, I am of the opinion that the company has the ability to further increase its dividend payout to its shareholders in the years to come, just like how it has progressively increased its dividend payout in the past 5 financial years.
Mastercard Incorporated’s Current Year Performance (1H FY2020) vs. the Previous Year (1H FY2019)
In this section, let us take a look at the company’s performance so far this year – for the first half of FY2020 ended 30 June 2020, compared against its performance for the same time period last year (i.e. 1H FY2019):
| 1H FY2019 | 1H FY2020 | % Variance | ||
| Total Revenue (USD’mil) | $8,002m | $7,344m | -8.2% | |
| Net Profit (USD’mil) | $3,910m | $3,113m | -20.4% | |
| Net Profit Margin (%) | 48.9% | 42.4% | – | |
| Cash & Cash Equivalents as at End of Period (USD’mil) | $7,445m | $13,302m | +78.7% | |
| Total Borrowings (USD’mil) | $7,806m | $12,498m | +60.1% | |
| Net Cash/ Debt (USD’mil) | -$361m | +$804m | – | |
| Dividend Per Share (USD/share) | 66.0 cents | 80.0 cents | +21.2% |
Due to the negative impacts on the global economy as a result of the ongoing Covid-19 pandemic, the company reported a weaker set of results for 1H FY2020 compared to the previous year.
However, compared to last year, the company have reversed from a net debt position to a net cash position, due to a higher percentage growth in its cash and cash equivalent. Also, its dividends per share have also gone up by 21.2% on a y-o-y basis to 80.0 cents/share (from 66.0 cents/share in 1H FY2019.)
Is the Current Share Price of Mastercard Incorporated Considered Cheap or Expensive?
One of the ways I use to find out whether or not the current share price of a company is considered cheap or expensive is to compare its current valuations (based on its current share price) against its average.
With that, let us take a look at Mastercard Incorporated’s historical valuations (which I have computed) over the last 5 years, along with its average:
| FY2015 | FY2016 | FY2017 | FY2018 | FY2019 | Average | |
| P/E Ratio | 29.1 | 28.0 | 41.5 | 33.7 | 37.6 | 34.0 |
| P/B Ratio | 22.5 | 25.4 | 38.6 | 48.9 | 71.0 | 41.3 |
| Dividend Yield | 0.7% | 0.8% | 0.6% | 0.6% | 0.5% | 0.6% |
At the time of writing, the current share price of Mastercard Incorporated is trading at US$327.85 (as at close on 21 September.) As such, its current valuations are as follows:
P/E ratio: 44.8
P/B ratio: 50.7
Dividend Yield: 0.4% (calculated based on a dividend payout of US$1.39/share in FY2019)
Looking at its current vs. its 5-year historical average valuations, it seems that Mastercard Incorporated is currently trading at premium pricing, due to its higher-than-average current P/E and P/B ratios, along with a lower-than-average current dividend yield.
In Conclusion
To summarise, some of the aspects about Mastercard Incorporated I fancy include its improving top- and bottom-line over the years, its steadily rising dividend payout to shareholders, along with the company being in a net cash position throughout the past 5 financial years I have looked at.
At the same time, however, I am wary of its increasing borrowings over the years, and the fact that its net cash position in FY2019 have shrunken significantly compared to the previous year.
Finally, as far as the company’s results for the remaining quarters of the current financial year are concerned, my personal take is that it is likely to be a weaker one compared to last year due to the negative impacts of the ongoing Covid-19 pandemic on the global economy (and as such, more people have decided to tighten their wallets.)
With that, I have come to the end of my post on Mastercard Incorporated today. I hope you find the contents above useful. Do take note that this sharing is purely for educational purposes only, and they do not imply any buying or selling recommendations for the company’s shares. Please do your own due diligence before you make any investment decisions.
Disclaimer: At the time of writing, I am a shareholder of Mastercard Incorporated.
Are You Worried about Not Having Enough Money for Retirement?
You're not alone. According to the OCBC Financial Wellness Index, only 62% of people in their 20s and 56% of people in their 30s are confident that they will have enough money to retire.
But there is still time to take action. One way to ensure that you have a comfortable retirement is to invest in real estate investment trusts (REITs).
In 'Building Your REIT-irement Portfolio' which I've authored, you will learn everything you need to know to build a successful REIT investment portfolio, including a list of 9 things to look at to determine whether a REIT is worthy of your investment, 1 simple method to help you maximise your returns from your REIT investment, 4 signs of 'red flags' to look out for and what you can do as a shareholder, and more!

You can find out more about the book, and grab your copy (ebook or physical book) here...


Comments (0)