In the midst of the Covid-19 pandemic, many companies have saw their business performances deteriorated (especially those in the aviation and in the tourism related industries which have suffered the most.)
That said, it is not doom and gloom for all the companies – there still remain some companies that still manage to record growth despite the ongoing pandemic – one of which being Sheng Siong Group Limited (SGX:OV8) – the supermarket chain saw its revenue and net profit attributable to shareholders for the first half of the financial year 2020 skyrocket 52.7% and 98.0% on a year-on-year (y-o-y) basis respectively – the improvements in its top- and bottom-line can be attributed to the panic buying in the early half of the year when the DORSON level was upgrade to ‘Orange’, as well as the two-month circuit breaker period implemented by the Singapore government to contain the community spread of the virus.
Moving forward, even though we are now in Phase Two of the safe transition, with dining-in allowed once again, but the fact that a majority of Singapore’s workforce are still working from home will result in them continuing to prepare their meals at home and as such, I foresee Sheng Siong to continue reporting y-o-y improvements in its results for the remaining quarters of the financial year.
That said, this is not the sole reason why this company is in my ‘shopping list’. Its improving financial performance, solid debt profile, as well as dividend payouts to shareholders over the years (all of which I will be talking about in more detail in this post) are also reasons why the supermarket chain caught my eye.
Before I dive into the statistics, here’s a brief introduction about the company:
Brief Introduction about Sheng Siong Group Limited
What started out as a single rented stall at one of the now-defunct supermarket chain stores in Ang Mo Kio to sell chilled pork has grown to become one of Singapore’s top supermarket chains today, with more than 60 stores (and counting) islandwide.
Apart from Singapore, Sheng Siong Group have also expanded its operations to China – where they now have 2 stores in Kunming.
The supermarket chain became a listed company back in 17 August 2011 at an IPO price of S$0.33. Today (based on its closing price on 20 August 2020), its share price have appreciated multi-folds to S$1.76. If you have subscribed to the shares of the company during its IPO and remained as a shareholder, you are now sitting on a capital gain of more than 400%!
Historical Financial Performance of Sheng Siong Group Limited between FY2012 and FY2019
In this section, we will be taking a look at some of the key financial figures reported by the company over the past 8 financial years – between FY2012 and FY2019:
Revenue, and Net Profit Attributable to Shareholders (S$’mil):
| Financial Year | FY 2012 | FY 2013 | FY 2014 | FY 2015 |
| Revenue (S$’mil) | $637.3m | $687.4m | $726.0m | $764.4m |
| Net Profit Attributable to Shareholders (S$’mil) | $41.7m | $38.9m | $47.6m | $56.8m |
| Financial Year | FY 2016 | FY 2017 | FY 2018 | FY 2019 |
| Revenue (S$’mil) | $796.7m | $829.9m | $890.9m | $991.3m |
| Net Profit Attributable to Shareholders (S$’mil) | $62.7m | $69.5m | $70.5m | $75.8m |

As you can see from the numbers above, over a period of 8 financial years I have looked at, its top-line have gone up every single year, and registered a compound annual growth rate (or CAGR) of 5.7%.
Looking at its bottom-line growth, other than a slight blip in FY2013, all the remaining 7 years saw y-o-y improvements. Over a 8 year period, its net profit attributable to shareholders grew at a CAGR of 7.8%.
Gross Profit Margin and Net Profit Margin (%):
The following table is Sheng Siong Group’s gross and net profit margins which I have computed:
| Financial Year | FY 2012 | FY 2013 | FY 2014 | FY 2015 |
| Gross Profit Margin (%) | 22.1% | 23.0% | 24.2% | 24.7% |
| Net Profit Margin (%) | 6.5% | 5.7% | 6.6% | 7.4% |
| Financial Year | FY 2016 | FY 2017 | FY 2018 | FY 2019 |
| Gross Profit Margin (%) | 25.7% | 26.2% | 26.8% | 26.9% |
| Net Profit Margin (%) | 7.9% | 8.4% | 7.9% | 7.6% |
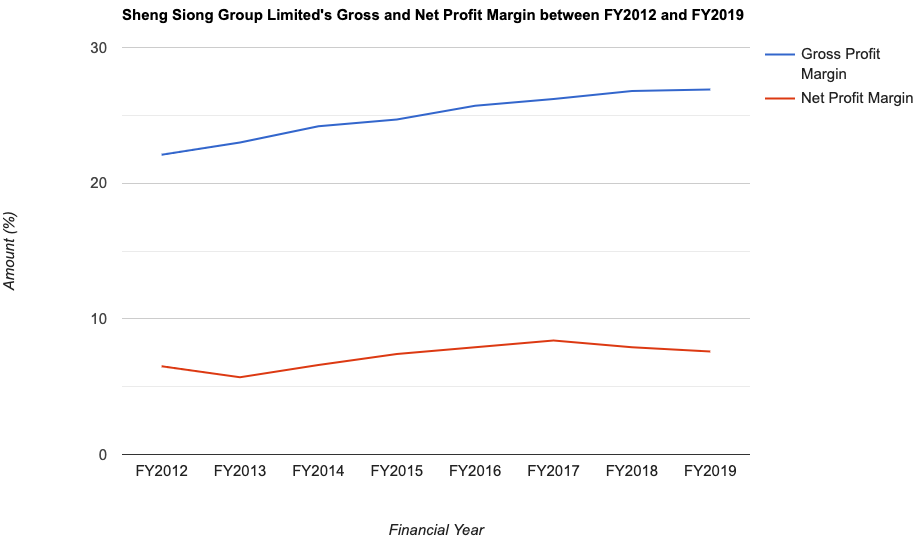
Sheng Siong Group’s gross profit margin have risen steadily over the years – what I like about it is that the Group was able to record improvements in its gross profit margin every single year over the past 8 financial years.
However, as for its net profit margin, while it has went up steadily from 5.7% in FY2013 to 8.4% in FY2017, it has recorded y-o-y declines in the subsequent years.
Return on Equity (%):
For those who are not familiar with what Return on Equity (or RoE) is, in layman terms, it is a calculation of how much profits a company generates (in percentage terms) for every dollar of shareholders’ money it uses in its businesses. For instance, if a company’s RoE is 15.0%, it means to say the company managed to generate a profit of $15 for every $100 of shareholders’ money it uses.
Now that you have an idea of what RoE is, let us now take a look at Sheng Siong Group’s RoE between FY2012 and FY2019 which I have computed:
| Financial Year | FY 2012 | FY 2013 | FY 2014 | FY 2015 |
| Return on Equity (%) | 27.5% | 26.0% | 20.1% | 23.3% |
| Financial Year | FY 2016 | FY 2017 | FY 2018 | FY 2019 |
| Return on Equity (%) | 24.9% | 25.8% | 24.4% | 24.2% |
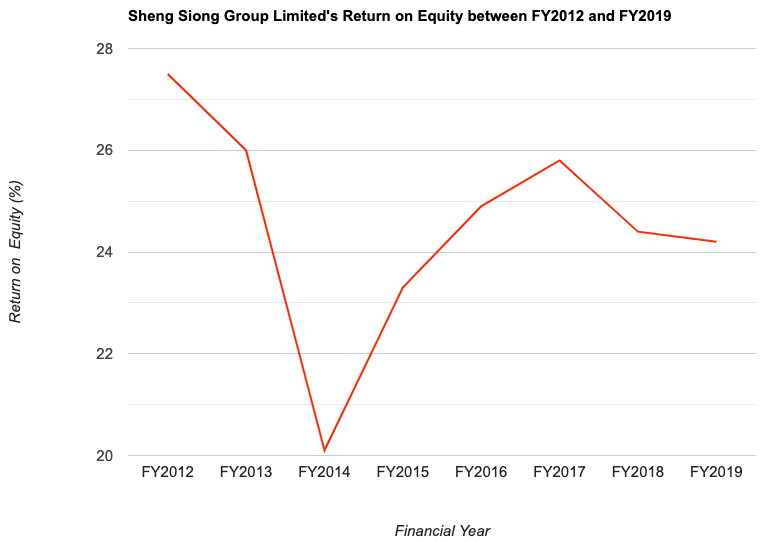
Sheng Siong has managed to retain its RoE at above 20.0% in all 8 years we have looked at. However, in-line with its net profit margin, its RoE have slipped on a y-o-y basis in both FY2018 as well as in FY2019.
Debt Profile of Sheng Siong Group between FY2012 and FY2019
One thing I like about the supermarket chain is that it does not have any borrowings in all of the 8 financial years I have looked at.
This is one of the reasons why the company is in my ‘shopping list’, as my personal preference is towards investing in companies with very little or no borrowings.
Dividend Payout to Shareholders between FY2012 and FY2019
Finally, let us have a look at Sheng Siong Group’s dividend payout to shareholders over the past 8 years in this section.
The Group declares a dividend payout to shareholders on a half-yearly basis – once when they release their second quarter results (known as interim dividend), and once when they release their fourth quarter results (known as final dividend.)
The following table illustrates Sheng Siong’s dividend payout to shareholders over the past 9 financial years – between FY2012 and FY2019, along with their dividend payout ratios:
| Financial Year | FY 2012 | FY 2013 | FY 2014 | FY 2015 |
| Dividend Per Share (S$’cents) | 2.75 cents | 2.60 cents | 3.0 cents | 3.5 cents |
| Dividend Payout Ratio (%) | 91.4% | 92.5% | 89.8% | 92.6% |
| Financial Year | FY 2016 | FY 2017 | FY 2018 | FY 2019 |
| Dividend Per Share (S$’cents) | 3.75 cents | 3.30 cents | 3.40 cents | 3.55 cents |
| Dividend Payout Ratio (%) | 89.9% | 71.1% | 72.3% | 70.4% |
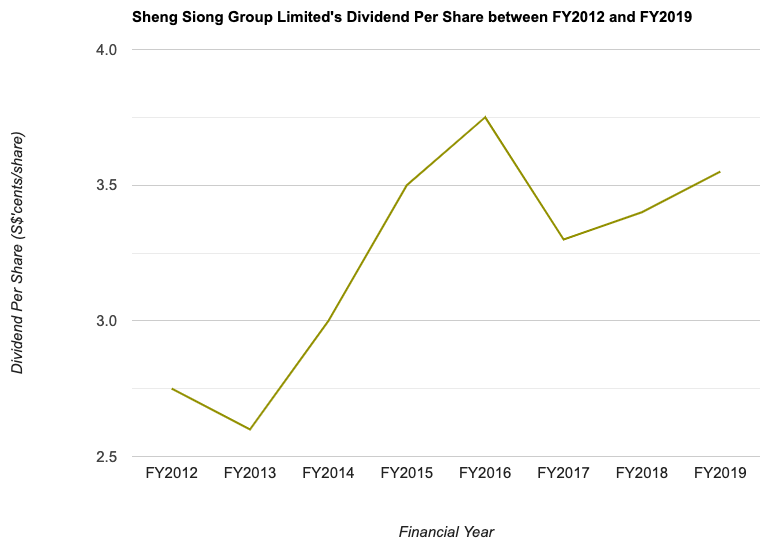
Over the past 8 years, Sheng Siong’s dividend payout to shareholders have grown at a CAGR of 3.2%, and looking at its dividend payout ratio, it seems the company has a habit of giving out a majority of its earnings back to shareholders in a form of dividends.
Is Sheng Siong Group’s Current Share Price Considered Cheap/Expensive Currently?
One of the ways I use to determine whether or not the current share price of a company is considered cheap or expensive is to compare its current valuations (based on its current share price) against its average.
At the time of writing, the share price of Sheng Siong Group is trading at S$1.79, and its current valuations is as follows:
P/E ratio: 23.9
P/B ratio: 6.9
Dividend Yield: 2.0% (computed based on its total dividend payout of 3.55 cents/share in FY2019)
The Group’s 8-year average valuation (between FY2012 and FY2019) which I have computed is as follows:
P/E ratio: 21.5
P/B ratio: 5.3
Dividend Yield: 3.9%
Comparing its current vs. its average valuations, Sheng Siong’s current share price is considered to be trading at a premium – due to its higher-than-average current P/E and P/B ratios, along with a lower-than-average current dividend yield.
In Conclusion
I am of the opinion that supermarket chains is a defensive business, and I am confident of its growth in the years to come; the only thing is that next year’s financial results may be a weaker one on a year-on-year basis due to the lack of additional revenue generated from the panic buying.
That said, this post is by no means a buy or sell recommendation for the shares of Sheng Siong Group Limited. Please do your own due diligence before you make any investment decisions.
Disclaimer: At the time of writing, I am not a shareholder of Sheng Siong Group Limited.
Stop Spending Hours Reading REIT Reports Every Quarter!
What if you could assess a REIT's portfolio occupancy, debt profile, valuation, and overall health in less than 30 seconds - without having to comb through a single quarterly report?
That's the problem the REIT Screener was built to solve.
Developed through a collaboration between ShareInvestor and The Singaporean Investor, the REIT Screener consolidates many of the key metrics and indicators I personally use when analysing REITs into one easy-to-use platform. Instead of spending hours extracting data manually every earnings season, you can now monitor the REITs you own and research new opportunities in just a few clicks.
If you're serious about REIT investing but don't have the time to manually track quarterly developments, the REIT Screener could be the shortcut you've been looking for:

Take a closer look at the REIT Screener here...


Comments (0)